
Advisor Perspectives welcomes guest contributions. The views presented here do not necessarily represent those of Advisor Perspectives
Q3 hedge fund letters, conference, scoops etc
With the U.S. stock market hitting all-time highs, a question you may be asking yourself is, how should I be feeling about that? Phrased another way, how common are market highs? Are they extremely rare and should I be panicking or are they pretty much par for the course?
To try and answer these questions we must put market highs into historical context.
The Eye Test
The chart below illustrates the growth of $1 invested in U.S. large cap stocks on January 1, 1926. At the end of September 2018, after factoring in the reinvestment of dividends, $1 was worth $8,129!
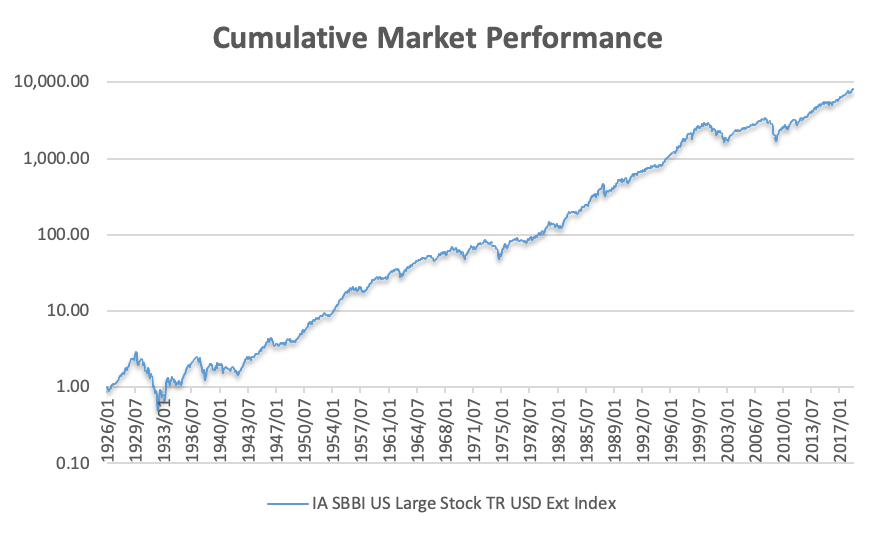
Data Source: Morningstar. Based on month-end values with dividend reinvestment.
Looking at this chart, you would think that the markets are hitting new highsi pretty much all the time! Unfortunately, this chart obscures a less rosy reality.
The stats
Over the almost 93-year history set out in the chart, U.S. large cap stocks experienced 119 periods where a drawdown occurred (i.e. where the value fell below its prior peak as measured at month-end). And although the average drawdown was -6.8%, there were eight time periods where the decline was greater than -20%. As you would expect, the largest of all the declines was the 83% plummet in the Great Depression followed by the 51% drop during the 2008-09 Financial Crisis.
The average time from peak to trough was just three months, although this ranged from as little as a month to the 34-month decline during the Great Depression. Recoveries took longer, five months on average. Generally, the deeper the decline, the longer the recovery. Where the decline was in excess of -20%, it took an average of three and half years to recover.
As a result, the average U.S. stock market investor spends the vast majority of their investing life with the value of their portfolio below prior highs. 71% of the time in fact. As illustrated in the following chart, since 1926 investors in U.S. large cap stocks spent 33% of the time watching the value of their stock portfolio fall, 38% of the time watching it recover and 29% of the time watching it hit new highs.
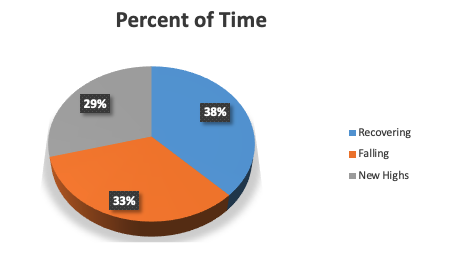
Source: Tacita Capital Analysis with Morningstar data. Based on month-end values with dividend reinvestment.
That was probably not what you were expecting after looking at the chart on the first page. But what this does tell us is that market highs do occur with some relative frequency and are not complete unicorns. Nor are they the natural steady state. New highs are one of three normal and surprisingly balanced parts of the market cycle.
What about a more balanced portfolio, you might ask? Most people do not invest 100% of their portfolio in stocks anyway. Certainly a more balanced mix will lead to better results. Unfortunately, this is true only to a degree.
Read the full article here by James Nairne, Advisor Perspectives

