
The thing to do is watch the market, read the tape to determine the limits of the get- nowhere prices, and make up your mind that you will not take an interest until the price breaks through the limit in either direction. ~ Jesse Livermore
Q1 hedge fund letters, conference, scoops etc
Every weekend I scroll through probably a 100+ charts. I figured I’d try sharing a dozen of the more interesting ones that catch my eye. Let me know if you find any value in this.
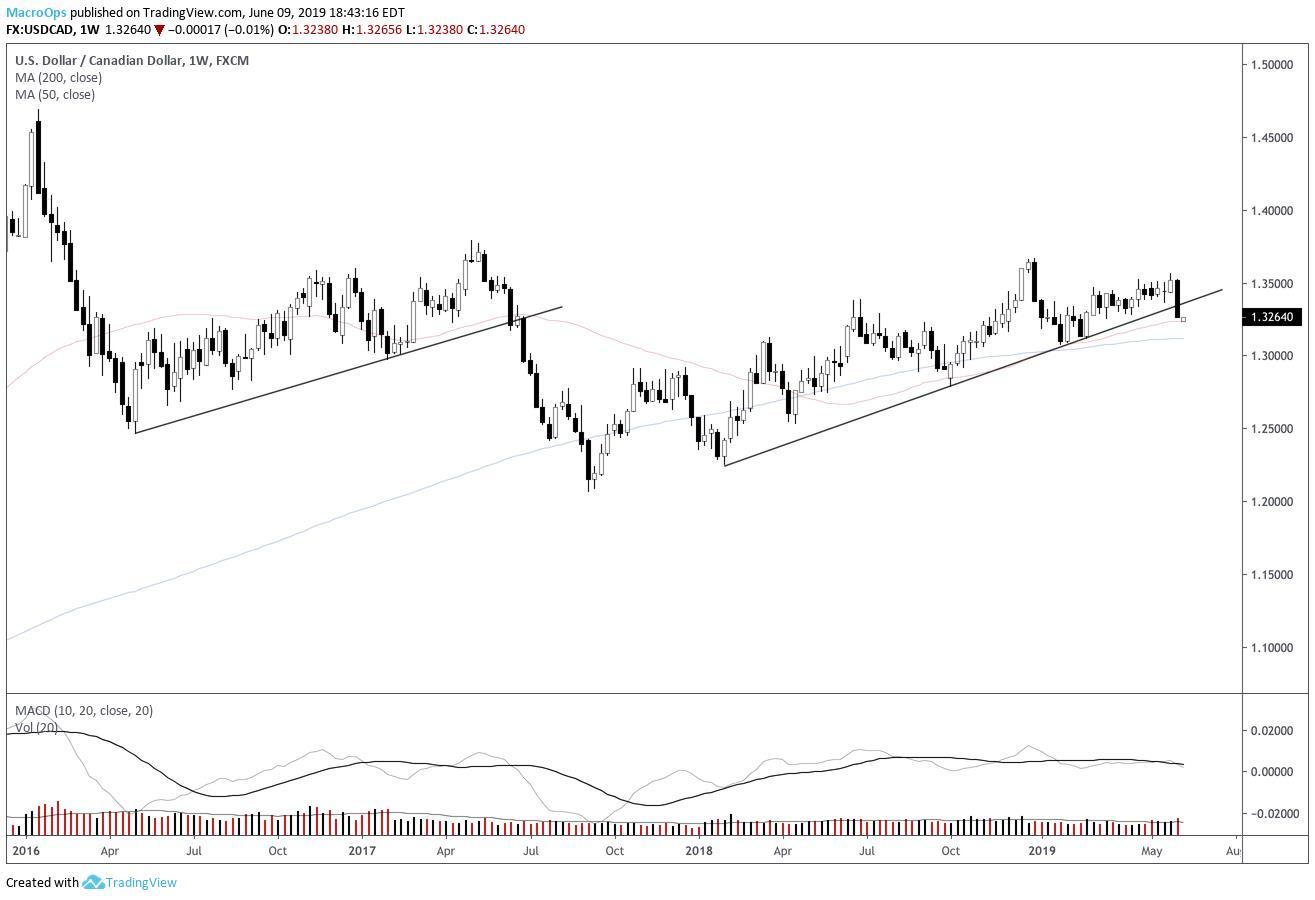
- USDCAD has broken below a major support line (chart is a weekly).
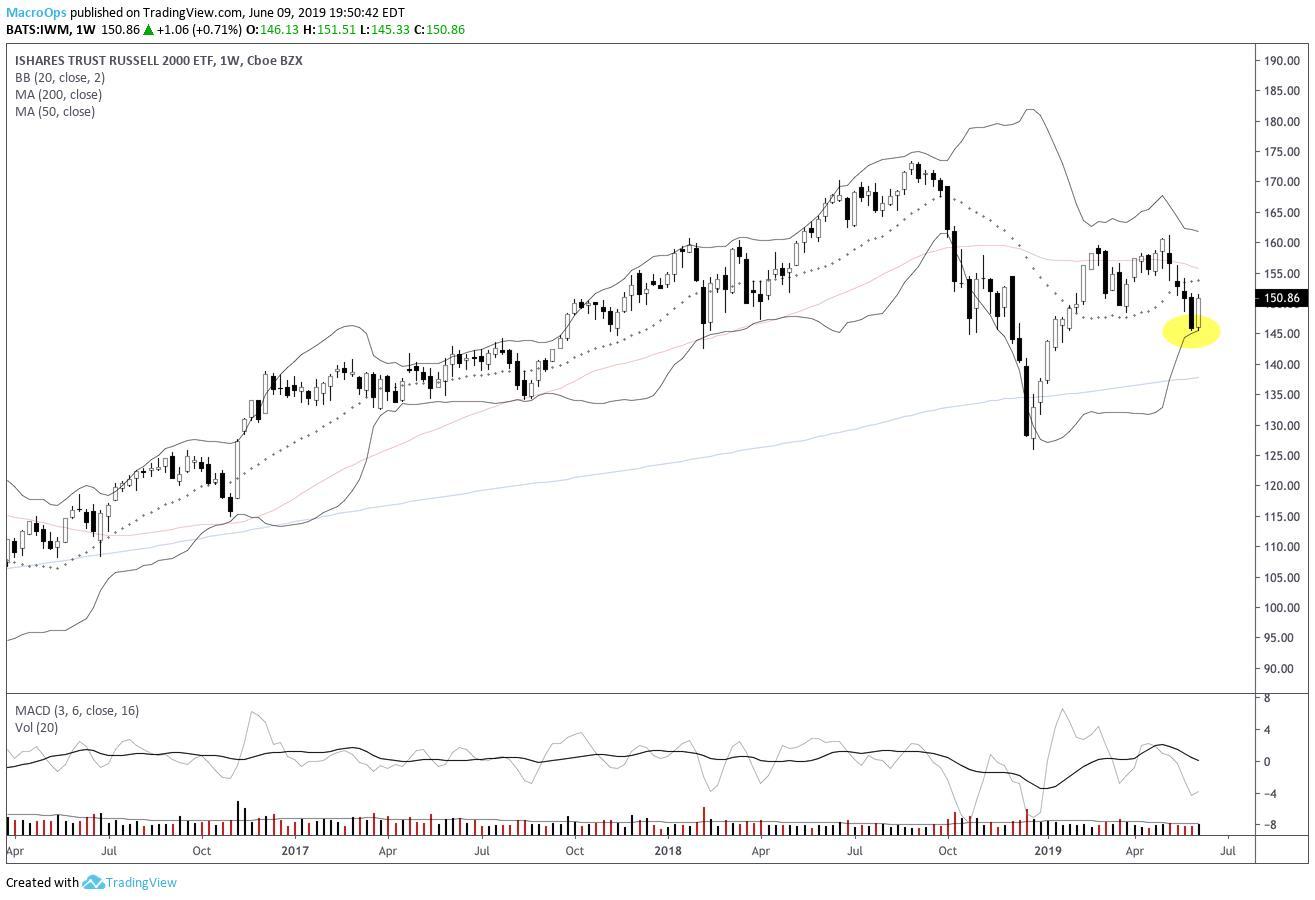
- Small-caps (IWM) bounced off their lower Bollinger Bands this past week (chart is a weekly).
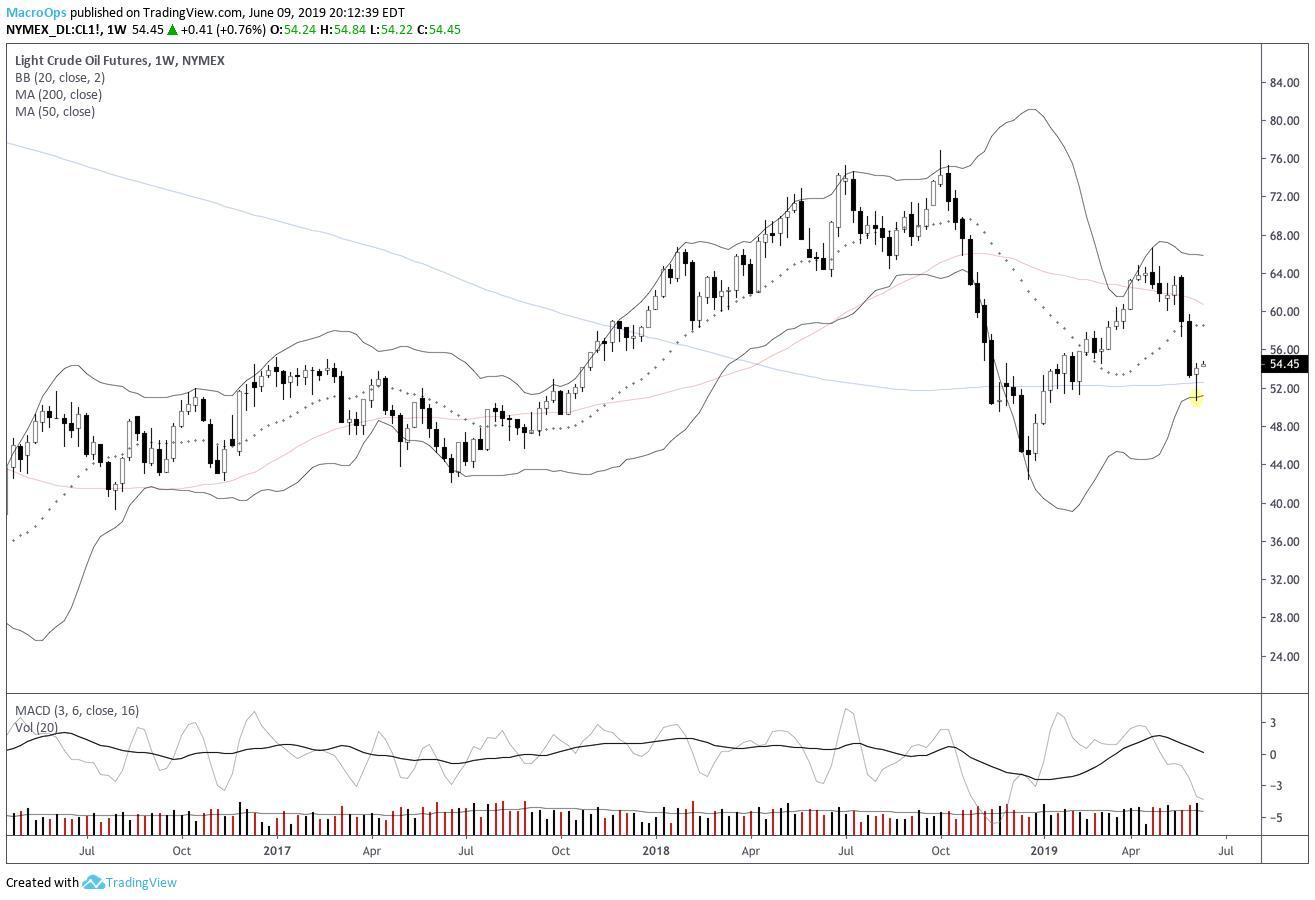
- As did crude (CL_F) (chart is a weekly).
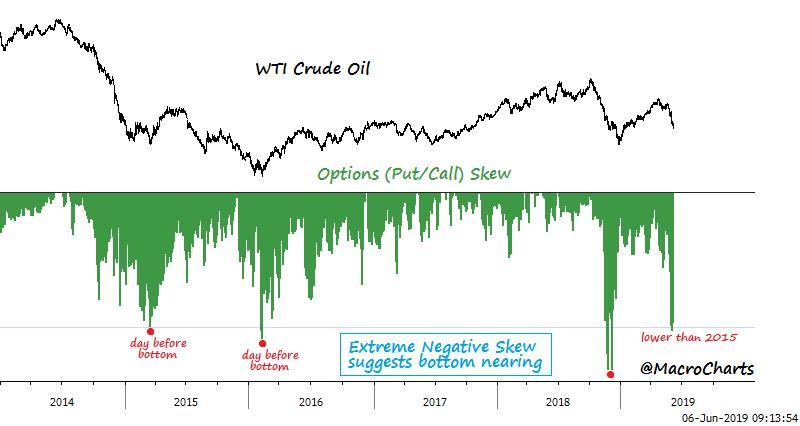
- Crude’s skew is at extremes suggesting a bottom is near (chart via @MacroCharts).
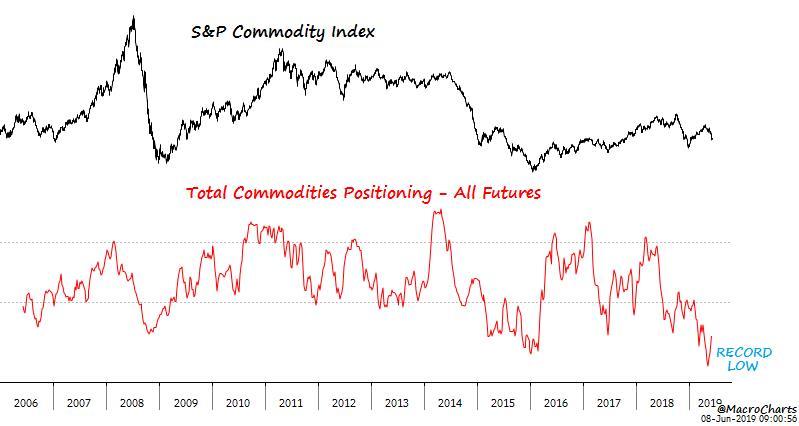
- Total spec positioning in commodities futures at RECORD low levels (chart via @MacroCharts).
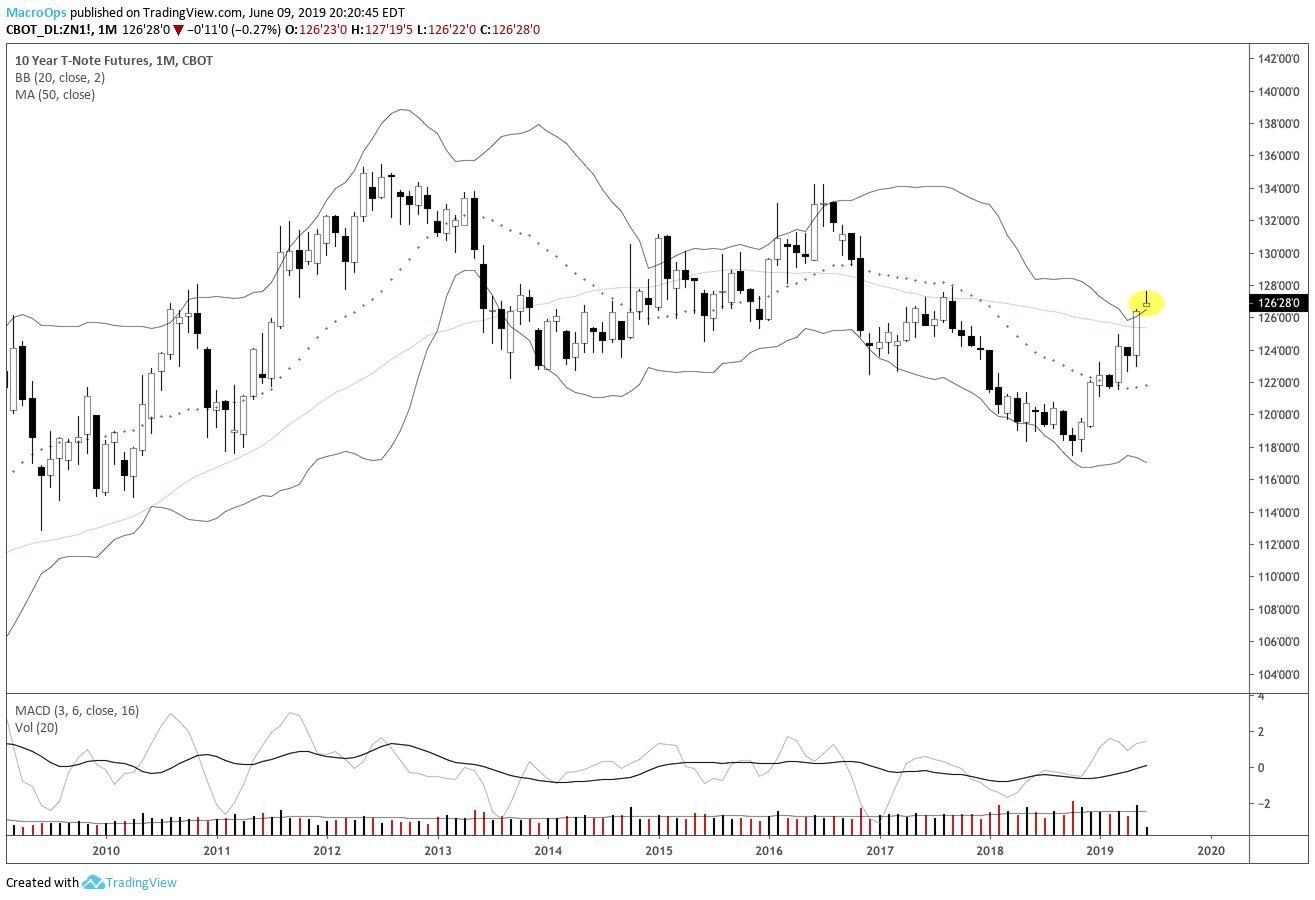
- 10-year USTs (ZN_F) are trading above their monthly Bollinger Band. Reversal coming soon?
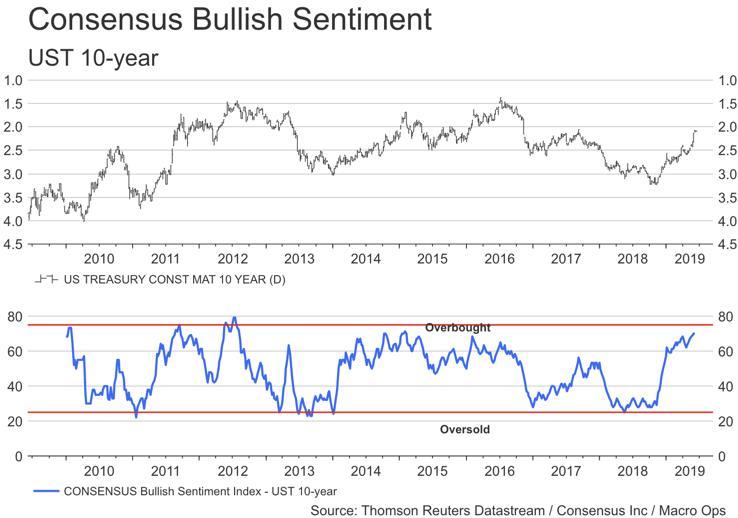
- Consensus Inc. UST 10yr bullish sentiment nearing overbought levels.
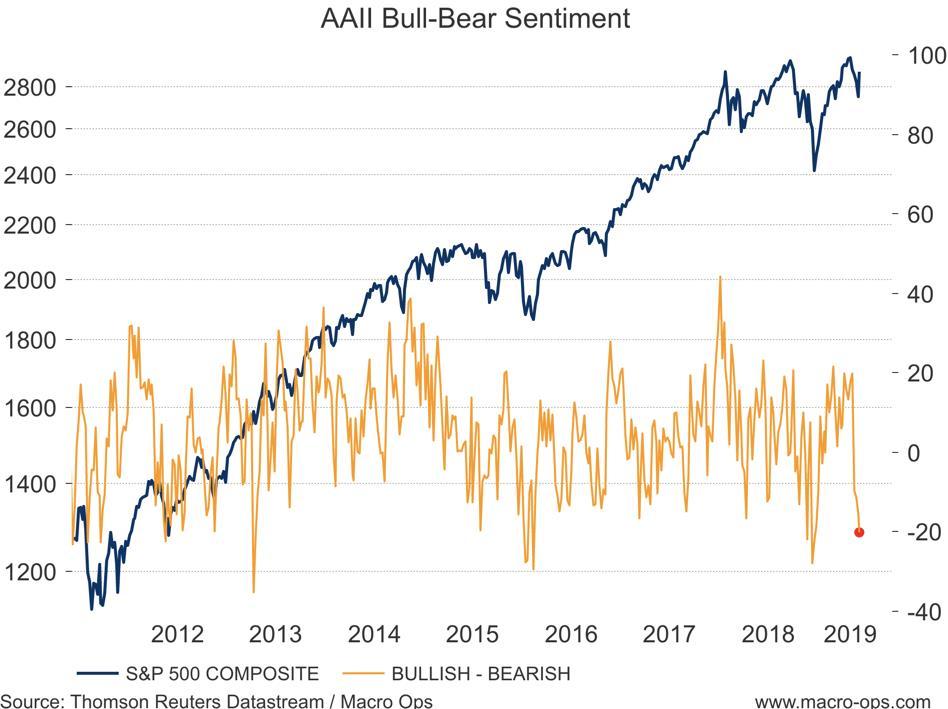
- AAII Net Bull/Bear Sentiment near Dec 18’ lows despite recent rally in stocks.
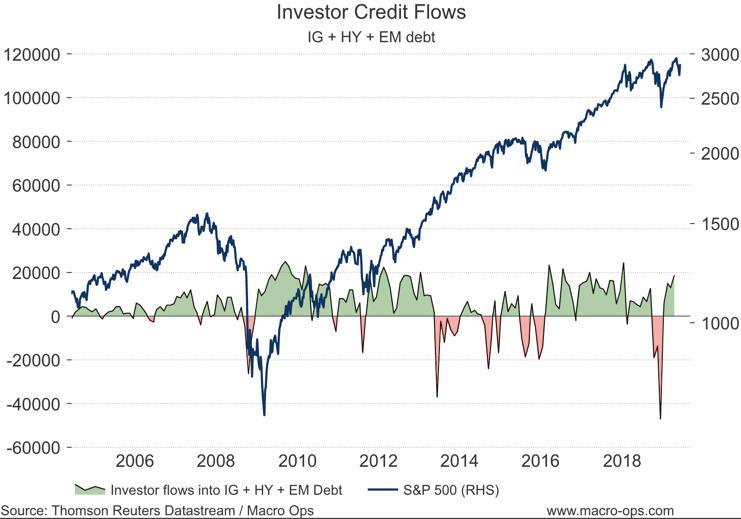
- Investors continue to pile into credit after record outflows in December. This is a bullish sign for stocks as credit tends to lead equities.
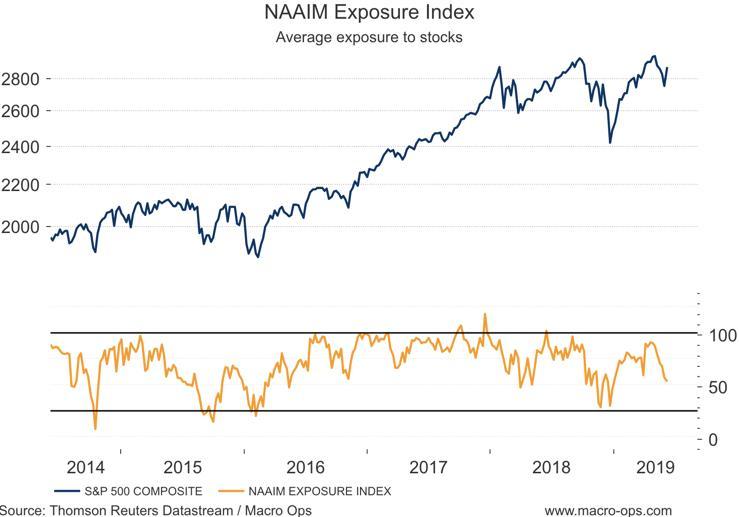
- NAAIM Exposure Index shows that investors are not buying this rally.
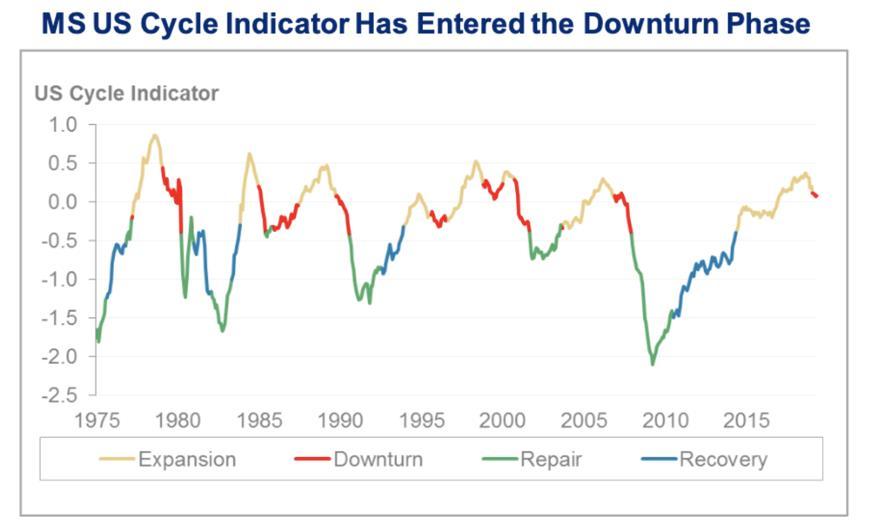
- Morgan Stanley’s US Cycle indicator recently entered the “Downturn” phase.
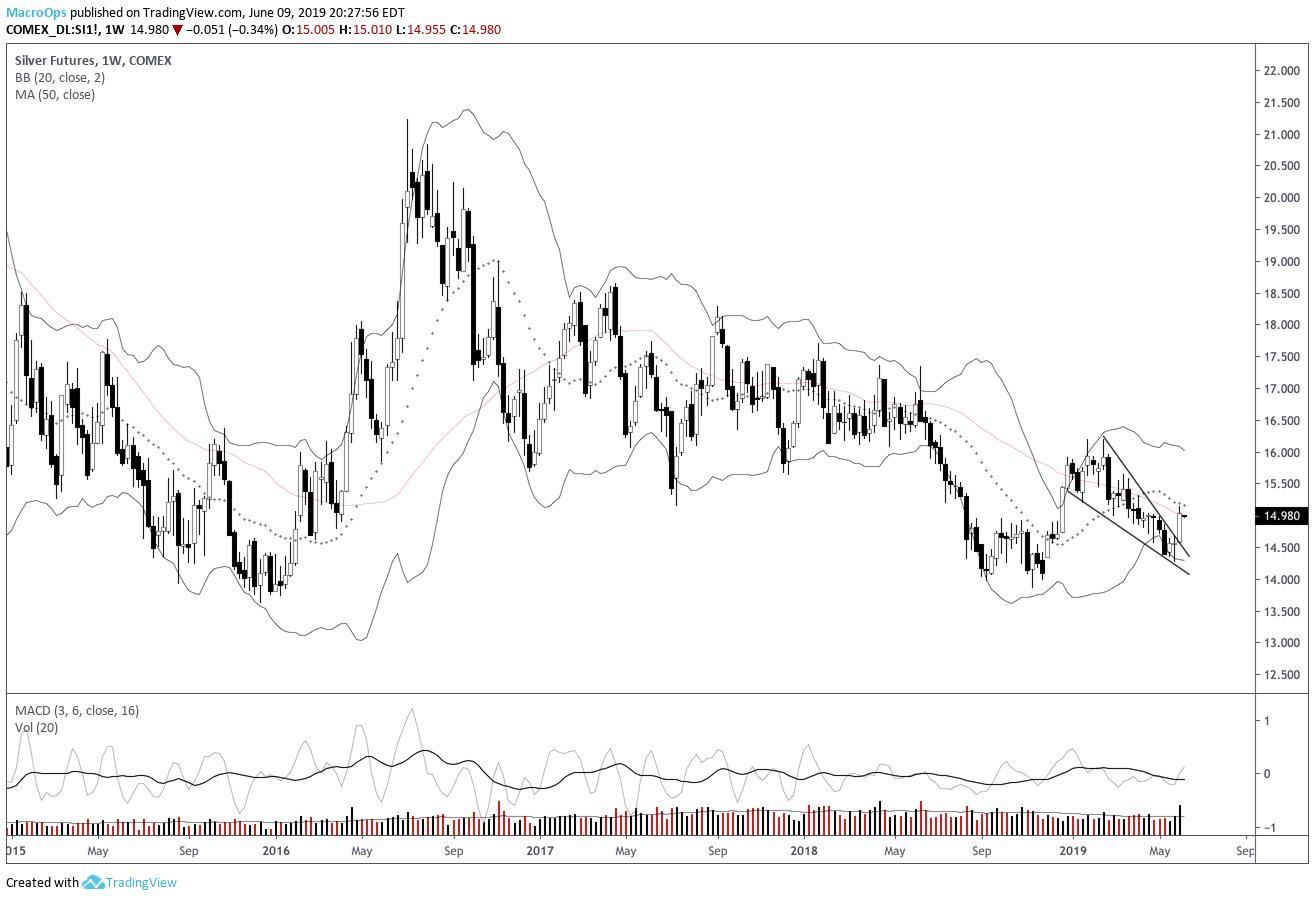
- Silver (SI_F) broke out of a descending wedge last week on strong volume. Commercial hedgers are net-long silver for only the second time in history.
Article by Alex Barrow, Macro Ops

