
My lesson from Soros is to start every meeting at my boutique by convincing everyone that we are a bunch of idiots who know nothing and are mistake-prone, but happen to be endowed with the rare privilege of knowing it.” ~ Nassim Taleb Good morning! In this week’s Dirty Dozen [CHART PACK] we go through the latest BofA Fund Manager Survey, find that investor sentiment is “unambiguously bullish”, look at the fiscal impulse and the breakdown of a potential infrastructure package, then dive into yields, yield curves, NIM, and end with a bull pitch for a Japanese bank, plus more… Let’s dive in.
Q4 2020 hedge fund letters, conferences and more
- “Investor sentiment is unambiguously bullish…” seems to be the main takeaway from the latest BofA Global Fund Manager Survey. Other highlights below.

- I grouped together my favorite charts from the report. Investors are beginning to crowd onto one side of the boat. That side being the bullish reflationary, short rates and USD, long commodities and value side.

- There are good reasons to be bullish here. We have a clear paradigm shift at the Fed and a new approach to fiscal from our Game Masters. But, we could be nearing the point where the market has discounted all the good news and some… JPM writes “The whatever-it-takes mindset that lifted markets in 2020 now risks becoming the too-much-of-a-good thing that creates recurring drawdowns in 2021-22 via rethinks on inflation and Fed policy.”

- The risk is that ample fiscal and a booming recovery get the Fed to back away from its pro-cyclical policy stance and the bond market responds with violent rate increases, a la 2013 taper tantrum.
I don’t see that as likely but the market may need more convincing. Either Way, we do need more spending on infrastructure so hopefully “infrastructure week” bears some fruit this time (charts via MS).

- I’ve been writing about the potential for a US dollar to retrace due to “dollar smile” dynamics, driven by the widening gap in US vs RoW growth. So far, this has failed to materialize. Instead, we’ve gotten some sideways consolidation which has helped reset some of the crowded short positioning. If that’s the best USD bulls can do, it would be quite a bearish signal.

- I shared this chart of the 10-year yield / 40-day moving average spread roughly four months ago, using it to argue that the rally still had a ways to go. That has now played itself out and it may be time to look for a reversal as yields are now stretched to the upside.

- We wrote up the bull case for housing back in the middle of last year, citing demographic tailwinds and incredibly tight supply. Nothing has changed except now consumers have more cash.
Inventory remains extremely tight. There are only 2-months of supply in both the new and existing home market. And new construction is not keeping pace with household formation (see CVCO & HOV).

- Short-term breadth on the Qs is near a critical juncture. Last week it bounced off a level that typically marks short-term bottoms. If it fails to hold and breaks lower this week or next, it’ll open us to much greater downside. Something to keep our eyes on.

- Bitcoin may be the most anti-ESG asset. Read the following from BofA, “While the 40mn ton increase in CO2 emissions in the past two years is concerning we find even more worrying the price sensitivity of Bitcoin to modest dollar capital inflows. In fact, back-of-the-envelope calculations suggest that rising bitcoin prices could push Bitcoin C02 emissions to levels rivaling some of the largest economies in the world… This comes at an enormous cost with arguably a limited social purpose.”

- Trahan Macro argues that the 2-year change in 10s signals that the reflation trade still has some legs.

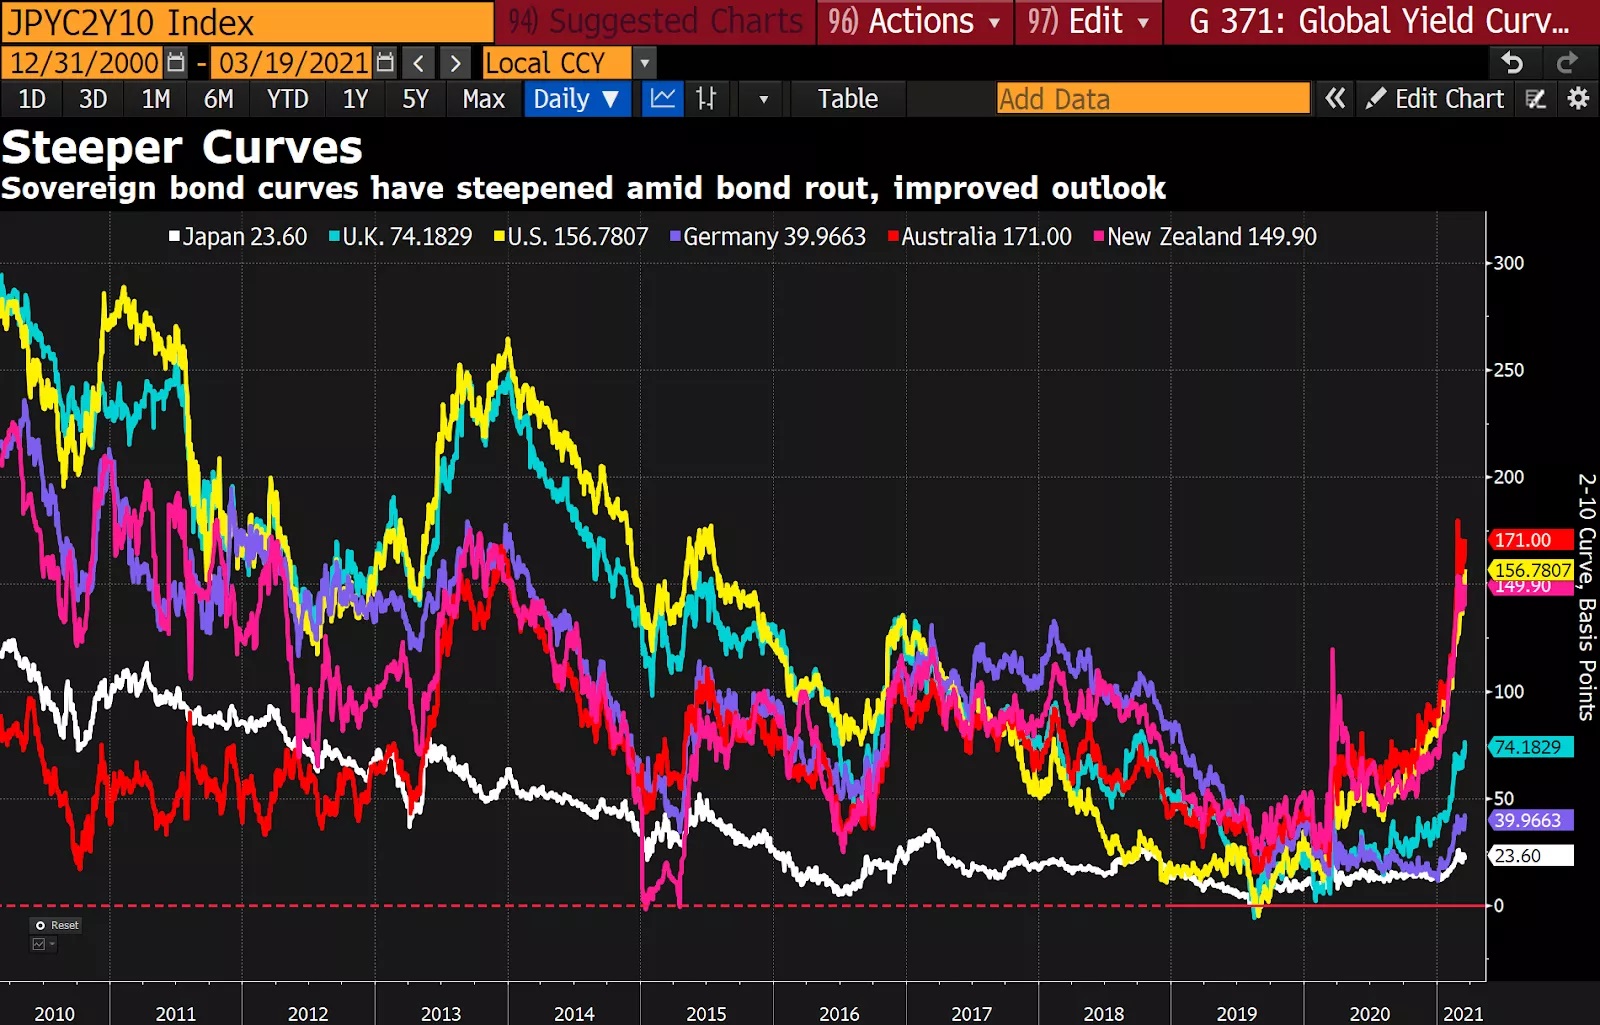
- Yield curves around the world continue to steepen, which is driving some recent outperformance from financials — steeper curves translate into greater net-interest margins (NIM) as banks lend short and borrow long.

- Japanese financials in particular are on *fire emoji*. My favorite chart amongst the group is the one below, of Nomura Holdings Inc, (NMR) on a monthly basis. It’s broken out of a 12-year wedge bottom. The company has seen 11-years of rising EPS.

Stay safe out there and keep your head on a swivel.
Article by Macro Ops

