Logos Capital 2017 letter to investors – some select sections – for more of their top picks check out HiddenValueStocks for the full letter and our recent interview with Logos where they pitched two of their favorite under the radar plays.
“The problem is to distinguish between being contrary to a misguided consensus and merely being stubborn.” – Robert Arnott and Robert Lovell Jr.
[timeless]
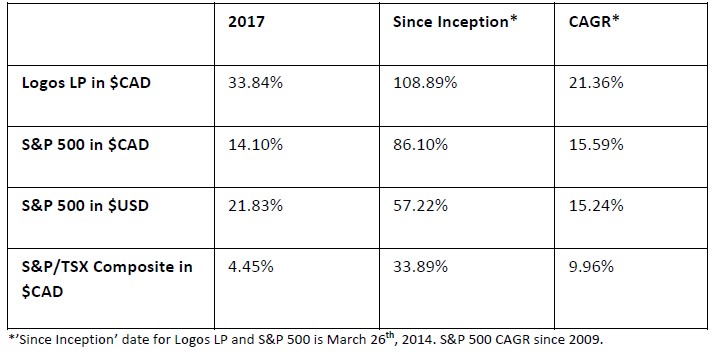
The following table represents Logos LP’s 2017 total unlevered net return compared a basket of relevant indexes. The current price per unit (as of January 9th) is $26.19 compared to $19.15 as of December 30th, 2016:
Annual Performance and Expected Returns
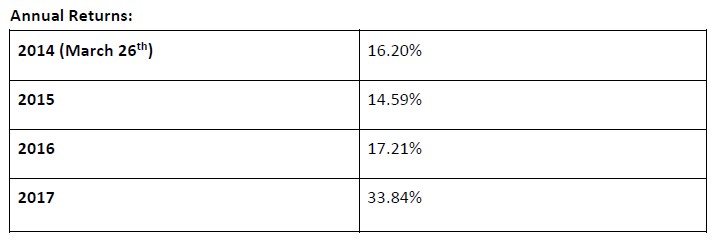
The following table represents the annual performance for the portfolio over the past 4 fiscal years:
At 21.36% compounded annually, the fund is about 37% above the rate of the S&P 500 ($CAD). $100 invested in the fund on March 26th, 2014 (at $12.52 per unit) would be worth $209.19 as of the date of this letter. However, we caution that our current rate of performance will be difficult to maintain over the long-term. We are likely closer to the end of this ageing bull market than we are to its middle and thus we don’t expect to see the same returns in 2018 that we saw in 2017.
As we re-set expectations in an environment suggesting lower returns we will do the things we have always done remaining largely fully invested employing more caution than usual especially with regards to price and we will work diligently to find special low-risk, high-uncertainty/high-return opportunities which typically lie “off the beaten track” as multiples continue to stretch relative to historical averages.
At present we are finding a relatively small investable universe vs. previous years yet we see opportunity in underfollowed and unloved stocks under $3bn in market cap which generate above average profits and returns relative to their peer and industry groups.
As such, we will be looking to continue rotating out of certain peripheral positions that have risen significantly in 2017 reaching our estimated intrinsic values in order to allocate into companies that have high rates of operating income growth, declining capex spending, below average forward PE ratios and low (or zero) levels of debt that have underperformed in 2017.
Lessons Learned
“Success is the ability to go from one failure to another with no loss of enthusiasm.” – Winston Churchill
The biggest mistake most people make is to fail to see themselves and others objectively, which continuously leads them to clash with their own and others’ weaknesses. After stepping back and looking upon our year from afar we’ve learned the following:
Lesson #1: Our “Core”/ “Peripheral” Portfolio Construction Methodology Seems To Be Working
2017 was an important year for Logos LP as our investment process and more specifically our portfolio construction methodology (Cores/ Peripherals) was squarely put to the test.
…………………………
Lesson #2: Selling Is An Art
Making an investment is only half the battle. In fact, this year (almost 4 years since our inception) we’ve been reminded that buying is the easy part. Selling a stock is the more difficult decision and necessitates a clear framework. Fellow value investor Mohnish Pabrai, in his book, The Dhandho Investor, reminds us that before we think about buying a stock we need a clear exit plan. Before entering a stock and determining the exit plan, we seek to answer the following in the affirmative:
1) Is this a business I understand quite well within my circle of competence?
2) Do I know the intrinsic value of the business today and, with a high degree of confidence, how likely is it to change over the next few years?
3) Is the business priced at a significant discount to its intrinsic value today and in two to three years? Over 25%?
4) Would I be willing to invest a large part of my net worth into this business?
5) Is the downside minimal?
6) Does the business have a moat?
7) Is it run by capable and honest managers?
As important as this rough check list is, after almost 4 years since inception, fully invested entering 2017, this year required great attention to our framework for the sale of stock. As a rough guide we used the following principles:
Any stock that is bought cannot be sold at a loss
1) within 2 to 3 years of buying unless;
2) we can say with a high degree of certainty;
3) that current intrinsic value is less than the current price the market is offering.
Why 2-3 years? Although, different value investors approach this rule differently such as Guy Spier in The Education of a Value Investor who favors a 2 year no sell period if the stock tumbles post purchase or 1 year favored by Joel Greenblatt in the Little Book That Beats The Market, we have learned that our “Core”/ “Peripheral” Portfolio Construction Methodology best fits the 2-3 year rule.
As Mohnish Pabrai reminds us, markets are mostly efficient and, in most instances, an undervalued asset will move up and trade around (or even above) its intrinsic value only once the clouds have lifted. Such clouds will typically clear in roughly two to three years. Stock prices can change in minutes, yet real business change takes months if not years. The other advantage of the 2-3 year rule is that it allows us to exit a position if we are simply wrong on our perception of intrinsic value without incurring unwanted opportunity costs.
Lesson #3: Invest in Low-Risk, High-Uncertainty Businesses
In 2017 we learned firsthand the power of Mohnish Pabrai’s concept of Dhandho: minimizing risk while maximizing returns. Often Wall Street gets confused between risk and uncertainty as uncertainty can be understood as the existence of clouds that have formed around the business and thus growth/outcomes aren’t clear. The astute value investor can profit handsomely from that confusion.
Here are a few scenarios that typically lead to a depressed stock price:
High risk, low uncertainty
High risk, high uncertainty
Low risk, high uncertainty
Low risk and low uncertainty
It is the fourth logical combination that is most loved by Wall Street yet such stocks often have some of the highest trading multiples (think Boeing, Mastercard, Visa, Wal-Mart, Microsoft, Colgate etc.).
……………………………
Wall Street is often unable to distinguish between risk and uncertainty and gets the two confused. Excellent returns can be made by spotting low-risk, high uncertainty bets and taking advantage of Wall Street’s handicap.
Lesson #4: The Trend Can Be Your Friend
One book we highly recommend is the latest edition of James O’Shaunghnessy’s “What Works on Wall Street” as it dives deep into various strategies studies from a statistical perspective to find which ones performed the best over the long-run, using stock price data sets as far back as 1927.
In the pursuit of potential peripheral positions in our portfolio, we came across an interesting study that was mentioned in the book which focused around short-term price appreciation or relative price strength and suggested that following pricing momentum could produce outsized returns. The study referenced a book titled “The Wisdom of Crowds” written by James Surowiecki which provides insight into the ‘intelligence’ of crowds over time and how this may impact future stock prices:
“Surowiecki says that if four conditions are met, a crowd’s “collective intelligence” will prove superior to the judgments of a smaller group of experts. The four conditions are: (1) diversity of opinion; (2) independence of members from one another; (3) decentralization; and (4) a good method for aggregating opinions. He then goes on to list several accounts where crowds were far more accurate than any individual trying to make a correct forecast. Generally speaking, these four conditions are present in market-based price auctions with the final price of a stock serving as an aggregator of all market opinion about the prospects for that stock. The only time this is not true is when markets are either in a bubble or a bust. At these market extremes, uniformity of opinion occurs, which impairs the ability of a group to offer good collective judgement.”
Could the trend of “wise crowds” truly be your friend? O’Shaughnessy studies three-, six-, and twelve-month price appreciation from the same start date (January 1st, 1927) and also combines multiple factors with price appreciation. The most powerful strategy purchases 25 stocks with the best 12-month price appreciation that (1) are small caps; (2) with price-to-book in the lowest three deciles (lowest 30% price-to-book ratio); and (3) have three- and six-month price appreciation greater than zero. This strategy provided an impressive compounded annual return of 18.16% since 1927 which turns $10,000 into $8.78 billion by December 31st, 2009. In another study, combining three- and six-month appreciation for small stocks with the highest shareholder yield (companies that have the greatest dividend yield plus share buyback yield) produces an annual compounded return of 15.98% since 1927, which turns $10,000 into $1.9 billion. Furthermore, by simplifying the strategy into a single factor (i.e. using only price appreciation), an investor would still realize an impressive return over a very long period of time. If one were to purchase any stock with the best six-month appreciation since 1927, that investor would have realized a compounded annual return of 14.11%, which would have turned $10,000 into $572,831,563 at the end of 2009. Clearly, momentum matters and ‘intelligent crowds’ can provide investors with incredible opportunities over the long-term, especially if they are small.
Although contrarian thought provides investors with the ability to realize investments before a ‘wise’ or ‘intelligent’ crowd discovers them, there is value in understanding the trend relative to fundamentals for any given stock, especially those with rising intrinsic value and are shareholder friendly. However, we do not want to confuse ‘intelligent crowds’ with groupthink or manias, which are born out of conformity.
The very existence of intelligent crowds is contingent on the factors listed above and the individuals who form the crowd must remain independent and have diverse opinions. Given the data, O’Shaugnessy provides three possible reasons as to why relative price strength is a winning strategy:
“Price momentum conveys different information about prospects of a stock and is a much better indicator than factors such as earnings growth rates. Many look at the disappointing results of buying stocks with the highest earnings gains and wonder why they differ from the best price performers. First, price momentum is the market putting its money where its mouth is. Second, the common belief that stocks with strong relative strength also have the highest PE ratios or earnings growth is incorrect. When you look at the top performers over time, you find that they are rarely the highest valued in terms of PE or price-to-sales ratio. The same is true for five-year earnings per share growth rates and one-year earnings per share growth rates….Surowiecki’s concept of “wise crowds” is proven out in the longer-term data for price momentum, with price movement being an excellent measure of what the overall market opinion is of the current price.”
What we’ve learned from O’Shaugnessy’s book is that when it comes to investing, the multifactor approach to decision making is a simple yet powerful idea. For many of the ‘peripherals’ that we monitor, we look for various indicators such as price strength in addition to a variety of other fundamental factors. Combining these kinds of indicators with special situations, arbitrage opportunities, potential ‘‘baggers’ or distressed assets can provide significant returns over the long-run and is the difference between substantial value creation and erosion.
Lesson #5: Increasing Return On Invested Capital Can Suggest The Existence Of A Moat
In the pursuit of deepening our understanding of businesses with durable competitive advantages or “moats” (which form the basis for our ‘cores’), something we’ve specifically noticed in 2017 that we will be focusing more on as we allocate in 2018, is increasing Return On Invested Capital (ROIC). This underrated data point that we like to look at when evaluating a potential position can be understood as the percentage of capital expenditures out of operating cash flow relative to return on invested capital. Companies that spend less of their operating cash flow on capital expenditures (i.e. asset-light businesses) will have higher returns on invested capital over the long-run (assuming predictable margins and stable revenue growth) and a declining trend in capex as a percent of operating cash flow can be a useful predictive indicator of an increasing ‘forward ROIC’ metric. Companies with higher forward ROIC and ROE in conjunction with greater operating efficiency (continued growth in operating profits) and growing revenue are companies that we would certainly be interested in..
Overview of 2017 and Outlook for 2018
“The only function of economic forecasting is to make astrology look respectable”-John Kenneth Galbraith
Although we caution that making predictions will only lead to either being lucky or wrong, with 2017 in the rear view mirror, it is worthwhile to reflect on some of the big market events of the past year as we look to 2018: the U.S. Presidential elections, Brexit negotiations and Catalonia, the future of U.S. trade, unravelling of Dodd-Frank, tax overhaul, the U.S. economic boom and continuous stock index records, crypto mania, media company M&A, net neutrality repeal, OPEC output cut extension, Paris and Iran deal pullout, North Korea tensions, the EU’s war on tax avoidance and new Fed leadership.
How did our suggestions for 2017, outlined in our 2016 annual letter fair?
1) Markets and economies did go through a transition period and Trump furthered an on balance, pro-growth business friendly agenda. Nevertheless, our call that regional banks would outperform the S&P did not play out as inflation lagged and 2016’s leaders continued to lead in 2017. If you believe inflation will rise in 2018, look for banks to outperform.
2) 2017 did not prove to be an inflection point for management styles as growth based strategies continued to outperform value (although even value stocks now appear crowded). Strength begets strength as fund flows followed momentum. We see more of the same in 2018.
3) Many emerging markets had an excellent 2017. Such markets shrugged off jitters faced at the end of last year over the potential trade and foreign policy implications the new administration of U.S. President Donald Trump would have on emerging market regions. While geopolitical uncertainty was a major focal point early in 2017 — with several North Korean missile launches initially prompting investors to move into safe-haven assets — risk appetite has since improved, with markets looking instead to stronger economic growth globally. We see emerging markets continue their run in 2018 and are likely to have their best year since 2014. China will be the wild card as President Xi Jinping finally seems committed to deflating the country’s bubble economy. This process could go horribly wrong as addressing asset bubbles has always been a difficult task yet the government’s tight control of banks and the money it can spend if trouble begins to brew, make a bust in 2018 improbable.
4) The elite remained disconnected from reality in 2017 legislating primarily in their own interest and even the “disruptors” in Silicon Valley receded further into their own bubble. The image of the Valley as home to nerdy, mission-driven underdogs changed as the general public came to see tech founders as the contemporary equivalent of Wall Street bankers in the 1980s. Too many people with too much money has bred arrogance, bad behavior, and jealousy, and society is more interested than ever to take it down. We see these trends continuing in 2018.
Turning to 2017’s market dynamics, the year turned out to be a year in which an investment strategy based on nothing more than sticking with winners worked best. Long momentum, when investors simply buy shares that are rising the fastest, returned 38 percent in 2017, the strongest advance since 1999. This could be viewed as a bit of a turning point for equities.
Less hated, less distrusted, the bull market born at the bottom of the financial crisis took on more of a speculative spirit by the end of 2017, with gains building and valuations pushing ever higher.
The question is whether investors are finally falling in love with the entire market? Are some of the most popular strategies now (supercharged by exchange traded funds) creating self-perpetuating flows of capital and significant risk? Or is the risk worth taking given the fact that the stock market rises in 76% of all years, that it gains an average of 7.5% per year and that annual falls greater than 20% occur less than 5% of the time? Lets remember that since 1980 the S&P has suffered an annual loss of less than 3% an overwhelming 84% of the time?
What can we glean from this environment? Should we heed the warning of luminaries such as Howard Marks who have recently suggested that investors are no longer being offered value in the market at cheap prices and thus should pull back and be less aggressive? Should we accept that the market is not currently a “nonsensical bubble” but rather is simply high and therefore risky?
Or should we be less concerned about valuations and buy into Trump’s constant tweets about the strength of the US economy?
On the economic front there appears to be some accuracy in Trump’s braggadocio. Heading into 2018, America’s economy is in relatively good shape. For the past 2 years many have had their attention so consumed by vile politics magnified by attention grabbing social media that they have failed to notice economic improvement.
Two common complaints from earlier in the decade have begun to look tired. The median household income is no longer stagnant, having grown by 5.2% in 2015 and 3.2% in 2016, after adjusting for inflation. During those years poorer households gained more on average than richer ones. Business investment is no longer weak: it drove growth in the third quarter of the year and both business and consumer confidence (consumer borrowing is surging and household savings rates are decreasing) is high. Jobs are plentiful. In November non-farm companies added 228,00 workers to their payrolls. The unemployment rate is 4.1%, the lowest figure for more than a decade. The availability of jobs is drawing more of the working-age population into the labour force. Tax cuts are poised to stimulate the economy further, deflation fears have been banished and some are beginning to ask not when growth will pick up but whether the economy may overheat.
Political volatility doesn’t always equal stock-market volatility and thus 2017 served as a great reminder that political prejudice should stay out of one’s investment strategy. Nevertheless, as the recovery settles in, might 2018 set the stage for the next recession? The concern begins with history. Bull markets do not die of old age (although the world economy tends to tip into a recession every 8-10 years) yet as the business cycle matures, the probability of overheating increases because of bottlenecks in the job market; or that the central bank overtightened in order to prevent things from running too hot. America’s Federal Reserve will probably raise rates three times in 2018 after three increases in 2017 and will also begin unwinding the large pile of assets it acquired during the slump.
Although the Fed has promised to move slowly, higher interest rates are the elephant in the room of the global economy. Incoming Fed Chairman Jerome Powell will likely be much more accommodating to the White House than current Chair Janet Yellen, and absent things running too hot, a spike in yields in 2018 seems unlikely.
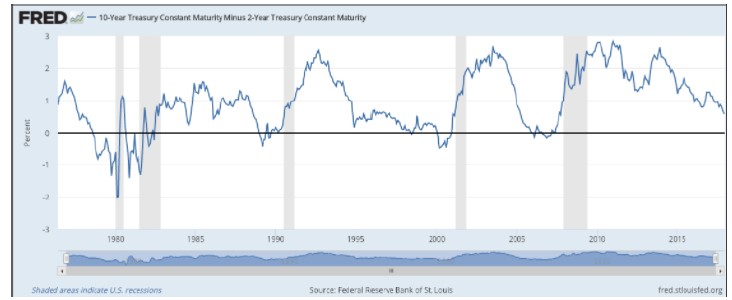
Nevertheless, the longer this cycle of growth marches on, the more scope there is for financial imbalances to develop (“running hot”) such as frothy asset prices or excess debt. Predicting when the next recession will begin is no easy task because the economy doesn’t operate on a set schedule.
But there is one market relationship that’s been a reliable indicator over that past 40 years or so — the spread between the two- and the 10-year Treasury yields. Every recession since the mid-1970s (the shaded regions) has followed an inverted yield curve when the two-year note yields more than the 10-year.