
Key Takeaways
- This bull market may be about to become the longest in history.
- The U.S. economy remains quite strong, with plenty of room for continued growth in our view.
- Recent stock market gains may be an indication of continued bullish momentum over the rest of 2018.
[timeless]
Q2 hedge fund letters, conference, scoops etc
The bull market continues to defy the skeptics and is now nearing a major milestone. On August 22, 2018, this bull market can overtake the bull market of the 1990s as the longest ever. From tariffs to trade wars to inflation to a flattening yield curve to a global economic slowdown, the headlines continue to cast doubt on the sustainability of this economic cycle and bull market. Although we see several potential stumbling blocks, we continue to believe this economy and stock market rally have plenty of fuel left in the tank.
Major Milestone
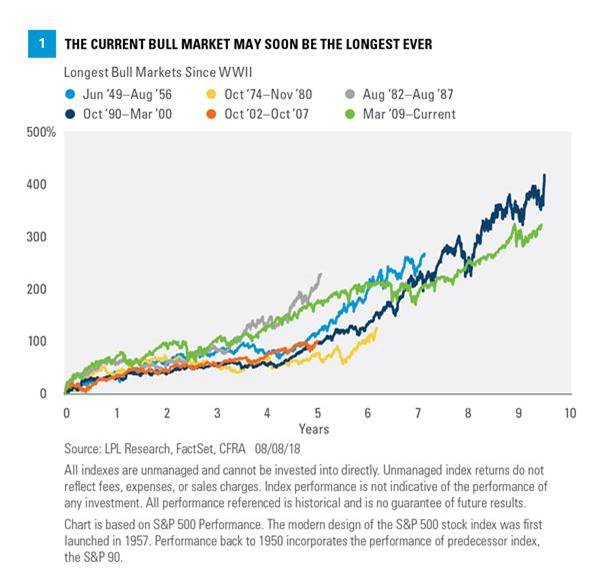
The current bull market was born on March 9, 2009, and is now just days away from topping the previous longest bull market from the 1990s. Next week, on August 22, this current bull can officially take the top spot as the longest ever [Figure 1]. This might be the longest bull market ever, but you could argue it isn’t the greatest; at least not yet. The S&P 500 gained nearly 420% during the 1990s bull market when all was said and done, versus the current bull standing just over 320%.

Age Is Just A Number
A 9-year-plus bull market is undoubtedly old, but we don’t think that means it’s necessarily near an end. Given the current oldest woman in America is 113 and the oldest man is 112 (and smokes 12 cigars a day), perhaps age is nothing more than a number. As we laid out in our Midyear Outlook 2018: The Plot Thickens, we believe that the underlying positives from fiscal policy, government spending, strong corporate earnings, and improving confidence should extend this economic cycle for at least another year, maybe more.
Here at LPL Research we like to say: “Bull markets don’t die of old age, they die of excesses.” The good news is we simply aren’t seeing the same types of excesses seen at previous major market peaks. There are several reasons we don’t expect a recession soon. One is that the past three recessions were preceded by annual wage growth of more than 4%. Recent data showed wages growing at 2.7% year over year, suggesting inflation remains tame. Second, the Conference Board’s Leading Economic Index (LEI), one of our favorite economic indicators, is up nicely. This indicator turned negative year over year ahead of every recession going back to the 1970s, which makes the 25 consecutive monthly gains and recent 5.8% year-over-year increase all the more impressive. Third, our proprietary Recession Watch Dashboard, which looks at 12 separate inputs—such as employment, inflation, housing starts, and earnings—continues to suggest a very low probability of recession within the next 12 months.
While this bull market and economic recovery may very well be old, adding it all up, we see few signs that suggest an end is near.
Long And Winding Road
This 9-year run has been anything but smooth. There were two significant corrections along the way. In fact, using a 20% correction as the endpoint, this bull market almost ended abruptly not long after it began. At its intraday lows, the S&P 500 corrected more than 20% in October 2011. The index rallied off the lows and closed down 19.4%, so we did not consider it the end of the bull market. A few years later, from the peak in May 2015 until the lows in February 2016, the S&P 500 dropped 14.2%. But there was significant damage under the surface. For instance, the median S&P 500 stock fell more than 25% peak to trough, while many energy and financial stocks were more than cut in half and the small cap Russell 2000 Index fell 26.4%. In other words, it might not have technically been considered a bear market, but if you held a well-diversified portfolio, it may have felt like one.
Is The Market Telling Us Something?
We all know that “Sell in May and go away” is based on the seasonal stock market pattern in which the six months from May through October are historically weak for stocks. Well, 2018 has bucked that trend, with the S&P 500 up nearly 7% since the start of May. As we noted in Don’t Sell in May, there were many signs that suggested higher stock prices during this time frame were possible. Now that it has happened, does it mean anything?
First off, be aware that August and September are historically two of the weaker months, so a pullback at some point in the near term would not surprise us. The good news is any market weakness may present a nice buying opportunity for suitable investors. The S&P 500 closed in the green in April, May, June, and July of this year, something that has happened in only 10 other years since 1950 [Figure 2]. In each of those years, stocks closed higher over the final five months of the year every time. In other words, when “Sell in May” doesn’t work, the stock market may be telling us more gains are on the way.
Conclusion
The ongoing bull market is almost certainly set to become the longest ever. What does that mean for investors? We know that volatility is normal late in economic and market cycles, and we expect more ups and downs over the rest of 2018; but that doesn’t mean the bull market is nearly over. In fact, when we look at the combination of stimulative fiscal policy, increasing government spending, robust corporate profits, strong consumer and business confidence, and low inflation, we think this economic expansion and bull market could potentially have years left to go.
Article by LPL Research

