
This Large Cap Value mutual fund only earns a 3-star rating from Morningstar. But, the fund earns our Very Attractive rating, which is based on true costs and the individual holdings of the mutual fund. When viewed through our lens, MassMutual Select Diversified Value Fund (MDDLX) looks poised to outperform and is this week’s Long Idea.
[timeless]
Holdings Quality Analysis Reveals Favorable Asset Allocation
The only justification for a mutual fund to charge higher fees than its ETF benchmark is “active” management that leads to out-performance. A fund is most likely to outperform if it has higher quality holdings than its benchmark. To make this determination on holdings quality, we leverage our Robo-Analyst technology to drill down and analyze the individual stocks in every fund we cover.
Figure 1: MassMutual Select Diversified Value Fund (MDDLX) Asset Allocation

Sources: New Constructs, LLC and company filings
Per Figure 1, MassMutual Select Diversified Fund helps to minimize downside risk compared to its benchmark, iShares Russell 1000 Value (IWD). MDDLX allocates only 23% of its portfolio to Unattractive-or-worse rated stocks compared to 38% for IWD. MDDLX also allocates 22% of its portfolio to stocks with an Attractive-or-better rating and 74% of assets to Neutral-or-better rated stocks. IWD allocates just 20% of assets to Attractive-or-better and 61% to Neutral-or-better rated stocks.
The fund’s top 10 holdings comprise 28% of assets, are all Neutral-or-better rated, and include some of our previously featured Long Ideas such as Verizon (VZ), Walmart (WMT), and Morgan Stanley (MS).
Given this favorable allocation relative to the benchmark, MassMutual Select Diversified Fund appears well positioned to capture upside potential while minimizing downside risk. Compared to the average mutual fund, MDDLX has a much better chance of generating the outperformance required to justify its fees.
MDDLX Finds True Value in Large Cap Stocks
True value investing still works despite the proliferation of passive strategies. While too many funds are labeled “value” despite holding too many expensive stocks, we see an exception in MDDLX. The fund’s manager does a good job allocating capital to higher-quality companies with lower-risk valuations.
Figure 2 contains our detailed rating for MDDLX, which includes each of the criteria we use to rate all funds under coverage. These criteria are the same for our Stock Rating Methodology, because the performance of a fund’s holdings equals the performance of a fund after fees.
Figure 2: MassMutual Select Diversified Value Fund Rating Breakdown
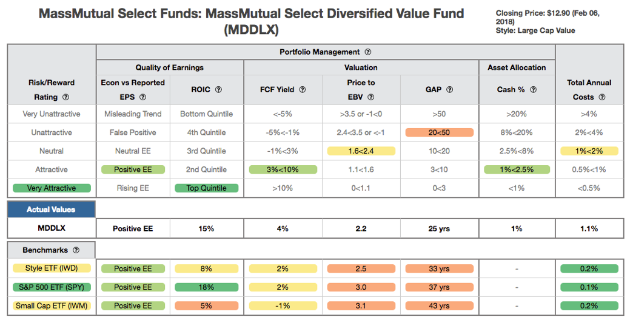
Sources: New Constructs, LLC and company filings
The return on invested capital (ROIC) for MDDLX’s holdings is 15%, well above the 8% ROIC earned by companies held by IWD. Further, the 4% free cash flow (FCF) yield of MDDLX’s holdings is double IWD, and the price to economic book value (PEBV) ratio for IWD is 2.5, while the PEBV ratio for MDDLX is only 2.2. The companies held by MDDLX earn superior cash flows and are valued at a greater discount to those cash flows than the benchmark.
Lastly, our discounted cash flow analysis of fund holdings reveals a market implied growth appreciation period (GAP) of 25 years for MDDLX compared to 33 years for IWD. In other words, IWD companies have to grow economic earnings for eight years longer than companies held by MDDLX to justify their current stock prices. This expectation seems even more unlikely given that MDDLX’s holdings are more profitable than IWD, as measured by ROIC.
Walmart Inc. (WMT) is one MDDLX’s top holdings and earns our Attractive rating and a spot in the most recent Focus List – Long Model Portfolio. WMT has consistently earned a high ROIC, has ample resources to invest in e-commerce, and owns an unmatched store footprint and distribution network across the globe. WMT has grown after-tax profits (NOPAT) by 7% compounded annually since 1998 while generating over $122 billion (41% of market cap) in FCF over the past decade.
However, investors’ concerns about Amazon’s threat to the traditional brick-and-mortar business model (despite AMZN expanding its physical presence) have left WMT undervalued. At its current price of $100, WMT has a PEBV ratio of 1.0. This ratio means the market expects WMT’s NOPAT to never meaningfully grow over the remaining life of the firm. Such an expectation seems overly pessimistic given WMT’s longstanding history of profit growth. However, if WMT can maintain TTM margins (3%) and grow NOPAT by just 2% compounded annually for the next decade, the stock is worth $119/share today – a 19% upside. Allocating to firms that generate significant cash flows at undervalued prices, such as WMT, provide the opportunity for MDDLX to outperform going forward.
MDDLX Earns Its Fees Over Time
With total annual costs (TAC) of 1.12%, MDDLX has lower expenses than 71% of all funds under coverage. MDDLX’s TAC is also lower than the funds in the Large Cap Value style, which have 1.67% average TAC and a slightly lower 1.33% weighted average TAC. Below average fees combined with quality holdings make MDDLX one of the most attractive funds in the Large Cap Value style
To justify its active management fees, MDDLX must outperform its benchmark (IWD) by 0.89% annually over three years.
While we fully recognize that past performance is no guarantee of future results, MDDLX’s intelligent portfolio management has clearly led to outperformance over the long term. Further, the fund’s performance has surpassed the 0.89% per year outperformance required to beat its benchmark. Per Figure 3, MDDLX has outperformed (measured by growth of $10K) its benchmark over the past one, three, and five-year periods compounded annually.
Figure 3: MDDLX vs. IWD: Growth of 10K Over Time
Sources: New Constructs, LLC and company filings.
MDDLX’s growth of 10K is less than 1% year-to-date, but is still outperforming IWD, which is down 1%. The underlying fundamentals and attractive valuations of MDDLX’s holdings provide an excellent opportunity for outperformance to continue.
The Importance of Holdings Based Fund Analysis
The analysis above shows that while the Large Cap Value style is filled with highly rated funds, picking the right fund can be difficult. While it can be easy to simply pick a 5-Star rated fund from Morningstar, research shows such a strategy does not necessarily lead to outperformance. Smart fund investing means analyzing the holdings of each fund, which is impossible for the average investor to perform.
Enter our Robo-Analyst technology which analyzes all 1,038 stocks in Large Cap Value style ETFs and mutual funds. In the process, we identified a mutual fund, MDDLX, that traditional, backward-looking fund research overlooks.
MDDLX is among a limited group of actively managed funds that has justified its fees over time through high quality asset allocation, the only reason to pay fees above the ETF benchmark.
Each quarter we rank the 11 sectors in our Sector Ratings for ETF & Mutual Funds and the 12 investment styles in our Style Ratings For ETFs & Mutual Funds report. This analysis allows us to find funds such as MassMutual Select Diversified Value Fund.
This article originally published on February 7, 2018.
Disclosure: David Trainer and Kyle Guske II receive no compensation to write about any specific stock, sector, style, or theme.
Article by Kyle Guske II, New Constructs

