
I like to look for things (beliefs and narratives) that the market believes but that just aren’t so…
These false narratives drive price action, spurring greater narrative adoption, which then drives prices further away from the underlying fundamentals (aka, reality).
Q1 hedge fund letters, conference, scoops etc, Also read Lear Capital: Financial Products You Should Avoid?
A trend not based on supporting fundamentals is not sustainable. It’s a mispricing; which is another word for opportunity.
But how do we discern true narratives based on supportive fundamentals from false ones based on faulty beliefs and misconceptions?
It’s not easy. We’re always working with incomplete information, so we have to to operate from a position of humility. And use all the tools at our disposal.
For the macro trader, these tools come in the form of models (both qualitative and quantitative). Think Munger’s idea of having a latticework of mental models from which to operate from.
Since the market is a dynamic non-linear beast — meaning, it’s complex and unpredictable — we need to have a wide range of models that we can try on for size and see if it fits the current regime; using price as the final arbiter of truth.
Adhering to Occam’s Razor, we then use these models to form assumptions, or hypotheses about the market, from which to act upon and place trades; applying bayesian analysis to continuously update our opinions as new information comes in.
Notice how this is a fluid and continuous process. We never latch onto to a single model or hypothesis about the market. Instead, we constantly try on new ideas/models and test them against the environment (price action) and discard them when they lose their efficacy.
This keeps us from wedding ourselves to a belief (being a perma bear or bull for whatever reasons) which is how powerful distorting biases are created. And these biases, are what eventually lead to one getting steamrolled. There are endless examples on fintwit of people stuck in this mode of operating.
Now that I’ve explained the process, let’s apply this framework to understanding today’s market. Here’s a short summary of some of the mental models I’ve found helpful in the current regime:
- Core/Periphery: The US is the core and emerging economies are the periphery with other developed markets sitting in the middle. Long-term capital flows tend to cycle back and forth between concentration in the core, to strong flows to the periphery. The primary fundamentals of this model are relative growth numbers between the regions and the market’s overall perception of risk.
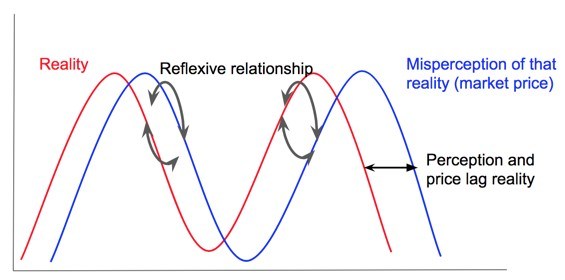
- Perception Lags Reality: Market participants mostly form their opinions about the future by taking current trends and extrapolating ad infinitum. It’s a natural herding response which leads to consensus thinking and positioning. And because markets are reflexive (our thinking affects prices which affects our thinking) it’s inevitable that this process leads to large mispricings.
- Event Echos: Powerful psychological events (think crypto boom/bust or the GFC) echo through time and affect the thinking and actions of the market for years and years. The 08’ financial crisis created a collective disaster myopia that is still prevalent today, 10-years on. This is not only noticeable in the psychology of market participants but also in the the policy makers who pull the levers on the economy (ie, central bankers). Everybody always fights the last war…
- Capital Cycle: Capital investment flows in and out of sectors and economies like the tide. It’s attracted by high returns, which leads to large inflows of investment, which then leads to greater capacity, and since greater capacity means greater supply, it eventually leads to falling prices and lower returns. The boom leads to bust. And then the cycle starts anew.
- FX Momentum Chasing: The currency market is dominated by speculative flows. These speculative flows go to where investors think they’ll receive the highest total return (currency + capital appreciation). This means FX is largely a momentum chaser and the process is filled with self-fulfilling feedback loops. Because of this, the relative equity momentum between countries is one of the most important inputs to look at when analyzing currencies.
- ROC inflation/yields: Stocks and bonds compete for capital. The risk premiums and expected returns for both, are what drive positioning decisions between the two. All else being equal, rising bond yields are bearish for stocks. And it’s the rate of change in yields (the speed at which they rise and fall), not so much the absolute levels, which greatly affect short-term action in the stock market. And since inflation is a key input into bond prices, the rate of change of inflation is also very important to understanding the bond/stock relationship.
- Playing the Player: The market is the aggregate of the beliefs and moods of those that play in it. Because of reflexivity and the herding tendencies of people, the market is constantly crowding from one side of the boat to the other. Leading to mispricings. This is why we need to track sentiment, dominant narratives, and positioning to see when the market becomes too one-sided.
Now let’s apply these models and use them to form some assumptions about the market.
Starting with core/periphery. There’s many ways to gauge where capital is going and where it will flow to. We can look at relative growth versus expectations or track the underling flows directly. But a simple way is to just see what relative prices are doing, since these flows show up directly in asset prices.
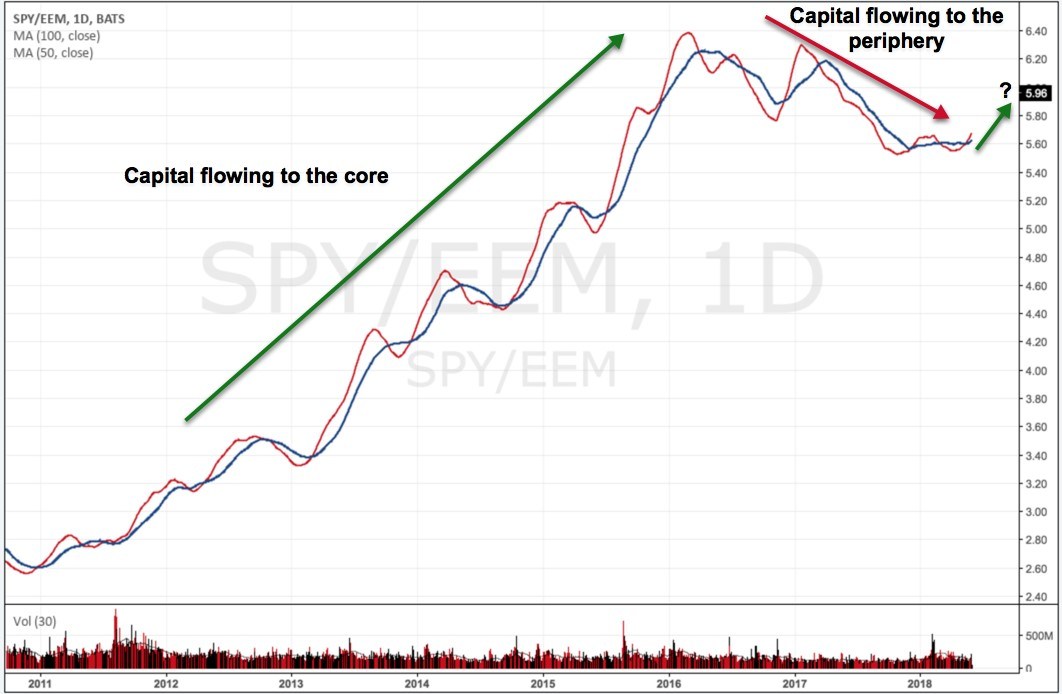
Here’s a chart of SPY (core) versus EEM (periphery). I’ve cleared the price so we just see the 50 and 100-day moving averages which allows us to see the clear trend in capital flows between the two.
We can see that the core has dominated this cycle up until mid-2016, when the periphery began to outperform the core and thus attracted more flows.
But recently, the 50 and 100-day moving averages have begun to turn back up. Suggesting that capital is beginning to flow back into the core.
We can see similar action in the trade weighted dollar (DXY) which is a reflection of our core/periphery and FX momentum chasing models. The 50 and 100-day moving averages have turned up as well.
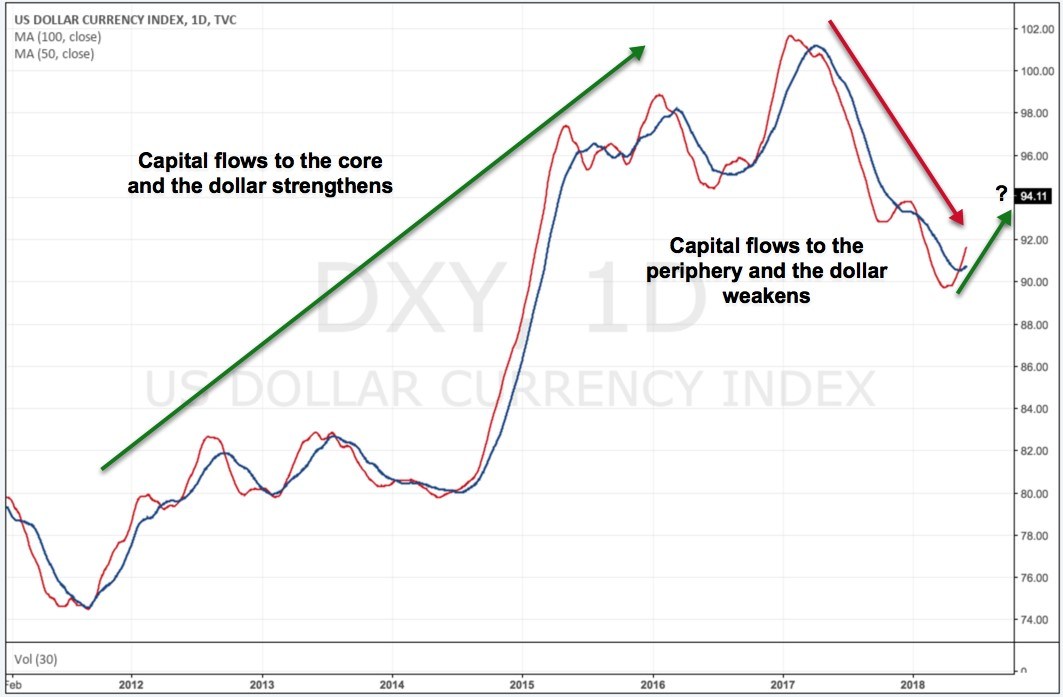
I’m working on the assumption that this recent upturn in a stronger dollar and flows back to the core will be sustained. This is because of a number of things, including a slowing China which should feed through to softening EM and a general repricing of global risk. Both dollar and core bullish.
The market, viewed through the lens of our perception lags reality model, is still operating off assumptions formed in 2017, when the world saw global synchronized growth and near zero volatility.
This perception is no longer true and much of the market is offsides. This mispositioning is what led to the large move in the dollar and core outperformance. The more this trend continues the more people working off the old assumption will be forced to reverse positioning, thus exacerbate the trend their positioned against.
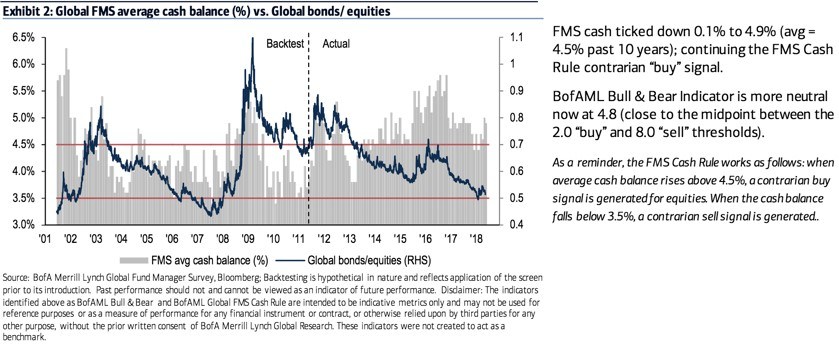
Despite the benign assumptions adopted by much of the market last year there persists an underlying bearishness and knee-jerk fear response to every selloff. A clear event echo leftover from the GFC. This is why cash balances still remain extremely high (chart below via BofAML’s latest fund manager survey).
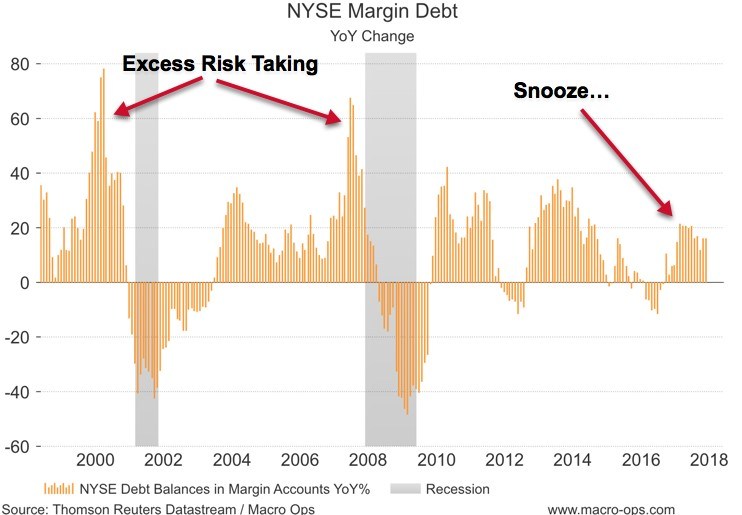
We can also see this risk averseness in the year-over-year change of NYSE margin debt. Pundits keep opining about how “late cycle” we are, but we’ve yet to see the euphoria driven leveraging — the investors getting out over their skis — that typifies the end of bull markets.
I don’t doubt this is coming but we just haven’t seen it yet, which is why this bull market is likely to continue longer than everybody thinks.
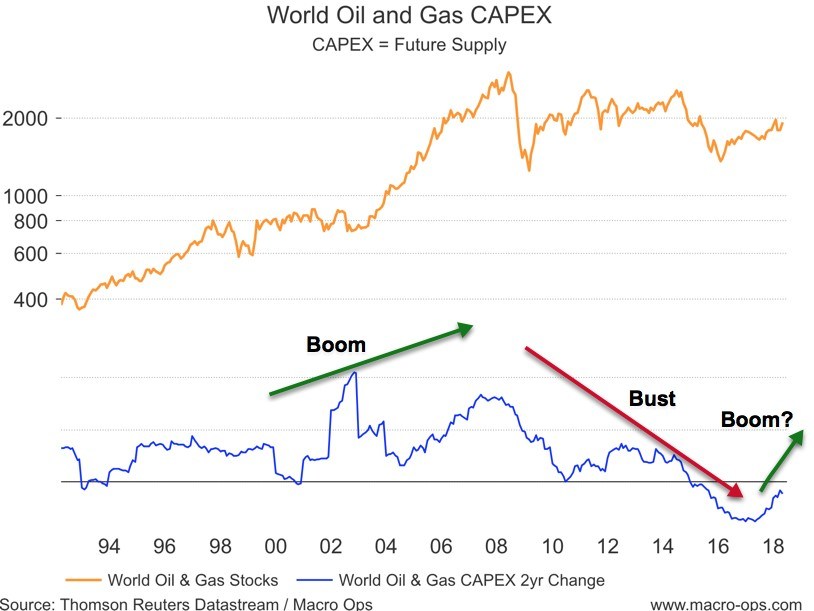
Using our capital cycle framework we’ve been bullish on oil and oil stocks since last summer, which we reported on in our monthly Macro Intelligence Report (MIR) titled “The Capital Cycle”.
We can see here that capex in the energy space (ie, investment into future production) fell off a cliff in 14’. This is the most intense decline in energy capex over the period for which we have data.
Low capex = low future supply = higher future prices, which we’re seeing now. This is also why we’ve held the unusual position of being bullish both the dollar and oil over the last few months, since both have a strong tendency to move inversely to one another.
Using our ROC inflation/yields model we can see how the quick increase in inflation at the start of the year drove yields higher which pinched stock valuations and caused a selloff.
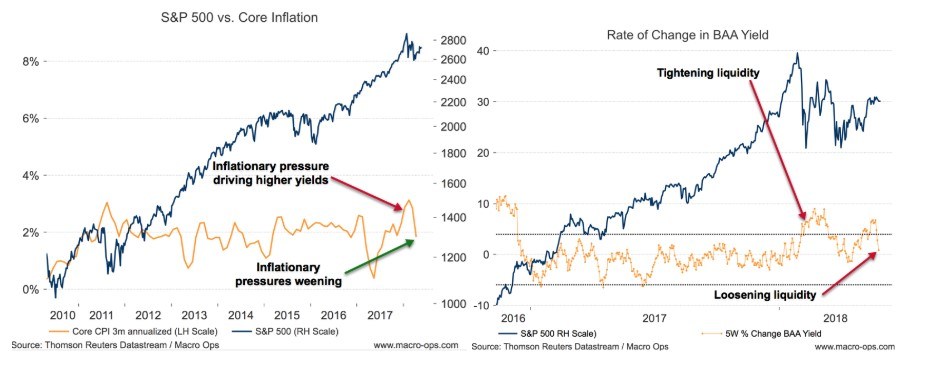
Both have since come down and are now at neutral/tailwind levels for the stock market.
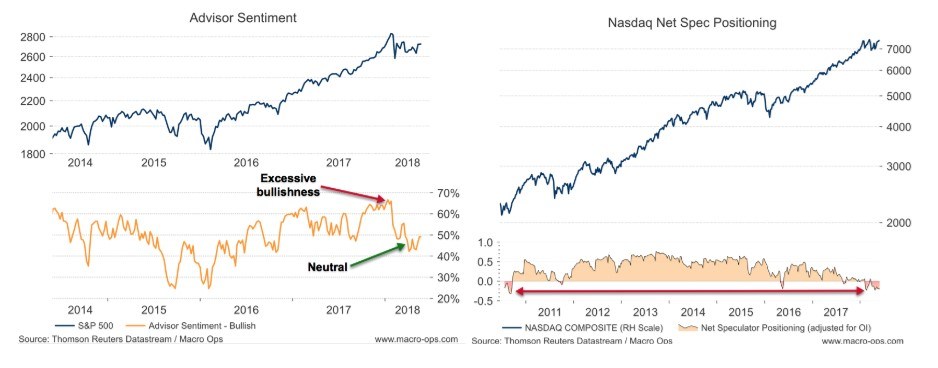
Using our Play the Player model we can look at shorter-term indicators to see that general market sentiment has reset from its January bullish levels. In addition, we can see that speculators hold the largest net short position against the Nasdaq since 2010 — which happened to mark the beginning of a large bullish run in tech.
This completes our quick run through of some of our models and now we have our working assumptions (hypotheses). These are:
- Global risk is starting to be repriced higher from very low levels. This is leading to capital flowing back to the core from the periphery.
- Capital flowing back to the core is leading to a stronger dollar and greater outperformance by the core vs. periphery which is about to kickstart a feedback loop of: flows to the core = strong dollar = tighter global liquidity = higher volatility = greater US vs ROW outperformance = greater flows to the core and a stronger dollar…
- Longer term sentiment is still overly bearish due to the event echo of the GFC. Because of this, we have yet to see the euphoric/leveraging phase of the cycle and therefore this bullish trend is likely to last longer than the market expects.
- The rate of change in inflation and yields has reversed from their pop higher at the beginning of the year. They are now at levels that are neutral to bullish for stocks.
- Short-term sentiment has reset from its overly bullish levels hit at the beginning of the year and is now at neutral to positive levels for stocks. And the market is overly bearish US tech stocks.
I’ll continue to operate from these working assumptions until new information comes in that makes me change my mind. And when it does, I’ll do so willingly.
We can take this framework and apply it at a micro level to identify particular sectors/companies that are drastically mispriced due to faulty beliefs and misconceptions. I’ll be doing exactly that in the June issue of our Macro Intelligence Report (MIR).
Click Here To Learn More About The MIR!
There’s no risk to check it out. We have a 60-day money-back guarantee. If you don’t like what you see, and aren’t able to find good trades from it, then just shoot us an email and we’ll return your money right away.
Our dollar and big tech plays from last issue crushed it and I expect this month’s ideas to do the same. Make sure to pick up a copy so you have access to our best summer trading ideas. The market is ready to make another leg higher and you don’t want to be left behind…
Click Here To Learn More About The MIR!
Article by Macro Ops

