
Investors that buy funds solely on the basis of a 4 or 5-star rating from Morningstar (MORN) are setting themselves up for disappointment. Despite repeated warnings that past performance does not predict future results, investors continue to rely too much on star ratings.
Q1 hedge fund letters, conference, scoops etc, Also read Lear Capital: Financial Products You Should Avoid?
Instead, investors should pay more attention to forward-looking measures that shed light on whether a fund’s past performance is sustainable. In short, deep analysis of a fund’s holdings should be part of every investor’s research and due diligence process. We help investors with this gargantuan task by providing investment ratings for 7900+ ETFs and mutual funds based on holdings’ quality.
This approach to fund research led us to a fund that backs up its past outperformance by allocating to better stocks than its benchmark while charging below-average fees. This fund, Provident Trust Strategy Fund (PROVX) is this week’s Long Idea.
Holdings Quality Analysis Reveals Quality Asset Allocation
A fund is most likely to outperform if it has higher quality holdings than its benchmark. To make this determination on holdings quality, we leverage our Robo-Analyst technology[1] to drill down and analyze the individual stocks in every fund we cover.
Figure 1: Provident Trust Strategy Fund (PROVX) Asset Allocation
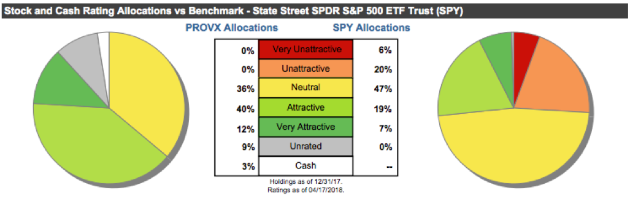
Sources: New Constructs, LLC and company filings
Per Figure 1, Provident Trust Strategy Fund allocates to more high-quality stocks and minimizes downside risk compared to its benchmark, State Street SPDR S&P 500 ETF (SPY). PROVX allocates 52% of its portfolio to stocks with an Attractive-or-better rating compared to just 26% for SPY. PROVX also allocates none of its portfolio to stocks with an Unattractive-or-worse rating compared to 26% for SPY.
Seven of the fund’s top 10 holdings earn an Attractive-or-better rating and comprise over 45% of assets. The top 10 holdings include some of our previously featured Long Ideas such as Alphabet (GOOGL) and Southwest Airlines (LUV) as well as stocks in our Model Portfolios such as The Home Depot (HD).
Given this favorable allocation relative to the benchmark, Provident Trust Strategy Fund appears well positioned to capture upside potential. Compared to the average mutual fund, PROVX has a much better chance of generating the outperformance required to justify its fees.
PROVX Finds Value in Large Cap Stocks
Despite the proliferation of passive strategies in the market, true value investing still works. PROVX’s managers do a good job allocating capital to higher-quality companies with lower-risk valuations.
Figure 2 contains our detailed rating for PROVX, which includes each of the criteria we use to rate all funds under coverage. These criteria are the same for our Stock Rating Methodology, because the performance of a fund’s holdings equals the performance of a fund after fees.
Figure 2: Provident Trust Strategy Fund Rating Breakdown
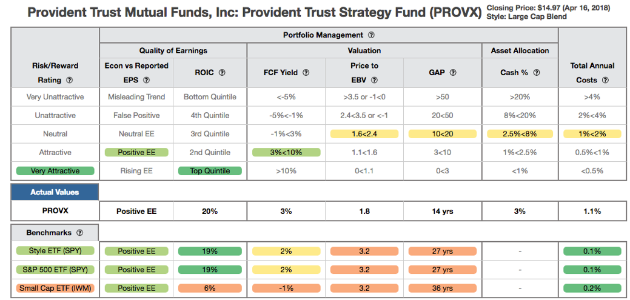
Sources: New Constructs, LLC and company filings
As Figure 2 shows, PROVX’s holdings are superior to SPY in four out of the five criteria that make up our holdings analysis:
- The return on invested capital (ROIC)[2] for PROVX’s holdings is 20%, just above the 19% ROIC earned by companies held by SPY.
- The 3% free cash flow (FCF) yield of PROVX’s holdings is greater than the 2% earned by SPY stocks.
- The price to economic book value (PEBV) ratio for PROVX is 1.8, while the PEBV ratio for SPY is 3.2.
- Our discounted cash flow analysis reveals an average market implied growth appreciation period (GAP) of 14 years for PROVX holdings compared to 27 years for SPY.
The stocks held by PROVX generate superior cash flows compared to SPY, yet the market projects SPY stocks to grow profits by a larger amount and for a longer period of time.
As noted earlier, Alphabet (GOOGL: $1080/share) is one of PROVX’s top holdings. Its two share classes (GOOGL & GOOG) make up nearly 13% of the portfolio. GOOGL is also in our Focus List – Long Model Portfolio. The company has consistently earned a top-quintile ROIC (never below 25%), and the last time it grew revenue by less than 10% annually was in the middle of the 2009 recession.
Despite its fundamental strength and strong competitive advantage, investors’ concerns about rising traffic acquisition costs have left GOOGL undervalued relative to peers. At its current price of $1,080, GOOGL has a price-to-economic book value of 1.7, which implies the market believes the company’s after-tax profit (NOPAT) will never be more than 70% above its current level. For comparison, GOOGL grew NOPAT by 75% in just the past three years. Long-term, the company has grown NOPAT by 36% compounded annually since 2004.
If GOOGL’s NOPAT margin expands to 23% (based on Cowen’s estimate of tax reform impact) and it grows NOPAT by 12% compounded annually over the next decade, the stock is worth $1,346/share today – a 25% upside. See the math behind this dynamic DCF scenario. Allocating to firms that generate significant cash flows at undervalued prices, such as GOOGL, provide the opportunity for PROVX to outperform going forward.
PROVX Earns Its Fees Over Time
With total annual costs (TAC) of 1.14%, PROVX has lower expenses than 69% of all funds under coverage. PROVX’s TAC is also lower than the funds in the Large Cap Blend style, which have 1.61% average TAC. Below average fees combined with quality holdings make PROVX one of the most attractive funds in the Large Cap Blend style.
To justify its active management fees, PROVX must outperform its benchmark by 1.03% annually over three years. Per Figure 3, PROVX has increased (measured by growth of $10K) 14.7% compounded annually over the past three years compared to 11.3% for the SPY. This outperformance more than triples what is required to justify PROVX’s fees.
Figure 3: PROVX vs. SPY: Growth of 10K Over Last Three Years
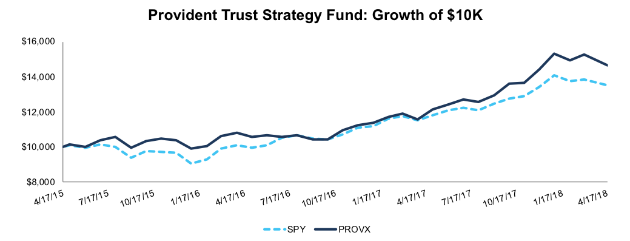
Sources: New Constructs, LLC and company filings.
While past performance is no guarantee of future results, PROVX’s intelligent portfolio management has clearly led to outperformance over the long term. PROVX has outperformed SPY over the last, one, three, five, and 10-year periods compounded annually. This long-term track record of outperformance, combined with the fund’s high-quality holdings, should reassure investors.
The Importance of Holdings Based Fund Analysis
While it is easy to pick a 5-Star rated fund from Morningstar, research shows such a strategy has risks and does not necessarily lead to outperformance. Smart fund investing means analyzing the holdings of each fund.
Our Robo-Analyst technology analyzes the holdings of all 950 ETFs and mutual funds in the Large Cap Blend style. The number of holdings in these ETFs and mutual funds varies from just eight stocks to 1,648 stocks in a given fund. Our diligence on fund holdings led us to a mutual fund, PROVX, with a portfolio that suggests future performance will be strong.
Each quarter we rank all 11 sectors in our Sector Ratings for ETF & Mutual Funds and all 12 investment styles in our Style Ratings For ETFs & Mutual Funds report.
This article originally published on April 18, 2018.
Disclosure: David Trainer and Kyle Guske II receive no compensation to write about any specific stock, sector, style, or theme.
Follow us on Twitter, Facebook, LinkedIn, and StockTwits for real-time alerts on all our research.
[1] Harvard Business School features the powerful impact of our research automation technology in the case New Constructs: Disrupting Fundamental Analysis with Robo-Analysts.
[2] Ernst & Young’s recent white paper “Getting ROIC Right” proves the superiority of our holdings research and analytics.
Article by Kyle Guske II, New Constructs

