
The latest round of OECD Composite Leading Indicators was just released, and given how useful these indicators can be in shedding light on the state of the economic cycle (and market cycle) it’s worth taking a look at the trends within the data. Indeed, the January round showed a further down tick in the diffusion index across the 36 countries that OECD calculates these indicators for. In the past this sort of pattern has been a signal of a turning point.
While I have been optimistic on the global economic outlook (on the basis of still supportive monetary policy, rising property prices in the major economies, solid manufacturing and consumer confidence, improving corporate earnings, and accelerating global trade growth), it is worth keeping track of indicators like this for an unbiased guide on potential turning points in the cycle. As I note below, it could well be a more benign type of signal e.g. a mid-expansion slowdown such as that which occurred in 2005, but with equity market valuations increasingly expensive, and the tides turning in global monetary policy, it’s not something to completely dismiss either.
The key takeaways for investors are:
-The diffusion index of the OECD CLIs for 36 countries has turned down, repeating a signal often seen at turning points in economic/market cycles.
-There is the possibility that it is just a mid-expansion-slowdown or a false signal.
-However with high valuations and turning tides in monetary policy it’s worth noting.
-There are early signs of a potential divergence in prospects between emerging and developed economies.
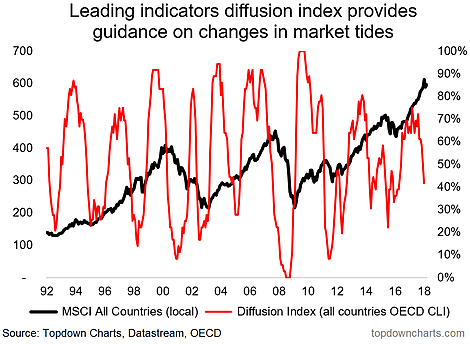
1. OECD CLIs vs Global Equities: The diffusion index, which measures the breadth of monthly changes in the OECD CLI across 36 countries has decidedly turned down in January (after falling also in December and November). While this indicator does give the occasional false signal or early signal vs global equities, it has a decent record in identifying turning points in the momentum of the economic expansion/contraction. So it is a worrying sign for global equities that this indicator has turned down so aggressively.

2. Global Leading Indicator: Overlaying the diffusion index against the OECD + 6NME composite (the 6 non-member economies are Brazil, China, India, Indonesia, Russia, South Africa), you can see how it can provide an early lead on changes in direction of the economic cycle. At best it seems to be signalling a mid-expansion slowdown e.g. as happened in 2005, and at worst it could be signalling an economic downturn.
3. EM vs DM Composite Leading Indicators: Looking at the composite for Emerging Markets vs Developed economies, it seems emerging markets led DM into the 2015/16 slowdown, and DM has been faster to return to expansion and looks to have topped out for now. Meanwhile the EM composite is continuing to rise – given EM economies now account for the dominant share of world GDP it’s all the more important to pay attention to this eclectic group. Indeed, one might ask whether EM can carry the weight of leading the global economic upturn on its own shoulders, and we may well find out sooner rather than later…
Like what you see? Why not take a free trial of our premium offering for an extra level of service and insight.

