
“Optimism is highly valued, socially and in the market; people and firms reward the providers of dangerously misleading information more than they reward truth tellers. One of the lessons of the financial crisis that led to the Great Recession is that there are periods in which competition, among experts and among organizations, creates powerful forces that favor a collective blindness to risk and uncertainty.” – Daniel Kahneman, Professor of Psychology and Public Affairs Emeritus at the Woodrow Wilson School, Princeton University, the Eugene Higgins Professor of Psychology Emeritus at Princeton University, and a fellow of the Center for Rationality at the Hebrew University in Jerusalem
Q4 hedge fund letters, conference, scoops etc

At the beginning of each new month, I find it helpful to take a look at the most current valuation metrics and what they tell us about coming returns. If you’ve been reading OMR for some time, you are aware of the drill. The idea is that valuation, the price you are paying for the goods you are buying, matter. When low, you buy more return for your money. When high, you get less.
The game plan today was to share the most current data with you. However, I need a little more time on two fronts: First, I awoke to find that some of the month-end data has yet to post (you’ll see the following chart is dated through January 21 vs. February month-end). Second, I’m attending a conference in Park City, Utah and it’s been snowing all night. If you are a skier and have experienced the joy of flying down untracked, fresh, deep powder snow, you probably know the skier’s golden rule, “No friends on a powder day.” The reason is that it takes time to learn how to ski deep powder as it is a bit of a different dance and even experienced skiers fall. The problem is the time it takes to find buried skis and then once found, find footing on a steep slope and click boots back into bindings. It just takes forever. Thus, no friends. Since powder ski days are hard to come by, the rule is the rule. Though admittedly it is not the golden rule mom taught us… so let’s not tell mom.
Next week we’ll go deeper but, until then, following is a simple reminder that valuations do matter especially in terms of what it means to your equity portfolio returns over the coming months and years. My friends at Ned Davis Research are deep-dive data geeks. It’s why I love their work so much.
Here is how to read the following chart:
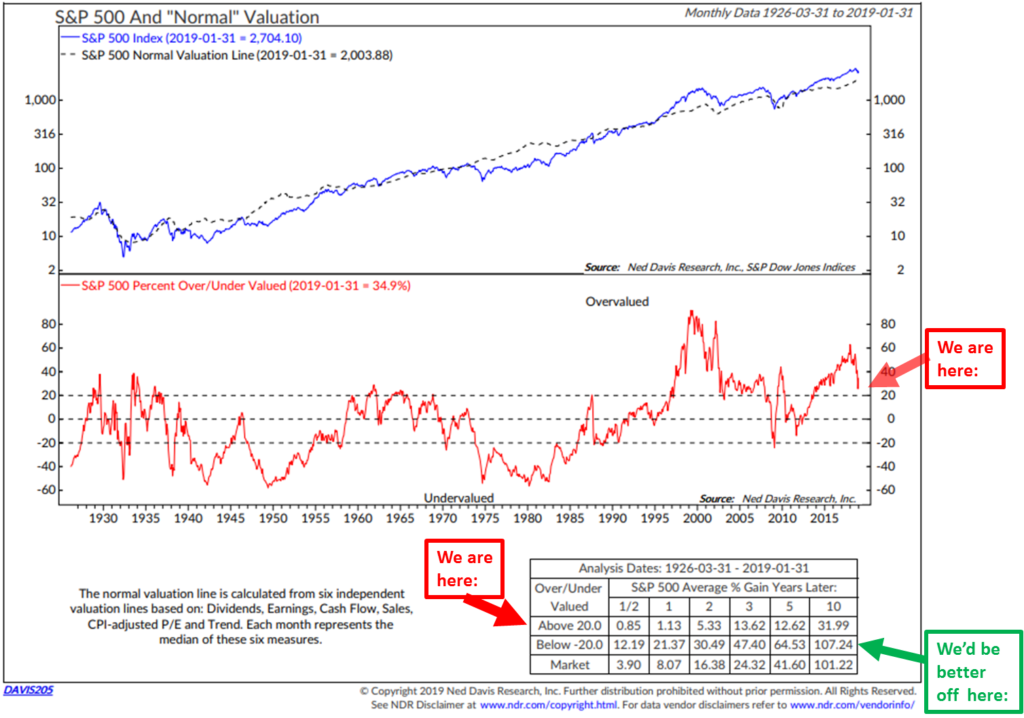
- NDR calculates normal valuation by looking at six independent valuations metrics: Dividends, Earnings, Cash Flow, Sales, CPI-adjusted P/E and Trend. Data is from 1926 through January 2019.
- Focus on the middle section (red line). “Overvalued” is the zone above 20 and “Undervalued” is the zone below -20. The red “We are here” arrow points to the level at the end of January 2019. The number stood at 34.9… Above 20 and in the “overvalued” zone.
- Next, look at the box in the lower right-hand section of the chart. It shows the percentage gain in the years later when in the Above 20.0 Overvalued Zone when in the Below -20.0 Undervalued Zone.
- S&P 500 Index returns on actual performance date back to 1926 when “Normal” valuation is above 20:
- 1 year later the S&P 500 percent gain averaged just 1.13%
- 2 years later the S&P 500 percent gain is 5.33% (call it 2.5% per year compounded)
- 5 years later the S&P 500 percent gain is 12.62% (once again approximately 2.5% per year compounded).
- 10 years later the S&P 500 percent gain is 31.99% (call it less than 3% per year for 10 years)
Now compare the coming return opportunity vs. when “Normal” valuation is below -20.0. (Focus in on the green, “We’d be better off here” arrow).
- S&P 500 Index returns on actual performance date back to 1926 when “Normal” valuation is below 20.0:
- 1 year later the S&P 500 percent gain averaged 21.37%
- 2 years later the S&P 500 percent gain is 30.49% (nearly 15% per year compounded)
- 5 years later the S&P 500 percent gain is 64.53% (over 11% per year compounded).
- 10 years later the S&P 500 percent gain is 107.24% (approximately 10% per year)
We remain in the “Overvalued” zone. We’ll take a deeper dive next week.
A quick note to keep in the back of your mind, valuations tell us a great deal about coming returns and from this perspective are very useful, but do note that they tell us very little about the timing of bull and bear market cycles. I like to think about playing more defense than offense when valuations are high (forward returns low) and playing more offense than defense when the getting gets good again.
I can’t help but wonder if the Federal Reserve and other central bankers are again enabling what Prof. Daniel Kahneman said, “… a collective blindness to risk and uncertainty.”
No coffee needed this week unless you are clicking through to the Trade Signals charts. The trend is improved though, as I shared in On My Radar: 19 for 19, A Probable Retest of the December Low a few weeks ago, and my best two cents is to remain patient. Perhaps we are back to a “buy the dip” environment, given the Fed’s recent U-turn, but as you see in the “Normal” valuation data above and in the charts I’ll share with you next week, forward returns over the coming years remain challenged. Our current starting conditions matter and I believe the next recession will create the next great investment opportunity. For now, Fed support is back in form until the next recession trumps their hand. We’ll take a look at the latest recession watch charts next week as well.
♦ If you are not signed up to receive my weekly On My Radar e-newsletter, you can subscribe here. ♦
Follow me on Twitter @SBlumenthalCMG
Included in this week’s On My Radar:
- Trade Signals – Don’t Fight the Tape and Fed in Bullish Signal, Sentiment Remains Too Optimistic (S/T Bearish for Stocks)
- Personal Note
Trade Signals – Don’t Fight the Tape and Fed in Bullish Signal, Sentiment Remains Too Optimistic (S/T Bearish for Stocks)
February 27, 2019
S&P 500 Index — 2,794
Notable this week:
No major changes this week. The rally has now stalled at 2,800. We suspect a pull-back from the strong post-Christmas recovery. Further, with the Fed currently taking an accommodative posture, we believe there is likely a better entry level below current levels (perhaps 2,700). Such a correction would work off the extreme optimism and provide a better risk-on entry point.
Most of the equity market trend signals are near new buy signals. Don’t Fight the Tape or the Fed is in a bullish +2 reading. Investor sentiment remains excessively optimistic, which suggests a market pull-back.
The Ned Davis Research CMG U.S. Large Cap Long/Flat model remains in a sell signal suggesting 40% exposure to the market. There is modest improvement. It is an intermediate-term trend indicator designed to position in sync with the major market trend, not the short-term moves.
Bottom line: There is some improvement in the model. It is built to give the upside the benefit of the doubt. When the model equity line score (currently 58.86) becomes higher than its score 42 days ago, a confirmed uptrend signal will be generated and the model will signal 100% exposure to U.S. large-cap equities.
The Ned Davis Research sentiment indicators — the Daily Trading Sentiment Composite and Crowd Sentiment Poll — are both showing extreme optimism, which is short-term bearish for equity markets.
Risk of global recession remains high, while there’s currently low but growing U.S. recession risk. We’ll continue to remain data dependent (recession watch charts below). The recession data updates monthly.
Click here for this week’s Trade Signals.
Important note: Not a recommendation for you to buy or sell any security. For information purposes only. Please talk with your advisor about needs, goals, time horizon and risk tolerances.
Personal Note
The week in Utah has been productive. A large gathering of some of the leaders in the exchange-traded fund (ETF) investment space. Market makers, money managers, ETF strategists, product creators, pension consultants, foundation CIOs and regulatory experts. My panel presented on “Yield Strategies for Rising Rates,” though our models are currently bullish on bonds, forecasting lower rates ahead. I told the crowd an epic opportunity is coming to the high yield space. I’ve seen three in my nearly 30 years trading HY. I believe the next will be better than any of those prior great set-ups (including the set-up the Great Financial Crisis created). It will present in recession. Stay positive and see that as great news.
Rushing to hit the send button as the powder snow is calling my name. No friends today? I am so looking forward to enjoying that post-ski day cold beer with them today.
Powder snow update: Looks like the snow count is under five inches… not quite the powder day, so it’s good news for advancing friendships…
Wishing you a fun-filled weekend… Thank you for reading On My Radar. Please know how much I appreciate you and the time you spend with me each week.
Best regards,
Stephen B. Blumenthal
Executive Chairman & CIO

