
Pershing Square Holdings letter to investors for the first quarter ended March 31, 2019.
Q1 hedge fund letters, conference, scoops etc
Dear Shareholder,
Pershing Square Holdings generated strong performance during the first quarter of 2019 and year-to-date. NAV per share increased 36.9% during the first quarter and by 38.4%1 year-to-date, compared with the S&P 500’s year-to-date total return of 13.9%. All of our portfolio companies have generated substantial positive performance in line with their continued business progress as we discuss in detail below:
Portfolio Update
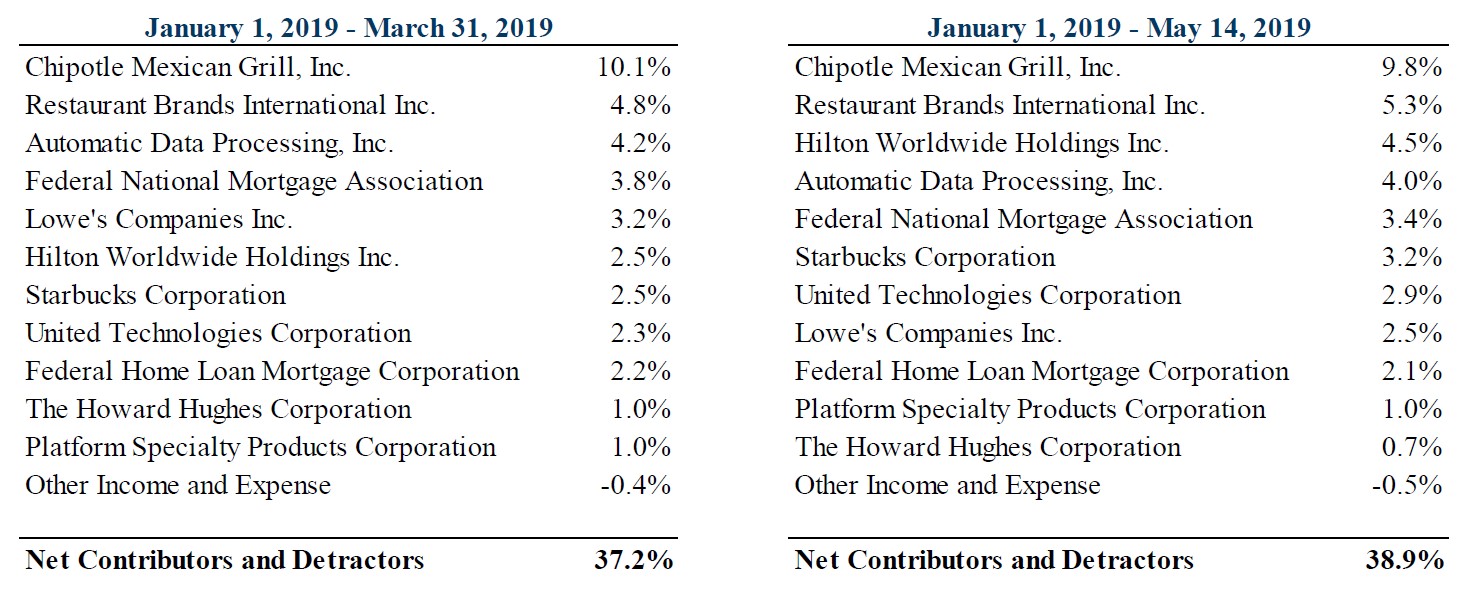
Below are the contributors and detractors to gross performance of the portfolio for the first quarter of 2019 and year-to-date 20192:
Chipotle Mexican Grill (“CMG”)
CMG’s first quarter results continued to demonstrate the significant progress that CEO Brian Niccol and his team have made in dramatically improving performance and positioning the company for long-term sustainable growth. Same-store sales grew 10% in the quarter led by transaction growth of approximately 6%, a significant acceleration in sequential growth – better than that of any other large publicly traded restaurant company.
Management raised its full year same-store sales guidance to mid-to-high single-digit growth from mid-single-digit growth. Digital sales doubled from the prior year quarter to nearly 16% of sales, including robust growth in delivery, which has driven incremental sales and improved margins. Key drivers for continued same-store sales progress in the coming quarters include the new loyalty program launched in March, the completion of the rollout of the digitized second make line by the end of 2019 from half to all stores, and a continued focus on improving speed of service and store employee retention.
Restaurant margins expanded 150 basis points in the quarter to 21%, the highest since 2015. Management estimates that every $100,000 increase in average restaurant sales should translate into a one percentage point increase in restaurant margins, implying margins of 25% once Chipotle gets back to peak average restaurant sales of $2.5 million, which were previously achieved with essentially no contribution from digital or delivery.
Chipotle’s store count exceeded 2,500 stores in the quarter, with management reiterating the opportunity for up to 5,000 stores on the earnings call, and Brian citing the potential for up to 7,000 stores in a recent interview. Despite the 63% year-to-date increase in the share price, we believe that Chipotle is in the early innings of its transformation, and that its robust pipeline of initiatives in the stage gate process, accelerated footprint expansion, and a world-class management team should drive superlative growth in sales and profits for years to come.
Automatic Data Processing, Inc. (“ADP”)
ADP’s fiscal third quarter earnings results continue to highlight the significant opportunity for accelerated revenue growth and improved prospective profitability. ADP reported 4% revenue growth (5% organic constant-currency), 10% growth in adjusted operating profit (aided by 130 basis points of margin expansion), and 13% growth in adjusted EPS. While revenue growth was somewhat softer than recent prior quarters, ADP’s bookings growth – a leading indicator of future revenue growth – jumped to 10%, a significant acceleration from previous periods.
ADP continued to execute on its ongoing business transformation in the quarter by generating better-than-expected Employer Services operational margins which increased 170 basis points during the quarter. These improved margins are particularly notable despite the quarter’s bookings growth acceleration, which would typically cause margins to decline principally due to the upfront selling costs associated with new bookings. In response to better-than-expected margin expansion, ADP once again increased its fiscal year 2019 earnings-per-share guidance by 19% to 20% over the previous year.
ADP shares have appreciated 21% year-to-date. We continue to believe that ADP has a significant opportunity to accelerate top-line revenue growth and expand margins, which should allow ADP to compound earnings at a mid-to-high-teens growth rate for many years to come.
Restaurant Brands International (“QSR”)
QSR’s most recent earnings results continue to reinforce our thesis that the company’s royalty-based, franchise model is a uniquely valuable business with a large, long-term, capital-light, unit-growth opportunity. This quarter, QSR’s unit count expanded by more than 5% while organic EBITDA grew 6% (excluding a 1% headwind from the timing of franchisee ad fund expenditures that temporarily exceeded contributions). Each of QSR’s three brands generated positive organic EBITDA growth with Burger King’s EBITDA up 10%.
Same-store sales grew more than 2% at Burger King and 1% at Popeyes despite difficult comparisons with the prior year. Tim Hortons’ same-store sales were slightly negative this quarter, lower than we expected and below the nearly 2% level last quarter due primarily to adverse weather according to management. While weather is never a favored explanation, management noted that same-store sales have returned to growth since the end of the quarter and were up nearly 2% in April. We believe that Tim Hortons’ same-store sales growth will benefit from the company’s recently implemented loyalty program which was launched a little over a month ago. Nearly 20% of Canadians have already signed up for the program, with roughly 50% of transactions now associated with a loyalty card.
While QSR’s shares have appreciated 28% this year, the shares currently trade at approximately 23 times our estimate of 2019 free cash flow per share, a discount to our view of intrinsic value and to slower growing franchised-peers such as Yum and McDonalds, which trade at 26 to 27 times analyst estimates of 2019 free cash flow.
On May 15th, QSR hosted its first investor day, at which management highlighted the sustainability of the company’s long-term growth, announced a long-term target of 40,000 units in eight to 10 years, and outlined various initiatives to drive same-store sales growth and franchisee profitability. The stock has responded favorably since the presentation as we believe investors were impressed by management and the greater business transparency provided into the company’s and franchisee underlying business economics.
Lowe’s Companies, Inc. (“LOW”)
Lowe’s continues to make progress toward closing the performance gap with its direct competitor, Home Depot. The company has undertaken a series of initiatives to improve customer service and product merchandising while reducing structural costs and investing in IT systems and product distribution facilities. We expect these recent actions to improve comparable sales and profitability beginning later this year and to a greater extent in future years.
Lowe’s share price has increased 16% year-to-date, yet currently trades at only 17 times analyst estimates of 2019 earnings, which do not reflect the significant potential for future profit improvement. We believe the shares have the potential to appreciate significantly as the positive financial impact of the company’s business transformation becomes more evident over the course of the year, and management continues to execute on closing the performance gap with Home Depot.
Starbucks (“SBUX”)
SBUX’s fiscal second quarter results lend further support to our belief in the company’s wide competitive moat and its long-term, high-single-digit revenue growth outlook. Starbucks’ store base grew 7% this quarter to more than 30,000 stores globally. We expect the company to continue to grow its unit count at a similar rate for the foreseeable future led by underpenetrated markets including China.
Same-store sales grew 3% globally, including 4% growth in the U.S. for the third consecutive quarter, and slightly positive transaction growth in the U.S. for the second quarter in a row. U.S. same-store sales should continue to improve due to the rollout of the Nitro cold beverage platform from just over half of company-operated stores to all by the end of September, new innovations such as the Cloud Macchiato, and continued efforts to engage less frequent customers, including a more accessible loyalty program.
China same-store sales growth of 3% was impressive in light of the intense competitive environment and the rapid expansion of the Starbucks store base, which should be supported in the near-term by the launch of mobile order and pay, and the continued rollout of delivery. Management issued more detailed guidance concerning its overhead cost reduction program, which when combined with higher-than-expected Americas’ segment margins in the quarter, reinforces our view that management’s long-term operating profit margin target will prove to be conservative.
SBUX shares have appreciated 21% year-to-date. The stock currently trades at 26 times forward earnings, in-line with recent historical averages, a level from which we believe prospective returns remain compelling, underpinned by mid-teens EPS growth and robust cash returns to shareholders over the next several years.
Hilton Worldwide Holdings Inc. (“HLT”)
Hilton’s most recent results reinforce our view that the company’s robust value proposition and asset-light, fee-based business model should allow the company to compound earnings per share at a mid-to-high teens growth rate for many years into the future. This quarter, Hilton grew units more than 7% contributing to 12% franchised and management revenue growth, 12% EBITDA growth and 19% earnings per share growth. Revenue per available room (“RevPAR”) grew 1.8% this quarter despite softness in the overall industry as Hilton realized strong market share gains across all brands and major regions.
During the company’s earnings call, management noted that it would expect free cash flow to grow even in the event Hilton were to experience a 5% to 6% RevPAR decline. Management’s comments are consistent with our view that the combination of Hilton’s fee-based business model and its large unit development pipeline should insulate the company from even a meaningful short-term decline in RevPAR. While Hilton’s shares have appreciated 28% this year, the shares currently trade at 24 times consensus analyst estimates for 2019 earnings, a discount to the historical average, and below our estimate of the company’s intrinsic value based upon its high-quality, predictable cash-flow stream and strong future growth potential.
United Technologies (“UTX”)
UTX’s first quarter earnings demonstrated strong growth across its businesses as organic revenue grew 8%. Results were particularly strong in the aerospace businesses with 11% organic revenue growth and 12% pro forma operating income growth (including Rockwell Collins’ results in both years). The Rockwell Collins acquisition is off to an excellent start with performance and integration ahead of management’s expectations. While organic revenue growth in the commercial businesses was reasonably strong at 5%, pre-tax operating profit was muted due to cost pressures at Carrier, which the company believes will improve meaningfully over the course of the year. EPS grew by 8%, which includes the negative impact of amortization expense related to the acquisition of Rockwell Collins. We estimate that EPS grew nearly 15% excluding this non-cash, non-economic expense.
The company remains on track to complete its previously announced three-way business separation by early 2020. UTX plans to announce the leadership teams and boards of directors for Otis and Carrier shortly, and to highlight the long-term opportunities in each of its businesses at investor events later this year.
UTX’s shares have appreciated 27% year-to-date, but trade at less than 16 times our estimate of this year’s pro-forma earnings, a nearly 30% sum-of-the-parts discount to its peers. We believe the upcoming business separation will serve as a catalyst for significant future share price appreciation as investors begin to value each of UTX’s businesses separately.
The Howard Hughes Corporation (“HHC”)
HHC’s first quarter results highlight positive progress at the company’s core master planned communities (MPCs) in Houston and Summerlin (Las Vegas), and its condo sales in its Hawaii towers.
Despite significant progress in HHC’s core business, project delays and initial losses at HHC’s Seaport District (New York City) continue to consume the majority of analyst and investor focus and may have contributed to the recent decline in the company’s stock price. Although there have been delays at the Seaport, management remains confident regarding the long-term value-creation potential of this unique asset. The Seaport represents less than 10% of the company’s total asset base valued at cost so we do not believe that the slower than expected stabilization of this asset is material to HHC.
HHC’s stock has increased 9% year-to-date. We continue to believe that HHC trades at a large discount to its underlying NAV per share.
Fannie Mae (“FNMA”, or “Fannie”) and Freddie Mac (“FMCC”, or “Freddie”)
On March 27th, President Trump issued a memorandum to the Secretary of the Treasury and the Secretary of Housing and Urban Development directing them to craft housing finance reform plans. The directive to Treasury listed “ending the conservatorships of the GSEs” as its first goal and instructed Treasury to specify for each reform included in the plan “whether the proposed reform is a ‘legislative’ reform that would require congressional action or an ‘administrative’ reform that could be implemented without congressional action. For each ‘administrative’ reform, the Treasury Housing Reform Plan shall include a timeline for implementation.” A response from Treasury is expected in the next two to three months. We believe the memorandum is notable as it: (1) is by far the most explicit directive on housing finance reform from President Trump to date, (2) pushes for a prompt resolution, and (3) is consistent with the housing finance goals that Treasury Secretary Mnuchin has repeatedly articulated since the 2016 election.
On April 4th, Mark Calabria was confirmed by the Senate as the new Director of the FHFA, Fannie and Freddie’s primary regulator. Dr. Calabria has since given a series of recent interviews in which he has shared his views on the potential reform path for Fannie and Freddie. Dr. Calabria has stated that he expects that “sometime in the fall, Treasury and I will hopefully come to an agreement. That will allow us, later in the year, to suspend the net worth sweep and start to build capital” and that an IPO could happen “perhaps [in the] first half of next year.”
FNMA and FMCC common shares have increased 143% and 135% respectively, year-to-date. FNMA and FMCC preferred shares have both increased 66% year-to-date.
Exited Position
During the first quarter, we exited our investment in Platform Specialty Products Corporation. Please contact the investor relations team at ir@persq.com if you have any questions. We greatly appreciate your support.
Additional Disclaimers and Notes to Performance Results
Presentation of Performance Results and Other Data
The performance results of Pershing Square Holdings, Ltd. (“PSH” or the “Company”) shown in this letter are presented on a net-of-fees basis. Net Performance includes the reinvestment of all dividends, interest, and capital gains from PSH’s underlying portfolio companies and reflects the deduction of, among other things, management fees, accrued performance fee (if any), brokerage commissions and administrative expenses. All performance provided herein assumes an investor has been in PSH since its inception date and participated in any “new issues”, as such term is defined under Rules 5130 and 5131 of FINRA. Performance is based on the dollar return for the specific period, including any and all dividends paid by the Company, calculated from the beginning of such period to the end of such period. Depending on the timing of a specific investment and participation in “new issues”, net performance for an individual investor may vary from the net performance stated herein. Performance data for 2019 is estimated and unaudited.
The market index mentioned on the first page of this letter has been selected for purposes of comparing the performance of an investment in PSH with a certain well-known, broad-based equity benchmark. The statistical data regarding the index has been obtained from Bloomberg and the returns are calculated assuming all dividends are reinvested. The index is not subject to any of the fees or expenses to which PSH is subject. PSH is not restricted to investing in those securities which comprise the index, its performance may or may not correlate to the index and it should not be considered a proxy for this index. The volatility of an index may materially differ from the volatility of PSH. The S&P 500 index is proprietary to and is calculated, distributed and marketed by S&P Opco, LLC (a subsidiary of S&P Dow Jones Indices LLC), its affiliates and/or its licensors and has been licensed for use. S&P® and S&P 500®, among other famous marks, are registered trademarks of Standard & Poor’s Financial Services LLC. © 2015 S&P Dow Jones Indices LLC, its affiliates and/or its licensors. All rights reserved.
The performance attributions presented herein are based on gross returns which do not reflect deduction of certain fees or expenses charged to the Company, including, without limitation, management fees and accrued incentive fee (if any). Inclusion of such fees and expenses would produce lower returns than presented here. In addition, at times, PSH may engage in hedging transactions to seek to reduce risk in the portfolio, including investment specific hedges that do not relate to the underlying securities of an issuer in which PSH is invested. Unless otherwise noted herein, the gross returns: (i) include only returns on the investment in the underlying issuer and the hedge positions that directly relate to the securities that reference the underlying issuer (e.g., if the Company was long Issuer A stock and also purchased puts on Issuer A stock, the gross return reflects the profit/loss on the stock and the profit/loss on the put); (ii) do not reflect the cost/benefit of hedges that do not relate to the securities that reference the underlying issuer (e.g., if the Company was long Issuer A stock and short Issuer B stock, the profit/loss on the Issuer B stock is not included in the gross returns attributable to the investment in Issuer A); and (iii) do not reflect the cost/benefit of portfolio hedges. Performance with respect to currency hedging related to a specific issuer is included in the overall performance attribution of such issuer. All other currency positions are aggregated. The performance attributions to the gross returns provided herein are for illustrative purposes only. The securities on this list may not have been held by PSH for the entire period. Share price performance data of PSH’s portfolio companies takes into account the issuer’s dividends, if any. Share price performance data is provided for illustrative purposes only and is not an indication of actual return of PSH over the periods presented or future return of PSH. Additionally, it should not be assumed that any of the changes in shares prices of the investments listed herein indicate that the investment recommendations or decisions that Pershing Square makes in the future will be profitable or will generate values equal to those of the companies discussed herein. All share price performance data calculated “to date” is calculated through May 14, 2019.
Past performance is not necessarily indicative of future results. All investments involve risk including the loss of principal. It should not be assumed that investments made in the future will be profitable.
General Notes
This letter does not constitute a recommendation, an offer to sell or a solicitation of an offer to purchase any security or investment product. This letter contains information and analysis relating to publicly disclosed positions above 50 basis points in the Company’s portfolio during the period reflected on the first page. Pershing Square may currently or in the future buy, sell, cover or otherwise change the form of its investment in the companies discussed in this letter for any reason. Pershing Square hereby disclaims any duty to provide any updates or changes to the information contained here including, without limitation, the manner or type of any Pershing Square investment.
Forward-Looking Statements
This letter also contains forward-looking statements, which reflect Pershing Square’s views. These forward-looking statements can be identified by reference to words such as “believe”, “expect”, “potential”, “continue”, “may”, “will”, “should”, “seek”, “approximately”, “predict”, “intend”, “plan”, “estimate”, “anticipate” or other comparable words. These forward-looking statements are subject to various risks, uncertainties and assumptions. Accordingly, there are or will be important factors that could cause actual outcomes or results to differ materially from those indicated in these statements. Should any assumptions underlying the forward-looking statements contained herein prove to be incorrect, the actual outcome or results may differ materially from outcomes or results projected in these statements. None of the Company, Pershing Square or any of their respective affiliates undertakes any obligation to update or review any forward-looking statement, whether as a result of new information, future developments or otherwise, except as required by applicable law or regulation.
Risk Factors
Investors in PSH may lose all, or substantially all, of their investment in PSH. Any person acquiring shares in PSH must be able to bear the risks involved. These include, among other things, the following:
- PSH is exposed to a concentration of investments, which could exacerbate volatility and investment risk;
- Activist investment strategies may not be successful and may result in significant costs and expenses;
- Pershing Square may fail to identify suitable investment opportunities. In addition, the due diligence performed by Pershing Square before investing may not reveal all relevant facts in connection with an investment;
- While Pershing Square may use litigation in pursuit of activist investment strategies, Pershing Square itself and PSH may be the subject of litigation or regulatory investigation;
- Pershing Square may participate substantially in the affairs of portfolio companies, which may result in PSH’s inability to purchase or sell the securities of such companies;
- PSH may invest in derivative instruments or maintain positions that carry particular risks. Short selling exposes PSH to the risk of theoretically unlimited losses;
- PSH’s non-U.S. currency investments may be affected by fluctuations in currency exchange rates;
- Adverse changes affecting the global financial markets and economy may have a material negative impact on the performance of PSH’s investments;
- Changes in laws or regulations, or a failure to comply with any laws and regulations, may adversely affect PSH’s business, investments and results of operations;
- Pershing Square is dependent on William A. Ackman;
- PS Holdings Independent Voting Company Limited controls a majority of the voting power of all of PSH’s shares;
- PSH shares currently trade at a discount to NAV and their price may fluctuate significantly and potential investors could lose all or part of their investment;
- The ability of potential investors to transfer their PSH shares may be limited by the impact on the liquidity of the PSH shares resulting from restrictions imposed by ERISA and similar regulations; and
- PSH is exposed to changes in tax laws or regulations, or their interpretation.

