
The Piotroski F-Score has been the only positive screener that has consistently done well over time despite 2018 market conditions. End of November results show it at 8.32% vs 2.9% for the S&P.
Q3 hedge fund letters, conference, scoops etc
Other “pure” value strategies continue to struggle in 2018. The dip in November hasn’t helped.
At the end of Nov 2018:
- The Altman Z screen is -8.9% compared to 2.9% for the S&P.
- CROIC has also taken a punch to the chin, ending the month with a YTD performance of -9.2%.
- FCF isn’t a sexy investment at -4.44%.
- Greenblatt’s Magic Formula is also down -4.27%.
It’s one of the reasons why we place heavy emphasis on using the Piotroski F-Score to filter and help rank our universe of stocks at Old School Value. We use it as a proven way to cut down the stocks that are purely speculative, haven’t shown improvements, or are getting caught playing fundamental games.
Piotroski F-Score Calculation
The Piotroski F-Score is a simple 9-point scoring system to determine the fundamental strength of the company. By focusing on the accounting, it looks at business performance to filter the winners from the losers. This model’s performance improves when it is combined with stocks with low price to book values.
The higher the score the better. The score ranges can be interpreted as follows: 1-4 is a bad score. 5-6 is acceptable. 7-9 is great.
The Piotroski Score will not work for every industry like financials or CapEx-heavy industries where debt is required to keep the business operating.
Piotroski Score rating categories
PROFITABILITY SCORES
- Positive net income compared to last year (1 point)
- Positive operating cash flow in the current year (1 point)
- Higher return on assets (ROA) in the current period compared to the ROA in the previous year (1 point)
- Cash flow from operations greater than ROA (1 point)
BALANCE SHEET HEALTH SCORES
- Lower ratio of
- long-term
- debt in the current period compared to the value in the previous year (1 point)
- Higher current ratio this year compared to the previous year (1 point)
- No new shares were issued in the last year (1 point)
OPERATING EFFICIENCY SCORES
- A higher gross margin compared to the previous year (1 point)
- A higher asset turnover ratio compared to the previous year (1 point)
If you are not using the Piotroski F-Score in your analysis and investment flow, you are missing out.
Old School Value Piotroski Score Quality Checks
We’ve made it easier to drill down into each company, by allowing users to filter based on each of the 9 conditions of the Piotroski Score. Check it out in our demo app.
It’s one of our first go to analysis tools. A super quick and easy way to get a narrative of the company.
Check out Tesla’s.
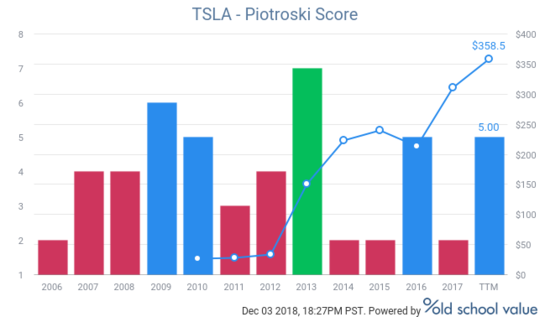
Let’s ignore the stock price for a second.
Actually, try and ignore that this is TSLA to begin with and look at the chart.
There are more troublesome years than good ones. From this, the narrative that I get based on my knowledge of how Piotroski works is that:
- Company is very cyclical
- Potential cash flow and accrual issues
- Likely problems with debt
- Margins are weak
Now I pull up something like AMZN.
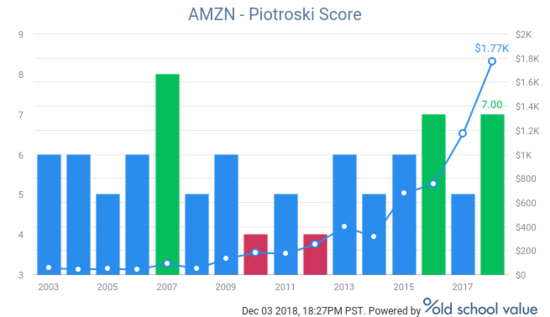
- Piotroski hasn’t been great historically but has been getting better since 2013.
- Signs of better profit
- Better cash flow
- Decrease in debt
- Improving margins
Not all points are correct, but it’s an example of how a single chart using the Piotroski Score can help you decide whether something is worth digging into.
Have time for one more?
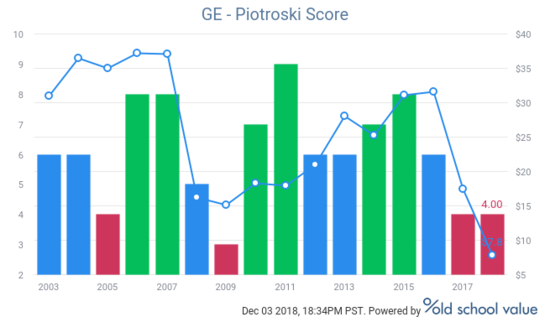
Check out GE. With such a low score from 2017, there was a big deterioration starting in 2016.
- Profits have dropped
- Margins have dropped
- ROA has dropped
- Debt has increased
Pretty much everything you don’t want to see happening in a business.
Check it out for yourself on the demo and see how you can use the Piotroski F-Score in your workflow.
What is Old School Value?
Old School Value is a suite of value investing tools designed to fatten your portfolio by identifying what stocks to buy and sell.
It is a stock grader, value screener, and valuation tools for the busy investor designed to help you pick stocks 4x faster.
Check out the live preview of AMZN, MSFT, BAC, AAPL and FB.
Article by Jae Jun, Old School Value

