
“Meanwhile, over the past 10 years, low interest rates meant that we kept bringing tomorrow’s growth forward to today. Unfortunately, we may now have run out of tomorrow’s growth, and are about to start to regret eating today’s growth yesterday.” – Louis-Vincent Gave, Gavekal Research
Q4 hedge fund letters, conference, scoops etc
Post each month-end I like to take a look at my favorite recession watch charts. It matters because in recession revenues decrease and those living high on debt reach the point their lender says, “no más.” Bankruptcies follow, the weak get their clocks cleaned and the strong survive. It’s estimated that about 30% of the companies in the Russell 2000 Index are not making a profit and a new Bank of America Merrill Lynch (BAML) study finds roughly: 13% of developed country public companies can’t even cover their interest payments. Their survival depends on debt. As long as capital is freely flowing, the party goes on.
So let’s take a quick look today at what the latest recession watch indicators are telling us. I know I’ve shared them with you before, but I’m a process guy and for me reviewing on a disciplined basis is mandatory. Cutting to the chase, the U.S. is doing ok while the balance of the developed world is likely in recession, with the current biggest hot spot in Europe.
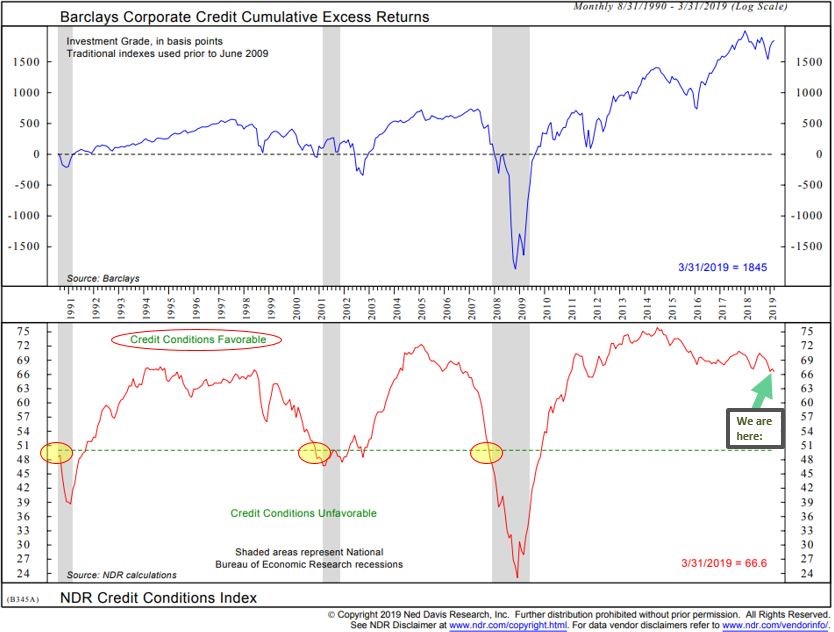
I would like to highlight one chart in particular, though they are all helpful — the Ned Davis Research Credit Conditions Index. I’m zeroing in on that one because of the massive amount of low-quality corporate debt and the 13% of public companies that “aren’t making enough money to cover their interest payments,” cited above. The Credit Conditions Index tells us if lending conditions are favorable or unfavorable. Current lending conditions are favorable… so that’s good news. It’s when the tide goes out, as Warren Buffett once said, that we’ll find out who’s swimming naked. BAML may have just put a “they are here” target on their backs.
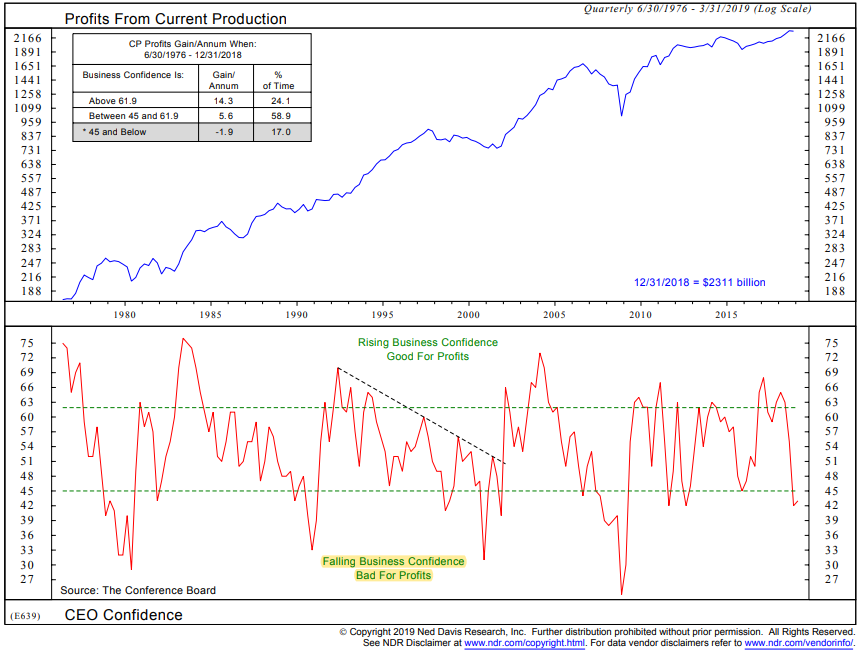
A few other quick notes on the economy. The latest employment figures were reported this morning and the number was pretty good. The monthly average in 2019 (three months of data) shows an average of 180,000 new jobs vs. 223,000 in 2018 so the trend is slowing. Notable in the numbers is that wage growth remains stagnant. Also worth mentioning is CEO Confidence which, as measured by the The Conference Board’s CEO Confidence Index, remains near its second-lowest level in this expansion. It suggests corporations will slow their spending and that we will likely see a coming decline in corporate profits. Peak earnings are likely behind us. Something that is likely not on many investor’s radars. Lower growth is also being signaled by the U.S. Leading Index. Its trend fell to 1.0% to the lowest level since November 2010. This corresponds to a 2.2% annualized real GDP growth in the next six months.
It’s worth remembering that it is income (from work or from investments) and borrowing that drive short-term economic cycles and long-term cycles. Parallel to this are short-term debt cycles and long-term debt cycles. The last long-term debt cycle peaked in the mid-to-late 1930s. It’s money spent that drives an economy higher. Credit is actually a form of money that is borrowed from tomorrow and spent today. More spending is good for the economy. The money you and I spend is ultimately someone else’s income. The baker, the butcher, the builder, the landscaper, the auto manufacturer, the auto dealer, the car sales person. Visualize how that multiplies. The same is true for corporations and true for all the actors in the economic ecosystem. Ultimately, debt builds to be too burdensome and has to be paid back. Along the path, it becomes a greater portion of their monthly budget and it leaves them with less to spend. An individual’s personal economy slows. If this happens on a mass scale, the overall economy slows. Less to spend is less money available to buy things.
Short-term cycles end in recession and reset. Long-term debt accumulation cycles are different. They are an accumulation of many short-term cycles and different in terms of size and risk. Few of us have lived through a long-term cycle. You know you get near the end when debt relative to GDP (measure of the market value of all goods and services produced) is more than 300% and the central bankers drop interest rates to zero.
We’ve got to keep our eye on when “the tide goes out.” A long-term debt accumulation cycle means the tide will be bigger and potentially more borrowers than we wish to see will be caught with their drawers down. Thus, my recession obsession and my belief that the opportunity on the other side of the next recession (and it may take two back-to-back recessions) will be exceptionally epic.
So grab a coffee, find your favorite chair and let’s walk through a few charts. Thank you for reading!
♦ If you are not signed up to receive my weekly On My Radar e-newsletter, you can subscribe here. ♦
Follow me on Twitter @SBlumenthalCMG
Included in this week’s On My Radar:
- Recession Obsession – Global Recession, but No Imminent Sign of U.S. Recession
- Trade Signals – Golden Cross (50- vs. 200-day MA), Sentiment and Bond Trend
- Personal Note – Beyond This Point There Will Be Dragons
Recession Obsession – Global Recession, but No Imminent Sign of U.S. Recession
Select Recession Watch Indicators
The average decline in the S&P 500 is approximately 37% during recessions. The last two recessions have given us greater than -50% each. I believe, given the fact that we have tripled up on the very same thing that caused the last recession (debt/leverage/Fed policy), the next recession will be equally or more challenging than the last two. Following are my favorite recession watch indicators.
Bottom line: We are likely in a global recession. There is no current sign of recession in the U.S. in the coming six months. I remain data dependent.
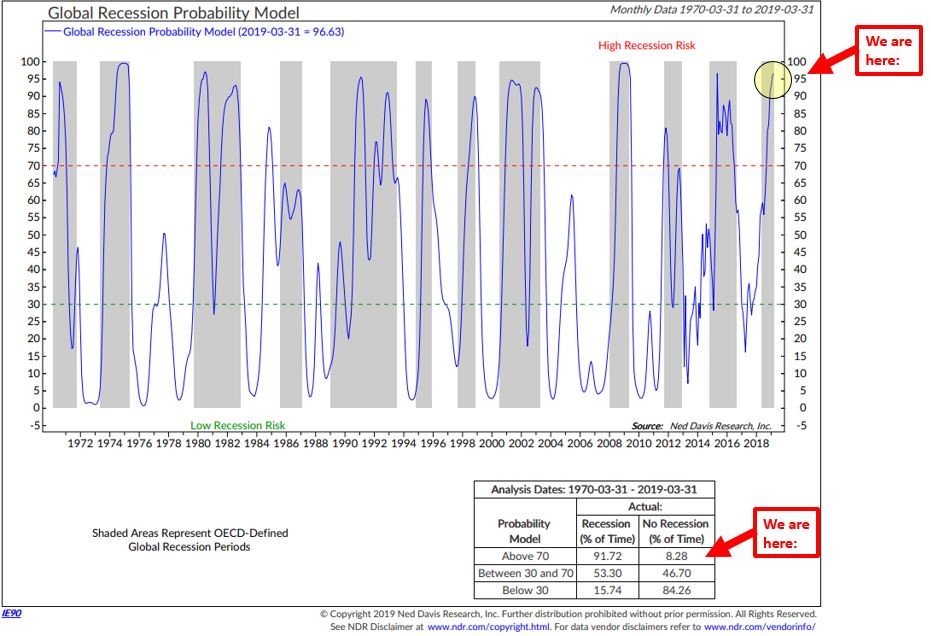
Global Recession Probability Indicator – High Recession Risk
- First, focus in on the blue line. It plots the probability of recession based on leading indicators from 35 different countries (non-U.S.). The current reading is 90.94, meaning there is a 90.94% probability that we are in a global recession.
- Note the red dotted line and the gray shaded bars that show periods in which the OECD said there was global recession (something known more than six months after the fact).
- Bottom line: When the blue line rises above the red dotted line, the global economy was heading into or already likely in recession. A global recession has likely started, which is unfavorable for global equities.
- Finally, focus in on the data box in the lower right section of the chart.
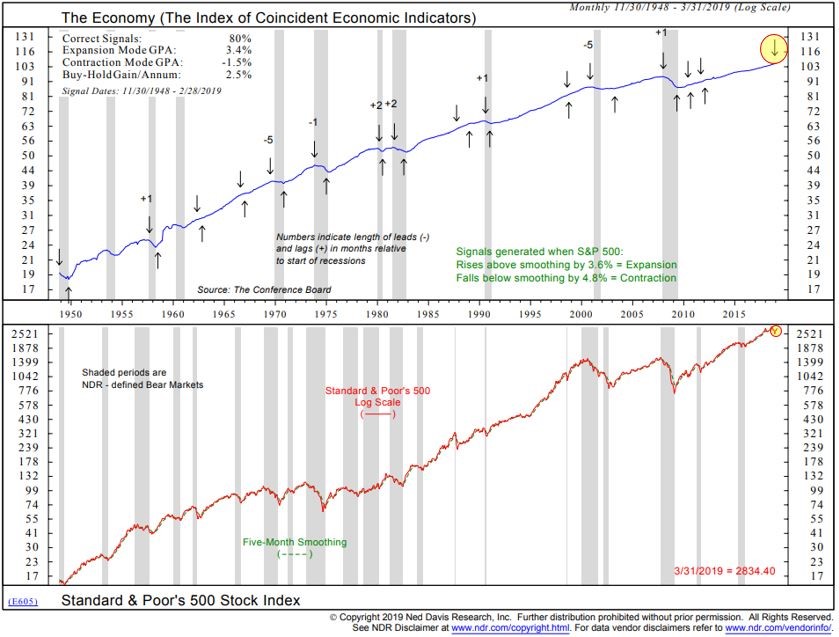
The Economy Based on the Stock Market Indicator – High U.S. Recession Risk
- In the next chart, focus on the up and down arrows. Economic expansion signals (up arrows) are generated when the S&P 500 Index rises by 3.8% above its five-month smoothed moving average line. Economic contraction signals are generated when the S&P 500 Index falls by 4.8% below its five-month smoothed moving average line.
- Current signal is “Contraction.” The most recent recession signal occurred on 3-31-2019. See down arrow upper right-hand side of chart (yellow highlight).
- Note the 80% “Correct Signals” in the top left corner of the chart. This process has done a good job at signaling prior to recessions. Not perfect but pretty good.
- With the strong year-to-date gains in the S&P 500 Index, should they hold in April, I suspect this indicator to turn positive by April month-end.
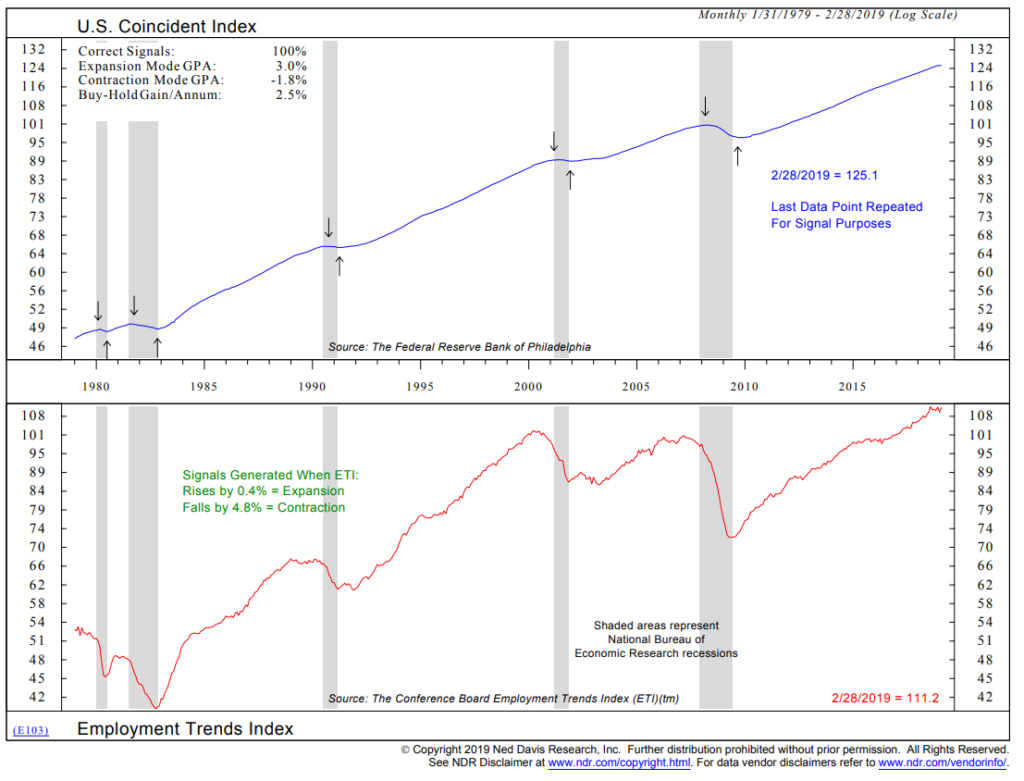
Recession Probability Based on Employment Trends – Low U.S. Recession Risk
- Focus in on the up and down arrows. Down is a recession signal. Up is an expansion signal.
- Expansion signals are generated when the Employment Trends Index rises by 0.4% from a low point.
- Contraction signals are generated when the index falls by 4.8% from a high point.
- Current signal indicates expansion. Last signal date in 2009.
Credit Conditions – Low U.S. Recession Risk
- Focus in on the lower section of the chart. A drop below the green dotted line has preceded the last three recessions. A relatively small data set but the idea is that when lending tightens up “Credit Conditions Unfavorable,” recession tends to follow. Gray bars indicate periods of recession.
- Currently, lending conditions are favorable.
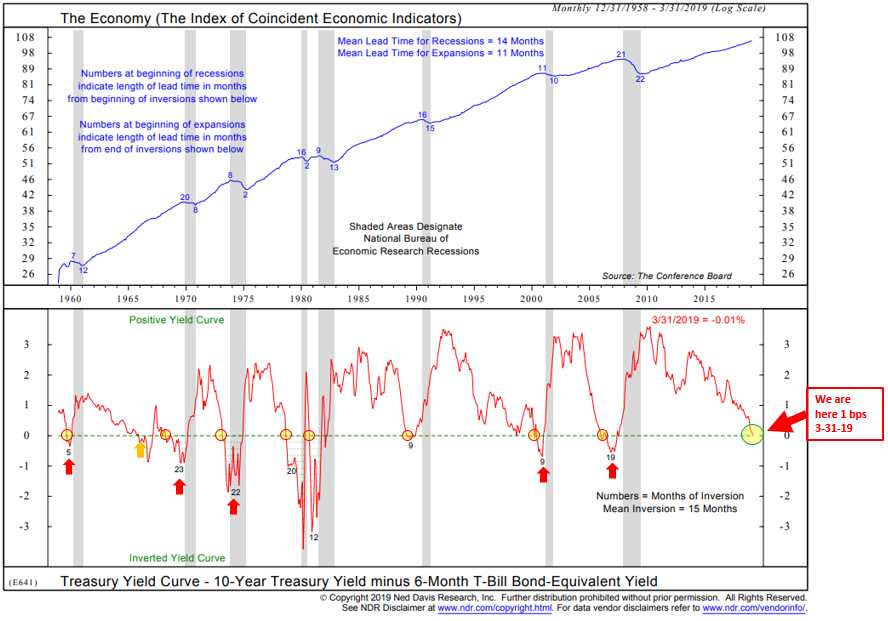
U.S. Economy vs. Yield Curve – Low U.S. Recession Risk
- The next chart looks at the spread difference between the six-month Treasury Bill and the 10-year Treasury Note.
- Key level is a drop below the green dotted line. It was near at just one basis point at March month-end. It is at 5 bps today (April 5, 2019)
- Such drops below 0 is what is known as an inverted yield curve. It is when the six-month Treasury Bill yield is higher than the longer-duration 10-year Treasury Note yield.
- An inverted yield curve has preceded every recession since 1958 (lower section of chart).
- Bottom line: No current signal of U.S. recession but nearing inversion.
- Note too that once the yield curve inverts, recession follows about a year later. Some followed sooner, some later. I suggest taking serious defensive measures shortly after it inverts.
I haven’t shared this next chart with you before. Simply note how falling business conditions are bad for profits. Lower profits = lower earnings = higher price-to-earnings ratios = higher risk.
I was in Texas this week presenting at an advisor event hosted by Joe Quartucci and his team at e3 Wealth. John Mauldin and I spoke about the debt cycle and how the period ahead is likely to play out. Recession is key to understanding when the broader risks will trigger. Given the challenges we foresee ahead, we believe it is so important to work with an advisor with a protect-and-advance portfolio mindset, a balanced consultative approach and the knowledge of tools available to help you in your road ahead. A special thank you to our hosts. You are true professionals.
John sent me a preview of his Thoughts from the Frontline letter and I want to share this section with you as he explains clearly how the economic system works:
Back in November 2018, which now seems like about 30 years ago, I wrote about a Bank for International Settlements study of “zombie” businesses. Looking at the 32,000 publicly-traded companies in 14 advanced economies, they found 12% were both
- At least 10 years old, and
- Had an interest coverage ratio below 1.0 for three consecutive years.
In other words, these companies weren’t making enough revenue to pay back their loans, much less cover their other expenses and earn a profit.
Note, these are not startup companies. All were at least ten years old and still in business despite being apparently unable to make any money. Here was my conclusion at the time.
Faced with a probable loss, lenders always face a temptation to “extend and pretend.” They convince themselves that another year or another quarter will let it turn into a sterling borrower who pays in full and on time. And more often than not, the zombie company has a charismatic CEO or founder who can charm lenders.
Now, there are perfectly understandable, human reasons for this. No one wants to force people out of their homes or put a company out of business and leave its workers jobless. But capitalism requires both creation and destruction. Keeping zombies alive hurts healthy companies. BIS found it actually reduces productivity for the entire economy.
The other side is that lenders must lose their money, too. Those who make irresponsible lending decisions have to face market discipline or they will keep doing it, causing further problems. Unfortunately, we do the opposite. Bailouts and monetary stimulus over the last decade generated a lot of unwise lending that is not going to end well.
Many (possibly most) of these zombie companies should fail. Or, more accurately, they will fail either suddenly in a crisis, or in slow motion if their lenders won’t bite the bullet. There really are no other options. And when they do, it will hurt not only their lenders but their suppliers, workers, and shareholders.
That, my friends, is how recessions begin. If we’re lucky, it will occur gradually and give us time to adapt. But more likely, given high leverage and interconnected markets, it will spark another crisis.
Now a Bank of America Merrill Lynch study finds roughly the same thing: 13% of developed country public companies can’t even cover their interest payments. They are either borrowing more money to pay off previous lenders, or issuing equity to hopeful (too hopeful) investors. (Emphasis mine)
Sidebar: in a few isolated cases, that’s actually good. If you’re up developing biotech company, for instance, your revenues are in the future. Hopefully, you are developing a new product or drug that will help change the world for the better, and those future revenues really will materialize. I know more than a few of them… As an investor, I try to figure out which ones will make it, and hopefully make it really big. There are a lot of industries besides biotech where startups are not yet producing revenues but will be the future. Startups and new ventures are what create the future. Back to the point…
While it’s easy to say these investors are making poor decisions, they’re not doing it in a vacuum. They’re trying to earn positive returns in a world where central bankers have made positive returns an endangered species. This means everyone is operating with distorted information and incentives. We’re in a hall of mirrors, so no surprise some people crash into the glass.
None of this is “natural.” It’s not the free market gone wild. It is the result of a manipulated market. The manipulators are still there… and not finished yet. It’s the current version of manipulated/crony capitalism that has gone wild. Sadly, the manipulators have just begun…
John’s letter will post very early Saturday morning. Grab two coffees this week… you can find his letter here.
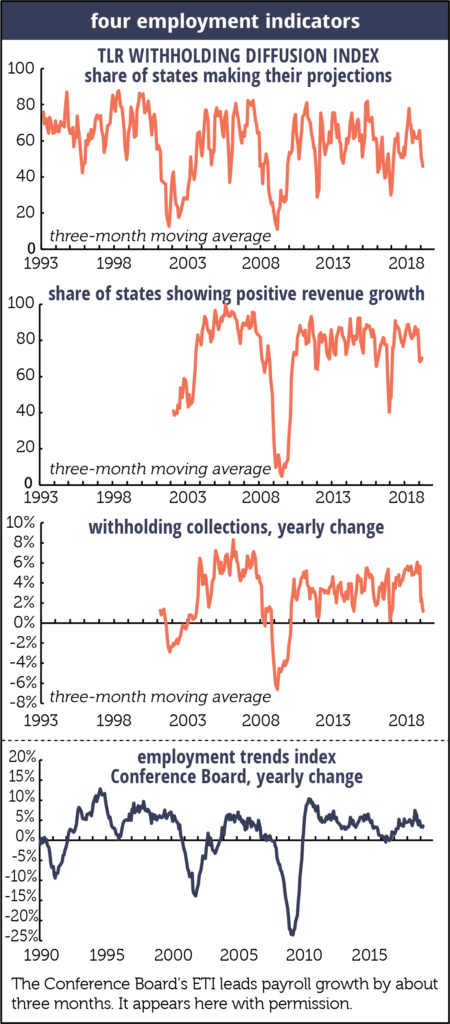
One last chart – Camp Kotok fishing friend Philippa Dunne writes an excellent economic piece. Her unique work looks at state tax receipts and she is close and connected with the individuals on the inside (individual states across the country) that put the data together. The idea is that if tax receipts are in decline, businesses and individuals are not doing so well. When strong, all is well.
Here is how to read this next chart:
- Note the third section in the series. It shows the year-over-year change in “withholding collections.” Bottom line: keep an eye on a drop below 0%. Recessions followed the last two breaches of the 0 line (2001 and 2007/08).
You’ll see next in the Trade Signals section that all of the trend signals are green. In the car ride from Austin to Dallas, Joe Quartucci said, “The Shiller PE is now higher than it was in 1929.” He is advising caution and he is right. Equity market valuations (see OMR here) may stay higher for longer given low inflation and low interest rates; yet, over the long-term, value will win the fight. Risk remains high. More defense than offense. If you are in Texas and looking for a great financial advisor, Joe’s a ten.
Trade Signals – Golden Cross (50- vs. 200-day MA), Sentiment and Bond Trend
April 3, 2019
S&P 500 Index — 2,867
Notable this week:
No significant changes since last week’s post. The “Golden Cross” 50-day vs. 200-day MA moved back to a buy signal. This is an intermediate to long-term trend indicator. All of the equity market trend indicators are bullish. The fixed income indicators remain bullish, as do both the short-term and long-term gold trend signals. Investor sentiment is neutral to extreme optimism.
You’ll find the updated equity and fixed income charts below as well as the most recent recession watch charts. The recession charts will be updated next week (they are dependent on month-end data). Thanks for reading. Have a great week.
Click here for this week’s Trade Signals.
Important note: Not a recommendation for you to buy or sell any security. For information purposes only. Please talk with your advisor about needs, goals, time horizon and risk tolerances.
Personal Note – Beyond This Point There Will Be Dragons
We concluded our Austin and Dallas events over the last two evenings. We talked about the End of the Debt Super Cycle, the Great Reset and how the period ahead may unfold. To be clear, it is impossible to know for it depends on the actions of legislators and central bankers. We agreed the ability to solve the debt (and pension) problems will not happen absent crisis. There is simply no political will. No urgency.
Mauldin and I both believe the U.S. is about 10 years behind Japan. We are likely to pick a similar path. John looked up at the audience and said, “We have bad and really bad choices. Wanderers on their quest, they get to a point deep in the canyon and reach a sign that reads, ‘Beyond this point there will be dragons.’” We are going into unexplored territory.
The Great Depression in 1930s had its own issues, but they were nothing like we have today. The Japanese path means monetizing our debt (printing and buying and putting on the government balance sheet) and buying equities. A path not without its own set of consequences. Beyond this point? Let’s just hope we find cute and cuddly dragons.
I mentioned to you last week and again to the audiences in Texas that the high yield bond market holds the key. “… if spreads start to widen, then the odds of the last scenario will go through the roof—and the price of most financial assets through the floor.”
What “spreads start to widen” means is that the yield on high yield bonds moves up much higher than the yield on safer bonds, such as high grade corporates and Treasury bonds. For yields on HY bonds to move higher, it will be because prices fall. Investors sell fearing corporate defaults. This is something, I believe, we can easily control with a simple trend- following process that plots the daily price movement in the HY bond market.
There is no current sign of spreads going higher, so “No Dragons.”
The Mauldin Strategic Investment Conference is May 13-16 in Dallas. David Rosenberg will once again kick off the conference on Tuesday morning, May 14. I’ll be moderating a discussion with the Economic Cycle Research Institute’s Lakshman Achuthan and Peter Boockvar, CIO of the Bleakley Financial Group. Both are Camp Kotok fishing friends. If you are curious about the conference agenda, speakers, etc., you can find more information here.
My sister Amy moved to Dallas and joined us for dinner. She is always so happy and it was so nice to spend time with her.
I’m finishing this post from 30,000 feet en route to Snowbird, Utah. A long weekend of skiing and, most importantly, some time with my beautiful daughter, Brianna. She is flying in from NYC. I first took Brie to Snowbird in April 1993. She was just a few months old. My father and stepmom joined us. Dad got me going when I was three for which I am so grateful. I put Brie in a baby carrier, and we skied a few easy runs. Her mom was not at all pleased with the idea but all went well and here we are 26 years later. I’ll be doing my best to keep up with her. I’m checking in happy again.
I do hope you are doing something for yourself that lights you up. Stay positive and keep pointing your ski tips downhill. The years are short… “Ever forward” as a very good friend often tells me. Ever forward!
Wishing you an outstanding day!
Best regards,
Stephen B. Blumenthal
Executive Chairman & CIO

