
“I think now is a good time 1) to look at past paradigms and paradigm shifts and 2) to focus on the paradigm that we are in and how it might shift because we are late in the current one and likely approaching a shift.” – Ray Dalio, “Paradigm Shifts” (July 17, 2019)
Q2 hedge fund letters, conference, scoops etc
For the last two days, I’ve been racing around from meeting to meeting in Los Angeles. Great weather, terrible traffic and little down time. In this week’s post I share with you a must-read from Ray Dalio. Share it with your investment committee or, if you are an individual investor, I sure do hope it gets you thinking and prepared. If you don’t know Dalio, he founded Bridgewater Associates, the largest (managing approximately $160 billion in assets) and one of the most successful hedge fund managers on the planet. Ray writes:
History has taught us that there are always paradigms and paradigm shifts and that understanding and positioning oneself for them is essential for one’s well-being as an investor and beyond. The purpose of this piece is to show you market and economic paradigms and their shifts over the past 100 years to convey how they work. In the accompanying piece, ‘The Coming Paradigm Shift,’ I explain my thinking about the one that might be ahead.
You’ll find the link to the full piece below. In my view, the shift begins in the recession… when liquidity dries up. It quickens when we lose faith in governments. Like the Bear Stearns sub-prime hedge fund that cracked in 2007, there will be warnings and I believe we are seeing such cracks in the leveraged loan and high yield bond markets. The thing is, there is a little bit of a Chicken Little syndrome in the early innings of change. Ray’s sharing a bit of a navigational road map. I’m sharing it with my team and if you have that coffee in hand and ready to go, I’m sharing it with you.
Recession Timing – A Quick Look
I have been writing about the time lag from when the yield curve first inverts until we get a recession. I’ve mentioned it takes on average approximately 14 months. Fourteen months may be generous. Ned Davis Research (NDR) calculates it to be 12.4 months. Same end conclusion and I’ve muscled up some additional stats with big hat tip to NDR.
I found the next bit of data helpful and hope you do as well. NDR plotted the date the yield curve inverted. In English, that’s when short-term 3-month Treasury yield is higher than the longer-term 10-year Treasury yield. It’s important to note that inversion didn’t always lead to recession, but every time inversion occurred and stayed inverted for three months, recession has followed. That’s the case today with the most recent inversion signal occurring on March 22, 2019.
The implications are that we will be in a recession by February/March 2020 though it may be sooner and it could come a little later. But what comes first — bear market or recession?
There have been nine inversions since 1966. Take a look at the chart below.
Here is how to read it:
- The left-hand column shows the date when the yield curve inverted.
- The second column shows the date the bear market started (a 20% decline or greater defines a bear market).
- The third column shows the date the recession started (defined as two quarters of negative growth – thus we only know they started in hindsight).
- The fourth column shows how many months it took from inversion to bear market start, the fifth shows months from inversion to recession start and the sixth shows time it took from bear market to recession start.
- Note that there were no recessions in 1966 nor 1998, but both years experienced bear markets (1966 was the beginning of a long-term bear market that lasted to 1981. 1998 was the Long Term Capital Management crisis).
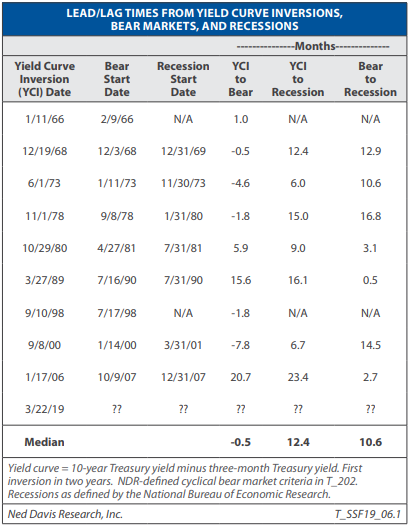
Source: Ned Davis Research
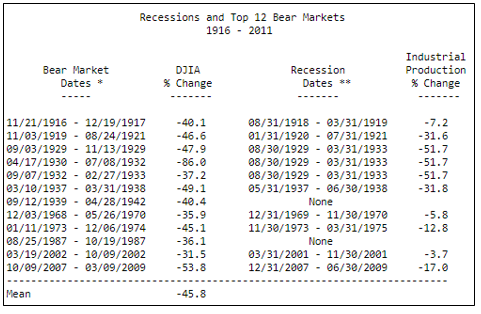
Recessions and Top 12 Bear Markets
Grab that coffee and find your favorite chair. Today’s post is a short read. Stay cool!
If a friend forwarded this email to you and you’d like to be on the weekly list, you can sign up to receive my free On My Radar letter here.
Follow me on Twitter @SBlumenthalCMG
Included in this week’s On My Radar:
- “Paradigm Shifts”
- “Bubble, Bubble, Toil and Trouble”
- Trade Signals – Margin Debt Signals Warning
- Personal Note
“Paradigm Shifts” by Ray Dalio
Key highlights from Ray’s report:
“During the 50 or so years that I’ve been a global macro investor, I’ve found that markets and market relationships tend to operate in a certain way (which I call “paradigms”) over relatively long periods (about 10 years). When one paradigm shifts to another, the relationships in the new paradigm are often more opposite than similar to the prior period. Identifying these shifts and navigating them well is critical to being successful as an investor.
I believe that we are likely approaching such a shift and recently explained the dynamic as I see it in the following report. I thought you might find it interesting.
- There are always big unsustainable forces that drive the paradigm. They go on long enough for people to believe that they will never end even though they obviously must end.
- A classic one of those is an unsustainable rate of debt growth that supports the buying of investment assets; it drives asset prices up, which leads people to believe that borrowing and buying those investment assets is a good thing to do.
- But it can’t go on forever because the entities borrowing and buying those assets will run out of borrowing capacity while the debt service costs rise relative to their incomes by amounts that squeeze their cash flows.
- When these things happen, there is a paradigm shift. Debtors get squeezed and credit problems emerge, so there is a retrenchment of lending and spending on goods, services, and investment assets so they go down in a self-reinforcing dynamic that looks more opposite than similar to the prior paradigm.
- This continues until it’s also overdone, which reverses in a certain way that I won’t digress into but is explained in my book Principles for Navigating Big Debt Crises, which you can get for free here.
I want to emphasize that understanding which types of paradigms exist and how they might shift is required to consistently invest well. That is because any single approach to investing—e.g., investing in any asset class, investing via any investment style (such as value, growth, distressed), investing in anything—will experience a time when it performs so terribly that it can ruin you. That includes investing in “cash” (i.e., short-term debt) of the sovereign that can’t default, which most everyone thinks is riskless but is not because the cash returns provided to the owner are denominated in currencies that the central bank can “print” so they can be depreciated in value when enough money is printed to hold interest rates significantly below inflation rates.
In paradigm shifts, most people get caught overextended doing something overly popular and get really hurt. On the other hand, if you’re astute enough to understand these shifts, you can navigate them well or at least protect yourself against them.
- I want to emphasize that understanding which types of paradigms exist and how they might shift is required to consistently invest well. That is because any single approach to investing—e.g., investing in any asset class, investing via any investment style (such as value, growth, distressed), investing in anything—will experience a time when it performs so terribly that it can ruin you.
- That includes investing in “cash” (i.e., short-term debt) of the sovereign that can’t default, which most everyone thinks is riskless but is not because the cash returns provided to the owner are denominated in currencies that the central bank can “print” so they can be depreciated in value when enough money is printed to hold interest rates significantly below inflation rates.
- In paradigm shifts, most people get caught overextended doing something overly popular and get really hurt. On the other hand, if you’re astute enough to understand these shifts, you can navigate them well or at least protect yourself against them.
I think now is a good time 1) to look at past paradigms and paradigm shifts and 2) to focus on the paradigm that we are in and how it might shift because we are late in the current one and likely approaching a shift.
You can find a link to the full piece here. I encourage you to take the time if you can to understand the deeper implications and what you can do to protect your wealth.
“Bubble, Bubble, Toil and Trouble” by Rob Arnott, Bradford Cornell, Shane Shepherd
This is a thoughtful and balanced article. My highlights/excerpts with link to the full piece.
- Today, Tesla, bitcoin, and certain US technology stocks are valued far above their fundamentals and are well into bubble territory. These assets are well avoided by investors, as are US market cap–weighted indices, which have an historically large concentration of pricey and overvalued large-cap tech stocks.
- Investors who take advantage of today’s anti-bubbles have the opportunity to add value by investing in the emerging markets, particularly state-owned enterprises (SOEs), and by averaging into the UK stock market where stocks are feeling the pressure of Brexit-related uncertainty.
- Value-oriented smart beta strategies in both the developed and emerging markets offer investors promising investing opportunities outside the many bubbles in today’s global markets.
- In April 2018, we published our most-downloaded article ever, “ It’s a Bubble. So What?” Our key purpose was notto make the observation that “Yes, it’s a bubble,” but to offer a formal definition of bubble, which is perhaps the first formal definition that can be used to identify a bubble in real time instead of years after the fact. A second point we made was that bubble prices (asset prices far higher than those a valuation model can justify with plausible assumptions) can continue to soar higher and longer than many of us might imagine. As the saying goes, “the market can remain irrational far longer than you can remain solvent.” Indeed, in true bubbles, we should expect them to soar—until they don’t.
- Our third point was to illustrate how investors can use the definition to identify and avoid the trap of current bubbles and instead seek out anti-bubbles and assets that are likely undervalued.
The authors make the point when you buy pricey and overvalued stocks, it may take years to get back to even (next chart). I mention below in Trade Signals the return for the NASDAQ was 40% in 1998 and 85% in 1999.
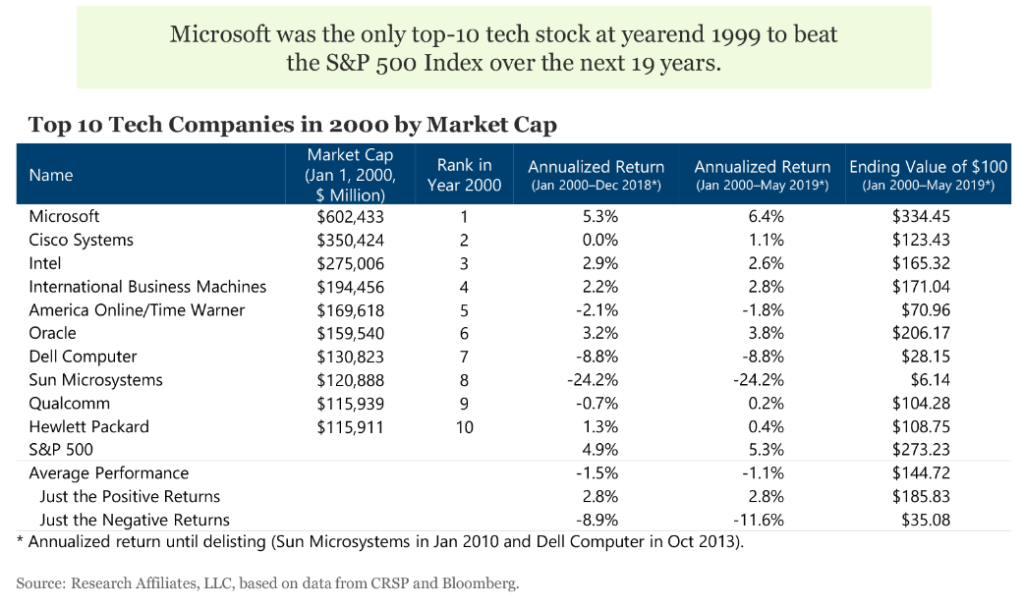
Source: Research Affiliates, LLC, based on data from CRSP and Bloomberg
According to Howard Silverblatt at S&P Dow Jones Indices, the top 10 contributors accounted for 32% of the S&P 500’s return from 2,000 on the index to 3,000. The FAANG stocks accounting for 13% of the index’s return. I remember trying to prevent a client from investing in what she said were “safe stocks.” It was December 1999. Three years later her $1 million was down to $450,000. She bought a number of the stocks on the above list. She was confident in her decision to buy. She should have waited until she was nervous, fearful and not confident. Today, it feels like 1999 to me all over again.
The authors go on to say:
Defining a bubble requires applying reasoned judgment around unobservable variables. What constitutes a ‘plausible projection of expected cash flows’ likely differs from one observer to the next and identifying the motivations and beliefs behind the mass of investors’ purchasing decisions generally requires careful assessment. Even so, the importance of a definition applicable in real time cannot be overstated. Too often, pundits identify bubbles much like the National Bureau of Economic Research identifies recessions: only in hindsight, typically years after the fact, which offers no actionable opportunity for investors in real time.
They conclude with a few ideas. You can find the link to the article here.
Trade Signals – Margin Debt Signals Warning
July 17, 2019
S&P 500 Index — 2,995
Notable this week:
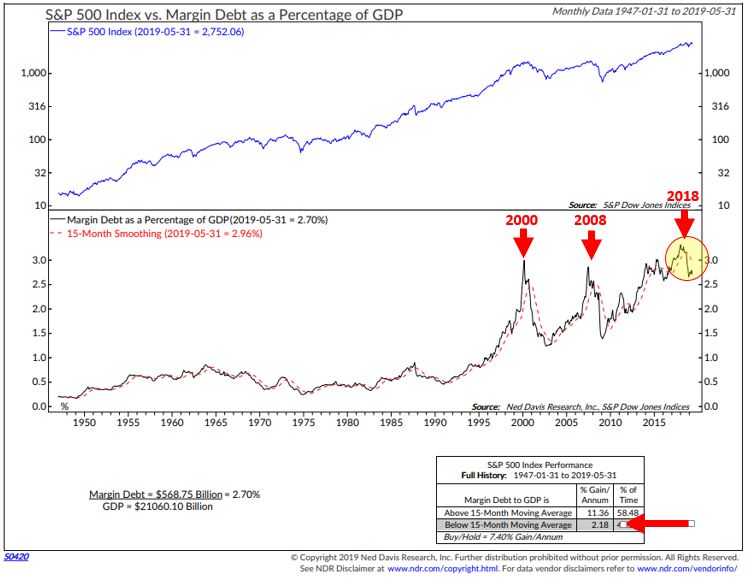
Adding to the concern pile is the amount of Margin Debt in the system today. One can look at margin debt a number of ways. The chart below compares the overall size of margin debt to GDP (what the U.S. collectively produces as a nation). It then plots the performance of the S&P 500 Index when the trend of margin debt is increasing (above its 15-month smoothed moving average trend line) and the performance when margin debt is being reduced relative to GDP (below its 15-month MA trend line). Think of it as buying demand (investors “margining up” to buy more stocks) vs. selling pressure (investors deleveraging – selling stocks). Importantly, focus in on 2000 and 2008. Serious risk occurs when stocks decline and margin calls escalate. Forced selling during panic periods, the unwinding of leverage in the system, is what creates V-like bottoms. The message today is total margin debt made a new record high in 2018, higher than the last two pre-recession market peaks and margin debt is now below its 15-month trend line. Thus, margin debt currently signals warning.
With that said, the bullish trend for equities persists. There are no material changes to our trade signals this week. It is notable that investor optimism, as measured by the Ned Davis Research (NDR) Crowd Sentiment Poll, is in the Extreme Optimism zone (chart below), which is a short-term bearish signal for equities.
The global economy is likely in recession. We continue to diligently monitor both the U.S. and global recession indicators. You’ll see below that the 3-month vs. 10-year Treasury yield has been inverted for more than three months. Recession has followed in all prior cases yet with a lag. I believe U.S. recession is probable within six to nine months. Further, a few weeks ago, the New York Federal Reserve Bank published an update to their recession probability index, indicating an increase in the probability of a U.S. recession in the next 12 months. It’s important to note that, every time since 1960 that this index breached 30%, a recession occurred. We keep watch.
Not a recommendation for you to buy or sell any security. For information purposes only. Please talk with your advisor about needs, goals, time horizon and risk tolerances.
Click here for this week’s Trade Signals.
Personal Note
It’s been a crazy, fun pace this week. The highlight was a tour (by golf cart driven by my son Kyle) of Paramount Studios in Hollywood. He’s interning with the production team of a popular TV show. An outstanding Italian dinner followed at Skylight Gardens in Beverly Hills with a mighty fine Barolo. Not sure how an Italian restaurant came up with that name but the linguine pescatore was amazing.
Wishing you well. Have a great weekend.
Best regards,
Stephen B. Blumenthal
Executive Chairman & CIO
CMG Capital Management Group, Inc.

