
The bear market that small-cap stocks endured at the end of 2018 gave us plenty of long-term buying opportunities.

2018: Annus Horribilis
This was quite a memorable year for the equity markets—for reasons most investors would prefer to forget. A bull market ended with a bang that left many investors whimpering. Of course, the end of any upswing for share prices is bound to be disappointing—what made this pullback so jarring was its speed and severity. Back in the summer, everyone seemed to agree that valuations were stretched to the point where an adjustment to prices was all but inevitable, yet the force of the decline felt more like the engine of a precision-engineered sports car suddenly seizing than the anticipated tapping of the brakes. So while 2018’s downturn initially looked as if it would assume a place among the most predicted in history, no one, including us, was expecting a fall as steep and fast as this one has been. It has also, however, performed the role down markets do—which is to provide active managers with an ample supply of potential long-term opportunities.
If you’re looking for more timely hedge fund insight, ValueWalk’s exclusive newsletter Hidden Value Stocks offers exclusive access to under-the-radar value hedge funds and their ideas. Click here to find out more and signup for a free no-obligation trial today.
Part of the reason the jolt was so unexpected may be due to the placid nature of the bull market it wrenched to a stop. For much of 2018, the U.S. market cruised confidently ahead, with very little congestion and few potholes. Through the first three quarters of the year, volatility barely registered in the small-cap market, with only 22% of the trading days having intraday moves of at least 1% in the small-cap Russell 2000 Index (and our chosen asset class has historically been the most volatile precinct of the equity world). Of course, this all changed dramatically later in the year. For small-caps, it began after the Russell 2000 reached an all-time high on August 31, following which a wave of volatility hit. In the fourth quarter, 54% of the trading days for the Russell 2000 had intraday moves of at least 1%.
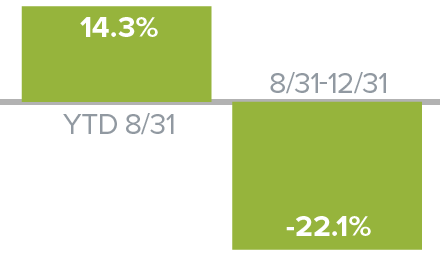
The volatility itself would have perhaps been more bearable if it had not also taken returns in the year’s last three months from ‘bad’ to ‘historically awful’—the Russell 2000 fell 20.2% for the fourth quarter. Its worst month by far was December. In fact, the first few months of the corrective phase had enough push and pull that the year-to-date return at the end of November for the Russell 2000 was 1.0%. From our perspective, then, the downturn had two phases—the first was the widely expected recalibration from late August through mid-December. The second was a blur of panic selling between December 12th and 24th. Losses mounted as the gentler descent of the initial stage gave way to a wild downhill. The markets careened down the slope at breakneck speed as the calendar approached year-end, with small-caps reaching a 2018 bottom on Christmas Eve before stabilizing over the next week, giving the Russell 2000 a loss of 11.9% for December. In the context of its 11.0% decline for calendar 2018, it may be easy to forget that year-to-date through August 31, the Russell 2000 was up 14.3%.
“A Tale of Two Markets”
Russell 2000 2018
So 2018 was truly A Tale of Two Markets, and offered yet another lesson from history that the market can—and often does—turn in a hurry. For an additional sense of the tumult and—we want to stress again—the opportunities the correction created, consider that the average stock in the Russell 2000 declined 37.2% from its previous 52-week high through year-end. Many declined more than that: energy stocks in the Russell 2000 fell more than 50%, materials slid 42.5%, and transportation was down 42.3% from their respective highs.
“What Just Happened?”
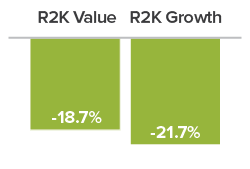
Retrospect offers the opportunity to look at the contour of the correction and at the confluence of factors that may have led to and exacerbated it. In spite of its historic awfulness, the downturn displayed some familiar traits: small-caps lost more than large-caps, for example, which is consistent with most bear markets, as is the fact that small-caps entered ‘classic’ bear market territory before their larger counterparts. (By a ‘classic’ bear, we mean a decline of 20% or more from a previous peak—the Russell 2000 lost 22.1% from 8/31/18-12/31/18.) Within small-cap, we also saw value beat growth, dividend payers lose less than non-payers, earners hold up better than non-earners, and defensives outpace cyclicals. All of this is also essentially consistent with history, which was reassuring (though painful in the short run).
A Familiar Pattern in 4Q18 Decline

Identifying this mix of the familiar and the unexpected helps to shed light on the question of what drove shares down in such precipitous fashion, turning what at first looked like a historically typical bull market detour into the bear market ditch. First, there was the by-now familiar cloud of tariffs and trade wars looming over the market, arguably the major factor in underperformance for economically sensitive cyclical stocks in 2018. Oil prices began to collapse in October, while shortly afterward slowdowns were reported in both housing and auto sales. Consumer confidence began to dip, and Europe and China continued to weaken. Yet all of this was, if not old news, then at least well established news by the end of November. Moreover, much of the economic news in the U.S. remained robust. Job and wage gain growth remained robust (as they continue to do as of this writing) as did corporate profits.
In mid-December, however, other factors came into play that helped to bring the witches’ brew to a boil. Investors looked at the coincidence of a flattening yield curve and the abrupt drop in oil prices as a surefire recession warning. Ratcheting up the already high level of anxiety, the December Fed meeting announcement and subsequent press conference were widely seen as conveying an unhealthy detachment from current financial conditions, which exacerbated the downward spiral. This is how ‘bad’ became ‘worse.’
A Sense of Where We Are
A month into 2019, which featured a welcome rally that recovered most of December’s losses, the signals remain decidedly mixed. The PMI (Purchasing Managers’ Index) report for December issued in early January perhaps best distills the mixed, if not confusing, state of play in the U.S. economy. The report is designed to show the health of the manufacturing and service sectors. The index hit a 15-month low in December, which is admittedly concerning, especially given the marked fall-off from November. However, of its 18 manufacturing sectors, 11 showed growth in December. Additionally, the 54.1% number reported for that month was comfortably in the range of a growing economy because any number north of 50% typically indicates growth. Even with the uncertain course of U.S. growth, it seems clear to us that in 2018 many investors reacted as if the economy has only two gears—forward and reverse.
We see a more nuanced picture that’s closer to the midpoint of these extremes. The economy looks essentially healthy and capable of expansion to us, though probably at a slower pace than we saw over the last two years. There are undoubtedly risks on the horizon—political, financial, and economic. Yet we believe that these have already been reflected, in some cases excessively so, in current small-cap valuations. The market shifted in short order from a period when small-cap’s extended valuations seemed out of sync in light of the index’s high levels of debt and low profitability, to one at the end of the year when valuations reflected more pessimism than we think is warranted—at least in select instances.
The Lessons of History
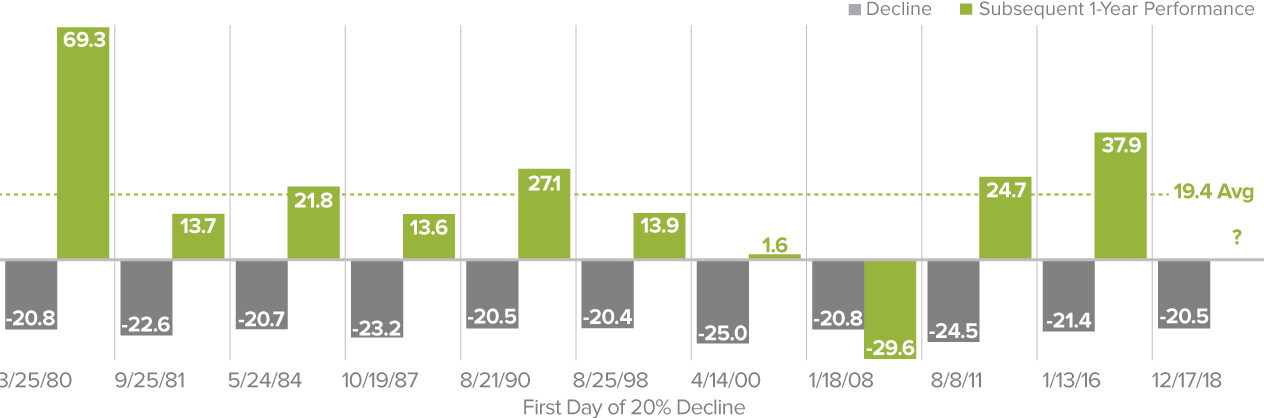
We examined the recent bear phase from a calendar-year and market cycle perspective and uncovered encouraging data. First, 2018 was the twelfth negative calendar year in the 40-year history of the Russell 2000. In 10 of the previous 11 years, a positive calendar-year return followed—with an average one-year return of 21.1%. (Unsurprisingly, the lone exception was 2007-08.) Turning to market cycles also shows compelling positive news. 2018 saw the eleventh decline of 20% or more from a previous small-cap peak. In nine of the previous 10 periods, the subsequent average one-year return from the first day on which the index declined 20% from its peak was a positive 19.4%. (The exception, again unsurprisingly, came in 2008-09.) These historical examples certainly suggest the possibility of a solid 2019.
After the Bear Market, Then What?
Subsequent 1-Year Performance of Russell 2000 after a 20% Decline as of 12/31/18
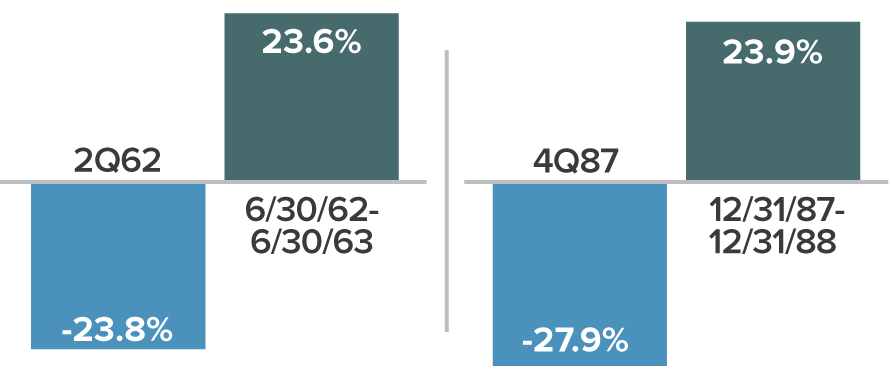
To be sure, our belief is that we are a long way from the crisis era of a decade ago. We are also in a stronger position economically than we were in the two prior bear markets in 2011-12 or 2015-16. In fact, we see the closest historical parallels farther back. In our view, 1987 or 1962 are the more relevant comparisons—two cases in which the markets experienced a deep decline before recovering in the midst of a still growing economy. Moreover, we also see little resemblance between the present and prior bearish periods such as 1998, 2001-02, or 2008-09, when there were more than enough reasons for investors to sell in the form of financial crises and/or recessions (while contrarians like us were casting about for opportunities). It’s worth emphasizing that the only decline over the last 10-plus years that featured both a recession and a financial crisis was 2008-09. Unless investors are expecting something in the way of a repeat performance—and we are obviously not—history suggests this may be a good time to consider committing more money to small-caps.
Historical Comparison
CRSP 6-10 Declines and Subsequent 12-Month Performance
A Deliberate Pace on the Road to Normal
We would, however, add a note or two mixing intermediate-term caution for the small-cap market with long-term optimism for small-cap active management. 2019 may well be a terrific year for small-cap performance, particularly if January is any kind of bellwether. However, we suspect that annualized small-cap returns over the next three to five years may be in the mid to high single digits. From our perspective as disciplined small-cap specialists, this is not necessarily bad news. Lower-than-average returns for the Russell 2000 have historically benefited active management approaches, including a number of our own strategies, especially coming out of periods of deep pessimism such as we saw late in 2018, when investors often miss the long-term opportunities falling markets create.
We also believe that the long and winding road back to more normal terrain for the capital markets will be marked by three occurrences: a normalizing rate structure, with rates moving higher, resulting in a steepening yield curve; more historically average levels of volatility (which was higher in 2018 than it was over the previous two years); and the more historically typical returns that we mentioned above. All three of these market conditions have been supportive for small-cap active management in the past.
The overall state of small-cap, however, still has several unresolved issues. Of the three that worried us most about the Russell 2000 over the summer—lofty valuations, many companies with barely manageable debt, and too many with no earnings—only the first is no longer a pressing matter. We think that the fundamentals we value most—such as high returns on invested capital, positive cash flow, and an identifiable catalyst (or two) for earnings growth or recovery—should be rewarded in the coming market environment, as they have often been over the long term.
Identifying Opportunities in a Volatile Climate
In all of our strategies, we’ve been working to take advantage of long-term buying opportunities across a broad spectrum of sectors and industries. This includes companies involved in energy services, RV parts, infrastructure, laser-based photonics, shipping, trucking, banking, outpatient healthcare facilities that bend the cost curve, and semiconductor capital equipment, to name just a few. Within our high-quality strategies, we’ve also been buying more of the companies that we know best, those in which we have the highest confidence, because of their demonstrated ability to deal effectively with adversity in previous down markets.
Cyclical Market Disconnect
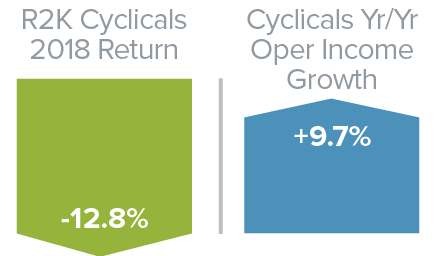
Within these cyclical sectors, especially in the broad industrial and technology spaces, there are diverse industry groups with distinct business cycle dynamics. Each responds to multiple company- or industry-specific factors that help to determine performance as a business—they seldom march in lockstep. That diversity is very attractive to us as selective active managers. So while there’s no question that we were incorrect in thinking that investors would more readily recognize and then close the gap between operating income and stock prices, we think that many small-cap cyclical companies were disproportionately punished in the downturn to the point where many look as if a recession has already been priced in—which makes them even more attractive to us.
Across each of our small-cap strategies, we are confident in our holdings, which generally possess some combination of solid cash flows, modest valuations, effective managements, and encouraging prospects. These are the businesses that look most likely to weather or even thrive in a period with even more volatility and uncertainty than usual.
Article by The Royce Funds

