
The sentiment snapshot series is back! For context, in the sentiment snapshot series I look at some of the charts from the weekly survey on Twitter, which asks respondents to indicate whether they are bullish or bearish for primarily technical or fundamental rationale. I also add a few other charts from time to time when it helps explore a certain theme.
Q4 hedge fund letters, conference, scoops etc

The key takeaways from the weekly sentiment snapshot are:
- Investors appear ‘reluctant bulls’; bullish on technicals, yet bearish on fundamentals
- Bond investors are in agreement on the softening fundamentals, and remain very bullish overall
- A big breakout in bonds could be on the cards in the near term if recent history repeats
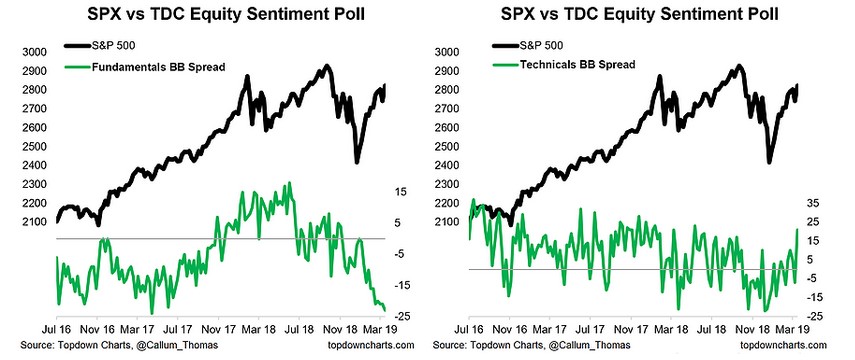
- Fundamentals vs Technicals: The latest results showed “fundamentals” net-bulls at the second-equal lowest reading since the survey began, and yet “technicals” net-bulls at the strongest level since May last year. It’s quite easy to reconcile these two seemingly disparate views… on the one hand investors remain concerned about the fundamentals (softer domestic and global data, weaker earnings pulse, political risks etc), yet on the other hand the price action looks good – as I noted in the Weekly S&P500 ChartStorm, the S&P500 rejected the downside break of the 200-day moving average and closed above the key 2800 mark last week. So people become reluctant bulls.
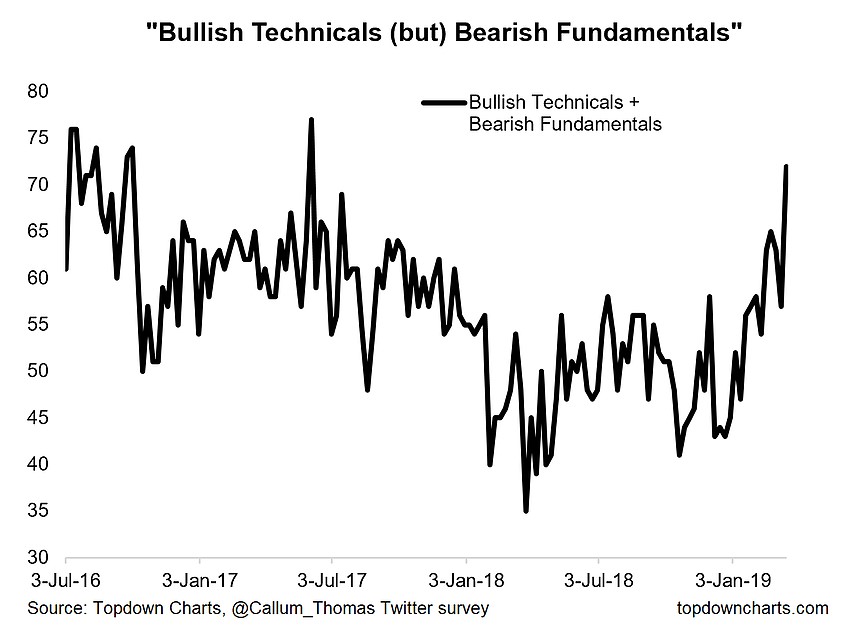
- Bullish Technicals, Bearish Fundamentals: Staying with that theme, this chart shows a series which combines the Bullish (Technicals) + Bearish (Fundamentals) responses over time. You can see that it’s at one of the highest readings over the period measured, and it’s very much reminiscent of the sentiment around mid-2016. Much like the current environment, 2015/16 had seen some real softening of global economic data and a minor earnings recession in the US. I think this chart captures really well the challenging backdrop that we’re currently going through.
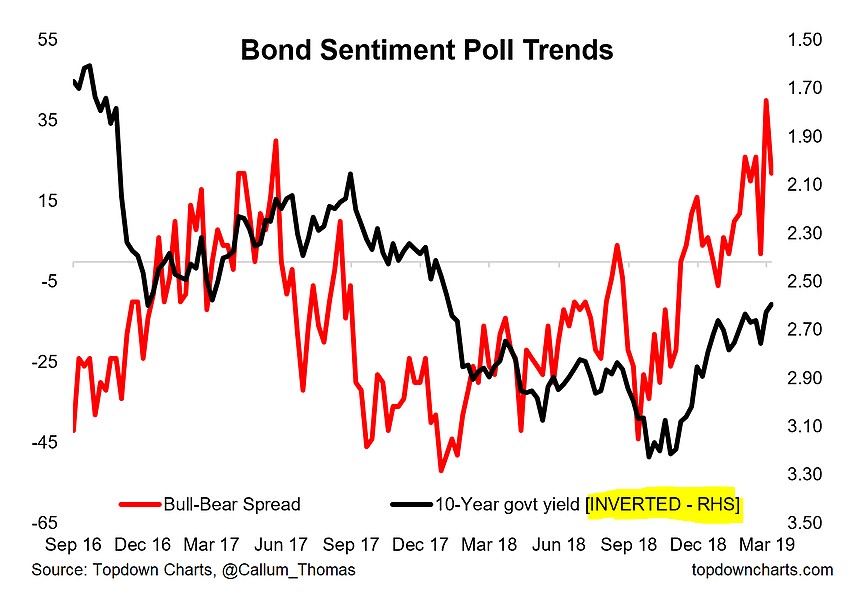
- Bond Sentiment Survey: Over to the bond survey, it’s another week of strong bullishness, albeit sharply reduced from the previous week’s record reading. The interesting thing about the bond survey is that bond net-bulls seem to offer a slight lead on price action (e.g. the lurch to the bearish side in 2017 presaged about a 60bp move higher in yields, while in 2018 a lurch to the bullish side came before about a 50bp drop in yields). So if you took the chart literally it would seem that US 10-Year bond yields are about to break lower and head towards 2% or even lower…
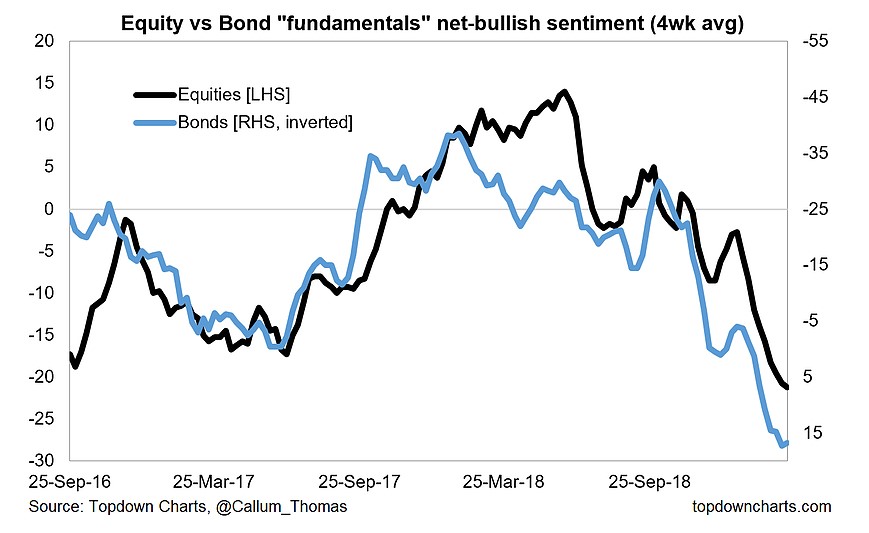
- Fundamentals Sentiment – Equities vs Bonds: One reason bond investors are so bullish is the turn south in fundamentals sentiment. Note: with this chart I have inverted the bond fundamentals net-bulls to align with the economic intuition that what’s good fundamentally for equities (higher growth/inflation) is typically bad fundamentally for bonds. The softening seen here in equities and confirmed in bonds likely reflects the softer data pulse of late. The key for bond yields to break lower will be that this softening in fundamentals sentiment reflects a real and genuine deterioration in the growth/inflation situation.
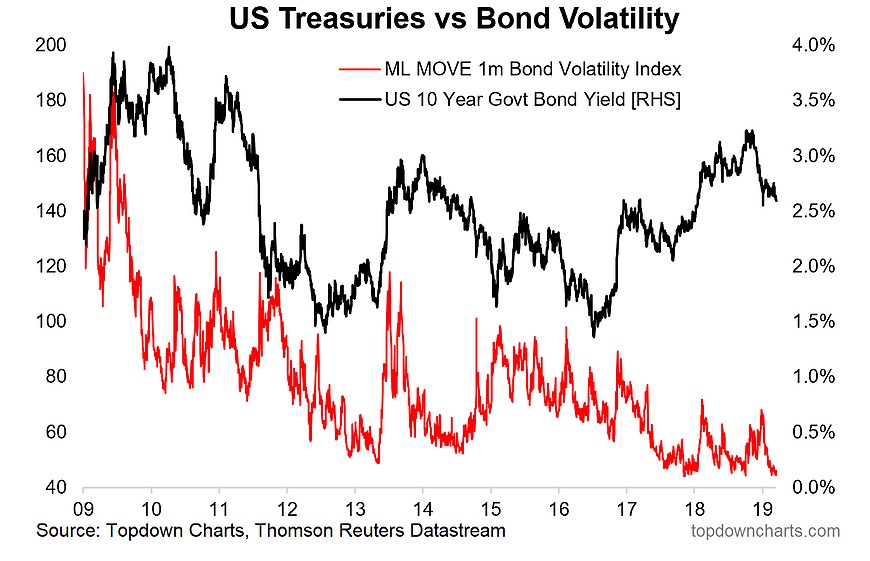
- Treasuries Implied Volatility: I wanted to finish up this week’s snapshot with a look at bond market implied volatility. The Merrill Lynch MOVE Index is approaching record lows once again, and as I’ve often remarked, low volatility is a good predictor of future higher volatility, and a compression in vol like this often precedes a large move. Given the sentiment backdrop I just outlined, it could be that bonds are gearing up for a large move here: if the bond survey is on the money once again it will mean a push lower in yields, but if not then there will be a lot of investors sitting on the bullish side of the boat, and that can create contrarian setups. The Fed meeting this week could be a key catalyst in this respect, particularly as the Fed balance sheet management process (i.e. QT) is coming into focus.
Did you know we offer an institutional multi-asset investment research service? Why not take a free trial for an extra level of insight and service…
Article by Top Down Charts

