
Senior Investment Strategist Steve Lipper analyzes the recent small-cap market through four charts.
Q1 hedge fund letters, conference, scoops etc
What does recent volatility tell us about where we are in the small-cap cycle?
The bearish fourth quarter in small-caps and the strong recovery in the first quarter has really been quite a ride, and so it’s reasonable for investors to say: Well, where are we now, what does Royce think in terms of where we are in the small-cap cycle and what might be coming next?
If you’re looking for more timely hedge fund insight, ValueWalk’s exclusive newsletter Hidden Value Stocks offers exclusive access to under-the-radar value hedge funds and their ideas. Click here to find out more and signup for a free no-obligation trial today.
So first, let’s analyze the first quarter. And we think if you drill down, based on four parameters, a pretty clear picture emerges. The four parameters that we use are: style, then operating income, then dividends, and finally, beta or market sensitivity. In each of those four comparisons, what’s generally viewed as the riskier parameter was the one that was rewarded. So growth stocks outperformed value stocks. Stocks without earnings, without operating income over the last year, what we call ‘non-earners,’ outperformed companies with earnings. Stocks without dividends outperformed stocks with dividends. And stocks with high beta, or high market sensitivity, outperformed those with low sensitivity.
1Q19 Risk–Reward in Small-Caps
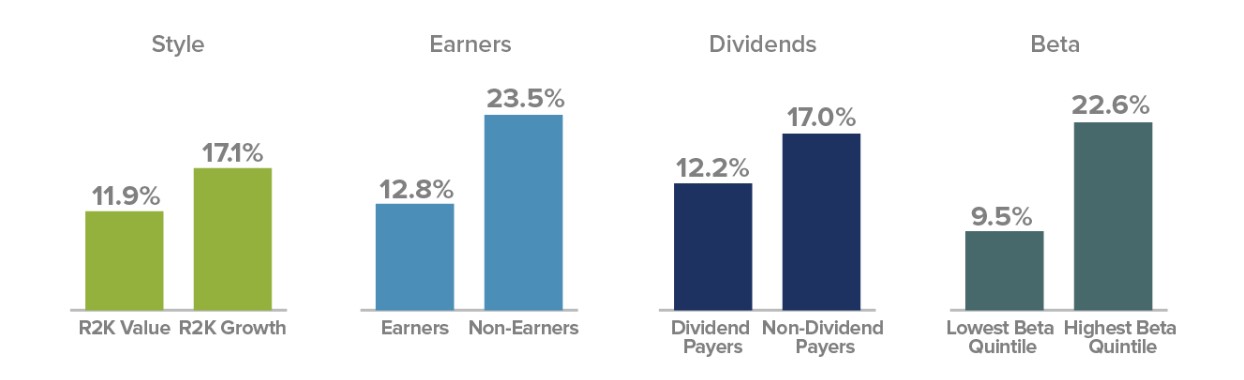
Beta is a measure of a stock’s sensitivity to market movements, with the beta of the market equal to 1.00. A low beta means that a stock’s market-related volatility was low. Trailing 52-week beta vs. the NYSE is calculated and quintiled at the beginning of each quarter.
What does that foreshadow about going forward? Well, given that this seems to be a broad and classically patterned rebound, and it indicates to us we may have further to go.
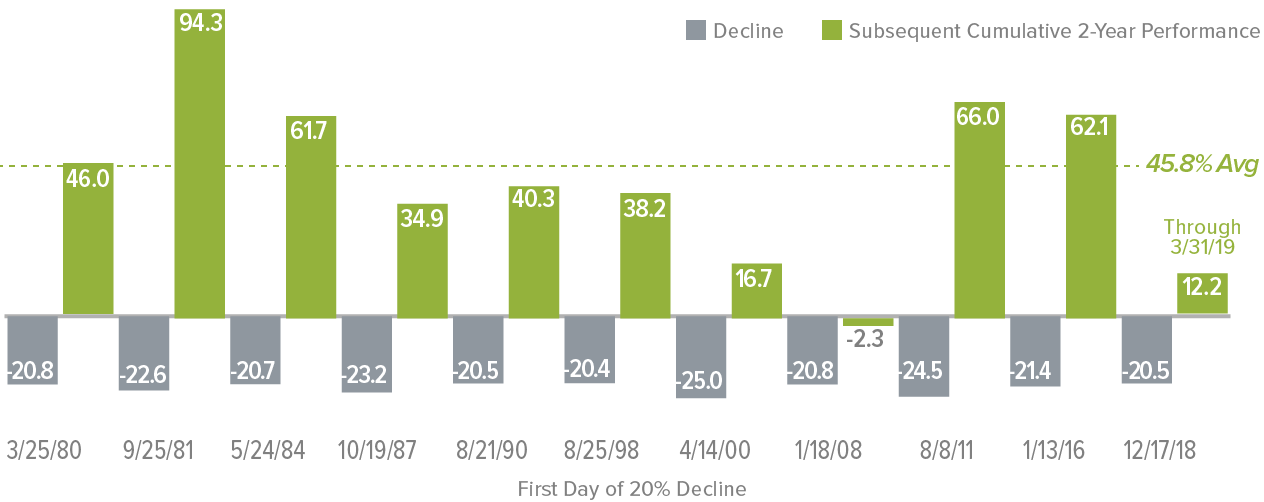
So then the question is sort of how far? And we look to history to give us some guides. So we had over a 20% decline in the second half of last year in small-caps. And there have been 10 times prior to last year where you had a 20% decline, at least, in the small-cap market. What happened next?
Well, in nine of those 10 periods, you had a strong reversal, if you had bought the first day after that 20% decline, you would have made money a year and two years later. The only exception with 2008, 2009, 2010 period. And to be clear, we don’t think we’re in anything like that. But to be more precise about it, if you look on a two-year period, eight of those nine periods of recovery were over a 30% advance. How does that compare to today? Well, if you look at mid-December, which was the period where last year we got to that 20% decline, we only have a small double-digit advance since then.
Does the Small-Cap Recovery Have Room to Run?
Subsequent Cumulative 2-Year Russell 2000 Returns Following Declines of ≥20% from 12/31/78 through 3/31/19 (%)
This also is confirming evidence to us that we think it’s more likely the small-cap market has room to run. What do we think would lead? And in a word, ‘cyclicals.’ Our reasoning for this is twofold: the first is around valuation. Now, our preferred valuation metric at Royce is something called ‘enterprise value to earnings before interest and taxes,’ or EV to EBIT. It’s really analogous to P/E ratio that’s more common, but we think it’s more robust in that it includes the debt the company has.
So what does that metric tell us about cyclicals? Well, if you look over the last 20 years and the relative valuations from cyclicals to the rest of the small-cap market. Cyclicals today sell at a cheaper relative valuation than they did in the fall of 2008. And recall, that was a period where people were actively talking about a repeat of the Great Depression.
Small-Cap Cyclicals are Relatively Cheaper than in 2008
Russell 2000 Relative Median EV/EBIT (Ex Negative EBIT) From 3/31/99 to 3/31/19
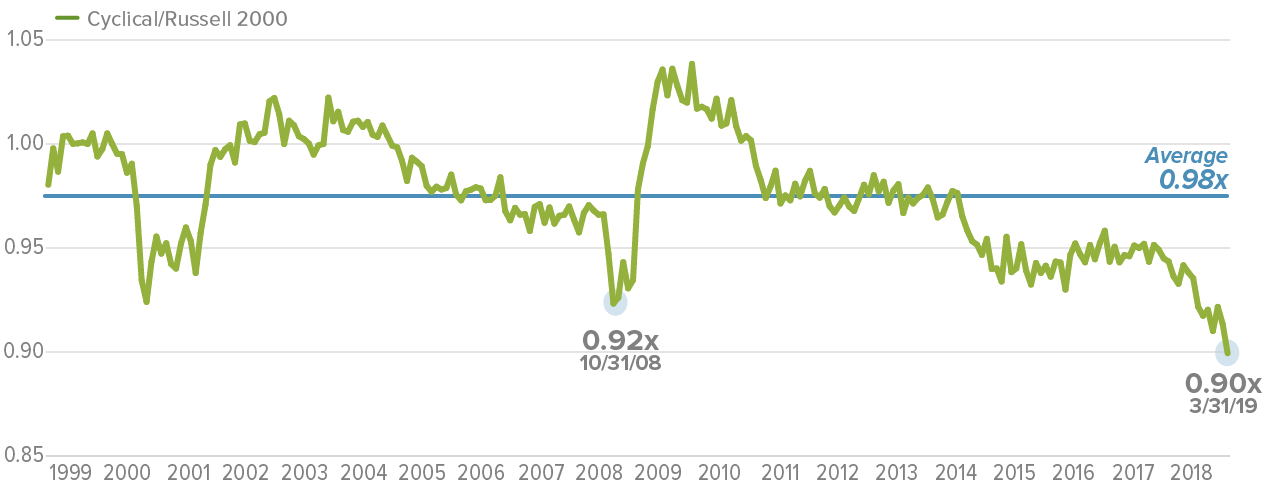
Cyclical sectors: Consumer Discretionary, Energy, Financials, Industrials, Information Technology, Materials
We don’t think we’re in anything like that situation now. But that relative valuation gives some insight into how much pessimism and negative investor sentiment is reflected in current valuations of cyclicals. We think that creates opportunity. What’s the second reason we’re optimistic? We, in the first quarter, began to see the signs that other investors are beginning to seize this opportunity. There were four specific cyclical industries that notably outperformed the overall small-cap market, even during a time where people were still discussing the possibility of recession or concerns about the global economy.
Those four industries were: road and rail, which is essentially sort of the trucking and transport industry; semiconductor and semiconductor cap equipment; chemicals; and electronic equipment, instrumentation & components. All four of those are classic cyclical industries whose outperformance suggests some optimism that is counter to what the headline and general sentiment is.
Positive Signs for Cyclicals
1Q19 Relative Outperformance for Key Cyclical Industries in Russell 2000 as of 3/31/19
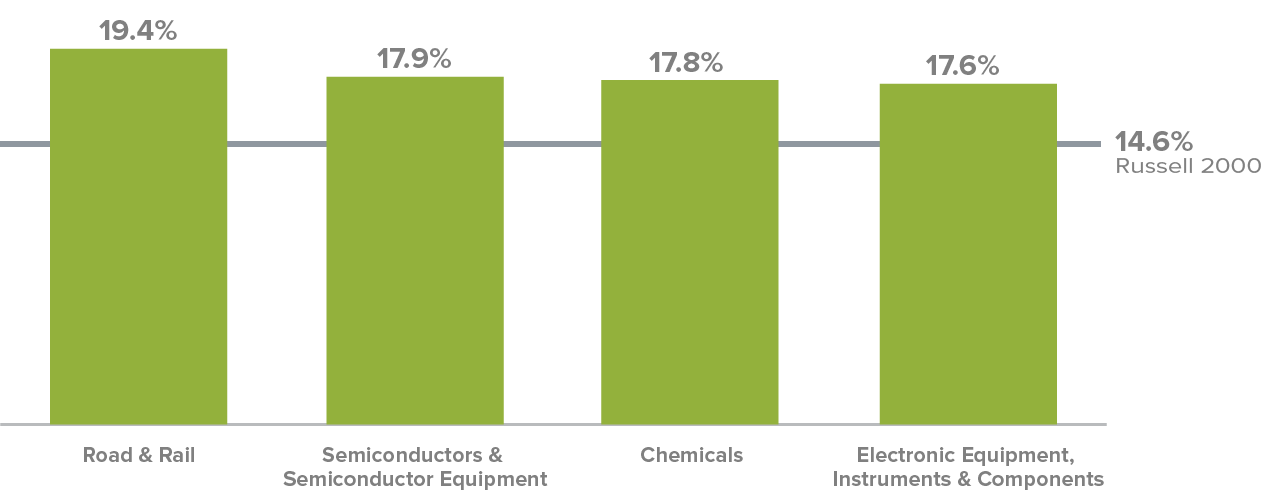
Cyclical sectors: Consumer Discretionary, Energy, Financials, Industrials, Information Technology, Materials
So when we here at Royce see what we think is attractive fundamentals, based on our own research, attractive valuation, and relative market strength, we tend to think that’s an opportunity. Many of our portfolios have significant investments in these areas. In sum, what’s the Royce outlook? We think this rally has room to run, and we think it’ll be led by cyclicals.
Article by The Royce Funds

