
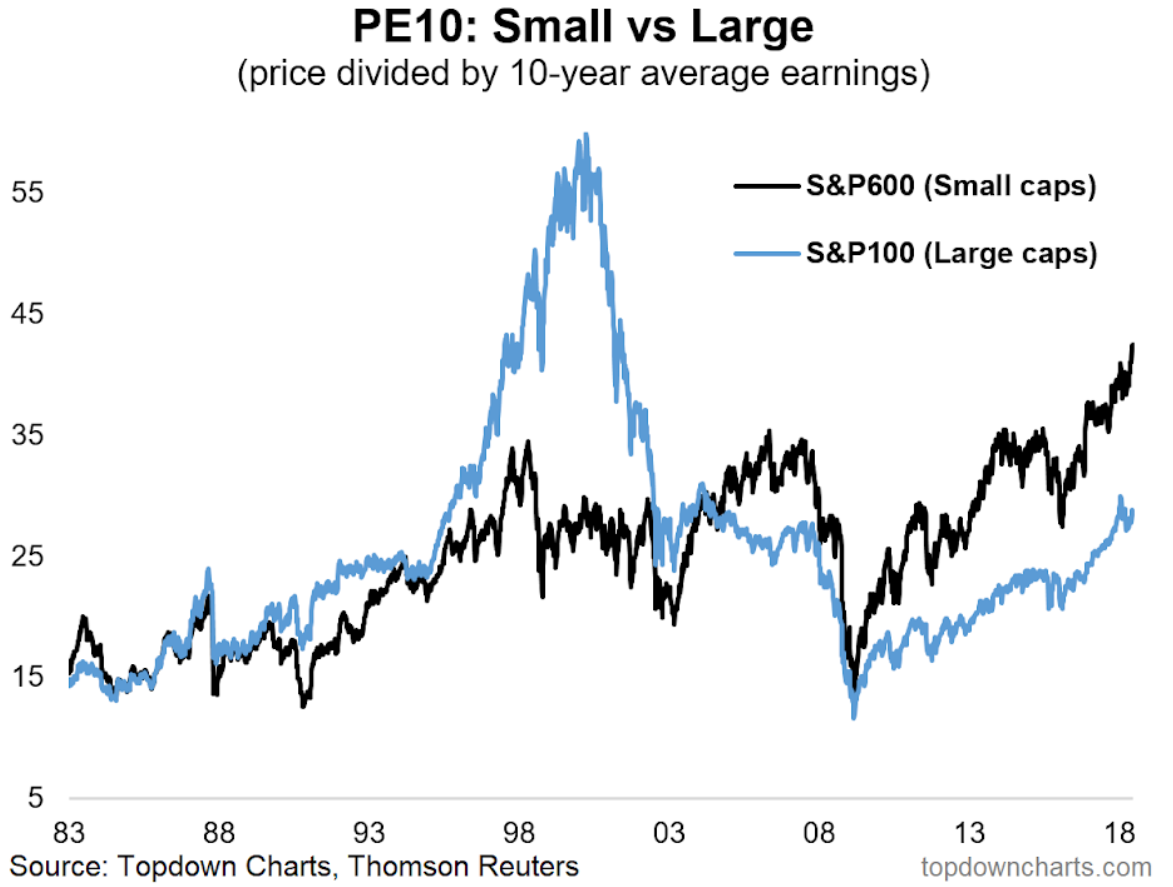
Starting the week off with a long term look at the small end of the market, this chart shows the PE10 Valuation metric (price vs trailing 10 year average earnings) for the S&P600 (small cap stocks) vs the S&P100 (large cap stocks). The chart comes from the latest weekly report where we discussed the outlook for US small cap stocks following the stellar run this corner of the market has had. The key point with this chart is that US small cap stocks are trading at the most expensive valuations on record (and materially higher vs large caps). It seems like last year everyone was worried about the level of valuations for the S&P500, and my sense is those concerns have given way to a host of other policy and politics problems. However, for long term investors it’s important not to lose sight of valuations as an anchor within a broader investment process, particularly when valuations (or any indicator for that matter) reaches an extreme. And at this point US small cap stock valuations are indeed trading at an extreme.

Looking for deeper insights?Try taking a free trial of our institutional research service

