
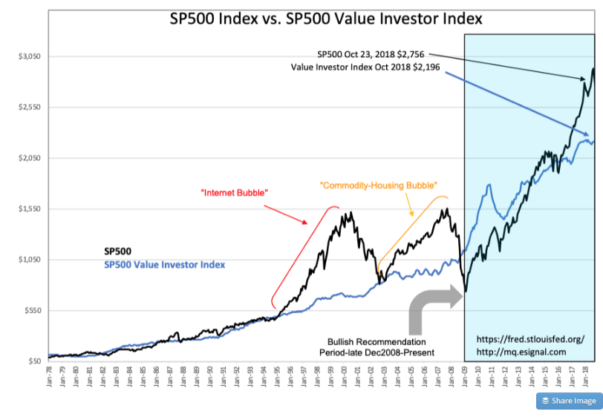
Been seeing this “bubble” junk being tossed around again recently. I’m guessing it probably more for page views than people honestly thinking we are in a bubble. So, I asked Davidson to take a look for us all. The bottom line, for the S&P 500 to be in a “bubble” phase like the Housing and Internet bubbles of yore, we’d be looking at levels of 4,000-4,500 on the S&P at this point.
Q3 hedge fund letters, conference, scoops etc
“Davidson” submits:
The SP500 Investor Value Index is a fundamental market valuation indicator. It is based on Knut Wicksell’s 1898 concept of the “Natural Rate”. Wicksell was an astute observer of market and economics and concluded that societies have an economic growth rate which he called the Natural Rate, but markets, driven by market psychology, experienced valuations above and below this long-term earnings capitalization rate as earnings cycle with economic cycles. He theorized that over multiple cycles, market valuations averaged to this rate applied to the long-term trend of earnings.
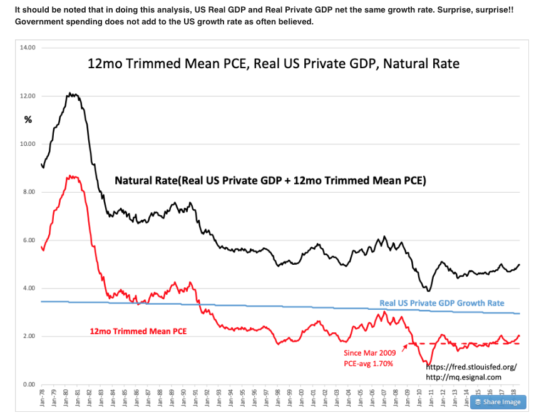
In constructing today’s version of Wicksell’s concept, we have access to historical economic measures from 1947 to Present which were not available to Wicksell. The Natural Rate for the US is the rate of growth of the US economy. One would think one could use Real GDP, but this would lead us astray. US Real GDP as originally constructed includes Real Government Expenditure&Investment. Govt Exp&Inv rises and falls with periods of government borrowing and spending and skews the underlying measure of business activity called the Real Private GDP. Govt Exp&Inv which was more than 40% of Real GDP in 1951 due to Korean War has gradually diminished as the US economy has grown such that it only represents a little over 17% today. One needs to subtract Real Govt Exp&Inv from Real GDP to remove this effect. It is the Real Private GDP from which government receives the taxes and debt payments to support Govt Exp&Inv. One then calculates the long-term Real Private GDP growth rate and adds back in an inflation measure. In this calculation, the Dallas Fed’s 12mo Trimmed Mean PCE is used. This inflation measure is similar but less volatile than the typical Core Inflation rate which is an inflation measure with food and energy excluded. When one plots the Natural Rate and these 2 components, the Real Private GDP, the BLUE LINE, is smooth. Inflation is the RED LINE and it has varied considerably. Inflation is the cause of nearly all the variability of the Natural Rate. I say ‘nearly all’ because the Real Private GDP has very gradually declined as the US economy has grown larger. In 1947 the US economy which had ~4% Real Private GDP, is now ~3% as the Real US economy has grown by a factor of 10x.
It should be noted that in doing this analysis, US Real GDP and Real Private GDP net the same growth rate. Surprise, surprise!! Government spending does not add to the US growth rate as often believed.
When calculating the SP500 Value Investor Index, the Natural Rate is used to capitalize the mean SP500 earnings trend, i.e. the mean SP500 earnings trend takes out the earnings cycles which is then divided by the Natural Rate(capitalized), which produces the price index called the SP500 Value Index. It called the Value Investor Index because when the SP500 declines to be in the range of its Value Investor Index, Value Investors indicate they recognize value in equities. The SP500 Value Investor Index is a helpful measure of market recession lows.
Today, the SP500 is ~25% higher than its Value Investor Index. The last 2 market peaks reflecting speculative excess saw the SP500 have much higher premiums, more than 100% in 2000 and ~65% in 2007. Today’s level does not reflect euphoric speculation. While the Value Investor Index cannot be used to indicate how close we are to a market top (bottoms only), it does provide a rough level of market excess. The best measure of a pending market top is the T-Bill/10yr Treasury rate Spread which even after 9yrs of economic growth is only reflecting a mid-range level indicating up to several more years of economic expansion and rising equity prices ahead.
If the US succeeds in lowering global tariffs as it has thus far succeeded with Mexico and Canada, economic expansion could continue for another 5yrs with low inflation.

