
As investors pore over multitudes of data and factors, exploring lofty valuation metrics, swings in investor sentiment, trends and technicals, earnings and economics, one interesting aspect is that of seasonality. Economists and laypersons alike are profoundly aware of the impact of the physical seasons on activity and behavior. And sure enough, even the stock market appears to go through seasons of better and worse performance through the year.
I highlight this now because we are in the middle of one of the strongest positive seasonal periods of the year, historically speaking. Aside from November and December, March and April historically have been some of the best performing months in the market. The same can not be said of the proceeding May-October period, which tends to be the worst.
So with uncertainty on the market outlook lingering as the global monetary policy tides turn, political risk remains elevated, and the business cycle matures, it could well be that we get a couple more months of decent returns as kind of last gasp before the malaise of “sell in May” sets in.
The salient snippets on seasonality are:
-The S&P500 typically experiences strong positive seasonality about now.
-However this is usually followed by a more subdued period in the months of May through October.
-As the business cycle matures and monetary policy turns from tailwind to headwind, the broad seasonal pattern of short-term strength and medium-term malaise could be reinforced by the background macro currents.
1. S&P500 YTD vs Historical Seasonal Pattern: With a few notable bumps in the road, both ways, the S&P500 still appears to be roughly following the historical seasonal pattern. As always, the seasonality disclaimer holds: seasonality doesn’t always work (as the table below shows), and is best used alongside a broader investment thesis. That said, if the seasonal pattern holds as normal, we should expect a couple more months of upside, before the “sell in May” doldrums kicks in.

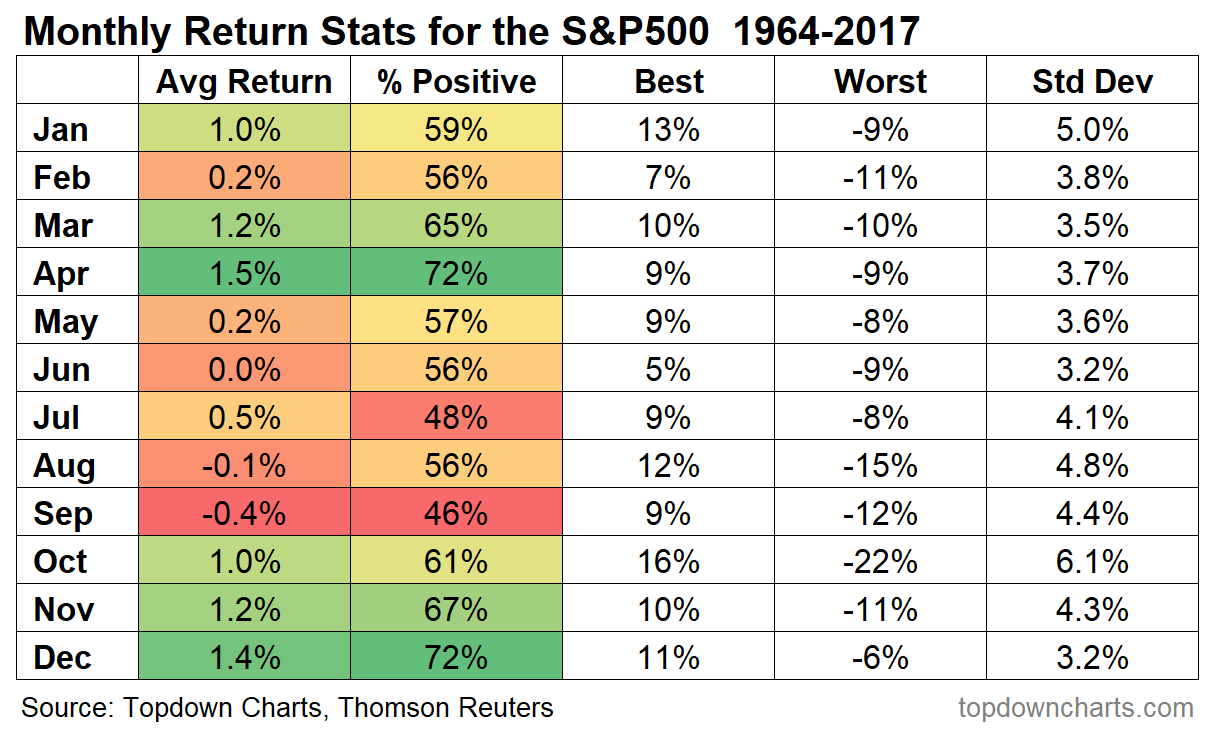
2. S&P500 Monthly Seasonality Statistics: As alluded to, the table below shows monthly seasonal statistics for the S&P 500 over the last 53 years. You might be interested to know that March is about 3rd-equal on the best performing months (December is second), and April is typically the best performing month, with the highest average return, and at 72%, the highest-equal win ratio (72% of the time returns were positive). But notably, as you can see on the table, the following months are much less to get excited about.
Like what you see? Why not take a free trial of our premium offering for an extra level of service and insight.

