
Key highlights for March 2019:
Q1 hedge fund letters, conference, scoops etc
- The Eurekahedge Hedge Fund Index gained 1.06% in March, bringing its year-to-date return to 4.36% – the strongest Q1 performance of the hedge fund industry since the global financial crisis. Roughly half of the hedge fund managers tracked by Eurekahedge have recovered the losses they suffered last year.
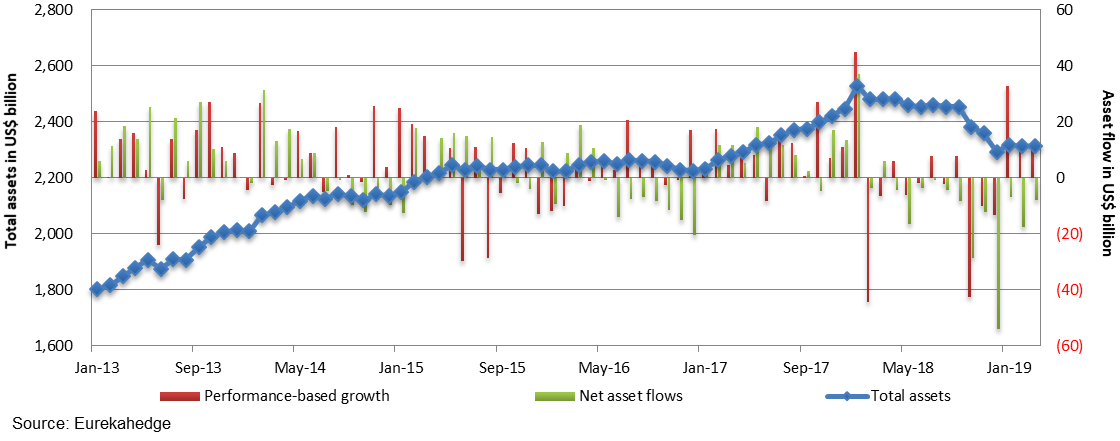
- The global hedge fund industry AUM has grown by US$22.7 billion as of March 2019 year-to-date. Redemption pressure eases as quarter-on-quarter investor flows from the hedge funds industry dropped by 65.9%. Investors redeemed US$32.3 billion in Q1 2019, compared to US$94.7 billion in Q4 2018.
- The Eurekahedge CTA/Managed Futures Hedge Fund Index gained 2.66% in March, supported by the recovering oil prices resulting from OPEC’s production cut and declining US inventory levels. On a year-to-date basis the mandate has returned 2.76%.
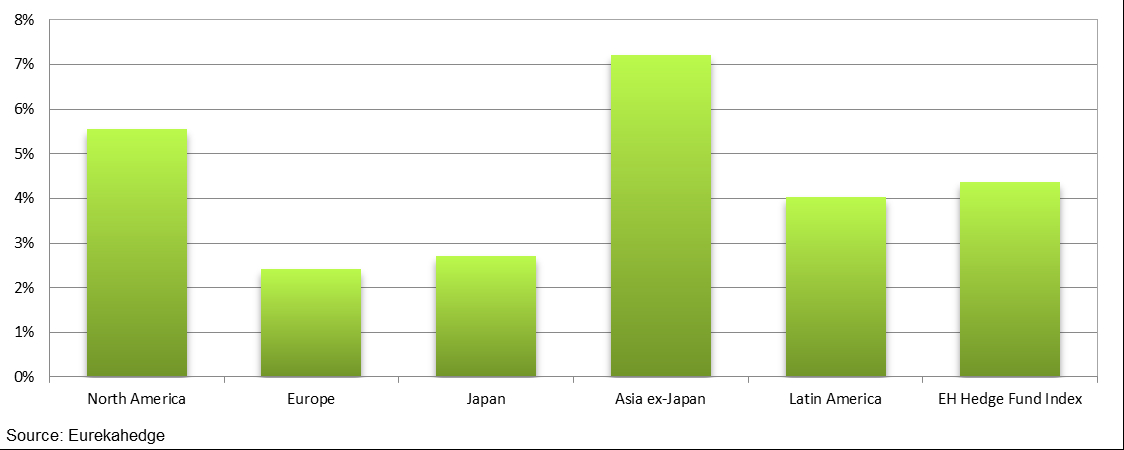
- Hedge fund managers focusing on Asia ex-Japan were up 2.04% in March, with strong returns registered by long/short equities hedge funds in the region. On a year-to-date basis, the Eurekahedge Asia ex Japan Hedge Fund Index has gained 7.21%, supported by the recovery of Asian equity and bond markets in the first quarter of the year. The underlying Greater China and India mandates were up 12.27% and 6.46% respectively as of March 2019 year-to-date.
- North American and European hedge fund managers were up 5.55% and 2.42% respectively as of March 2019 year-to-date, trailing behind their peers focusing on Asia ex-Japan. The Eurekahedge North American Hedge Fund Index and the Eurekahedge European Hedge Fund Index declined 6.19% and 5.12% respectively throughout the fourth quarter of 2018.
- Fund managers utilising AI/machine learning strategies gained 2.59% in March, bringing their year-to-date returns to 3.93%. Quant strategies continued to fall out of investors’ favour, with the CTA/managed futures mandate seeing investor outflows totalling US$7.5 billion as of March 2019 year-to-date, and US$29.0 billion throughout 2018.
- The Eurekahedge Crypto-Currency Hedge Fund Index gained 13.56% in March, bringing their year-to-date return up to 13.78%. Crypto hedge fund managers have successfully outperformed Bitcoin, which was up 8.17% in March and 5.58% throughout the first quarter of 2019.
- The Eurekahedge Custom Asia Top Gainer Composite, an equal-weighted custom index comprising some of the best performing hedge funds focusing on the Asia Pacific region was up 7.77% in 2018, outperforming the Eurekahedge Asian Hedge Fund Index which declined 8.71% over the same period. The index, representing US$13.0 billion of AUM has generated a Sharpe ratio of 2.80 (RFR = 2%) over the last five years, vastly outperforming the average Asian hedge fund and the region’s underlying equity markets. For more on this, refer to the Strategy Profile section of the Eurekahedge April 2019 report.
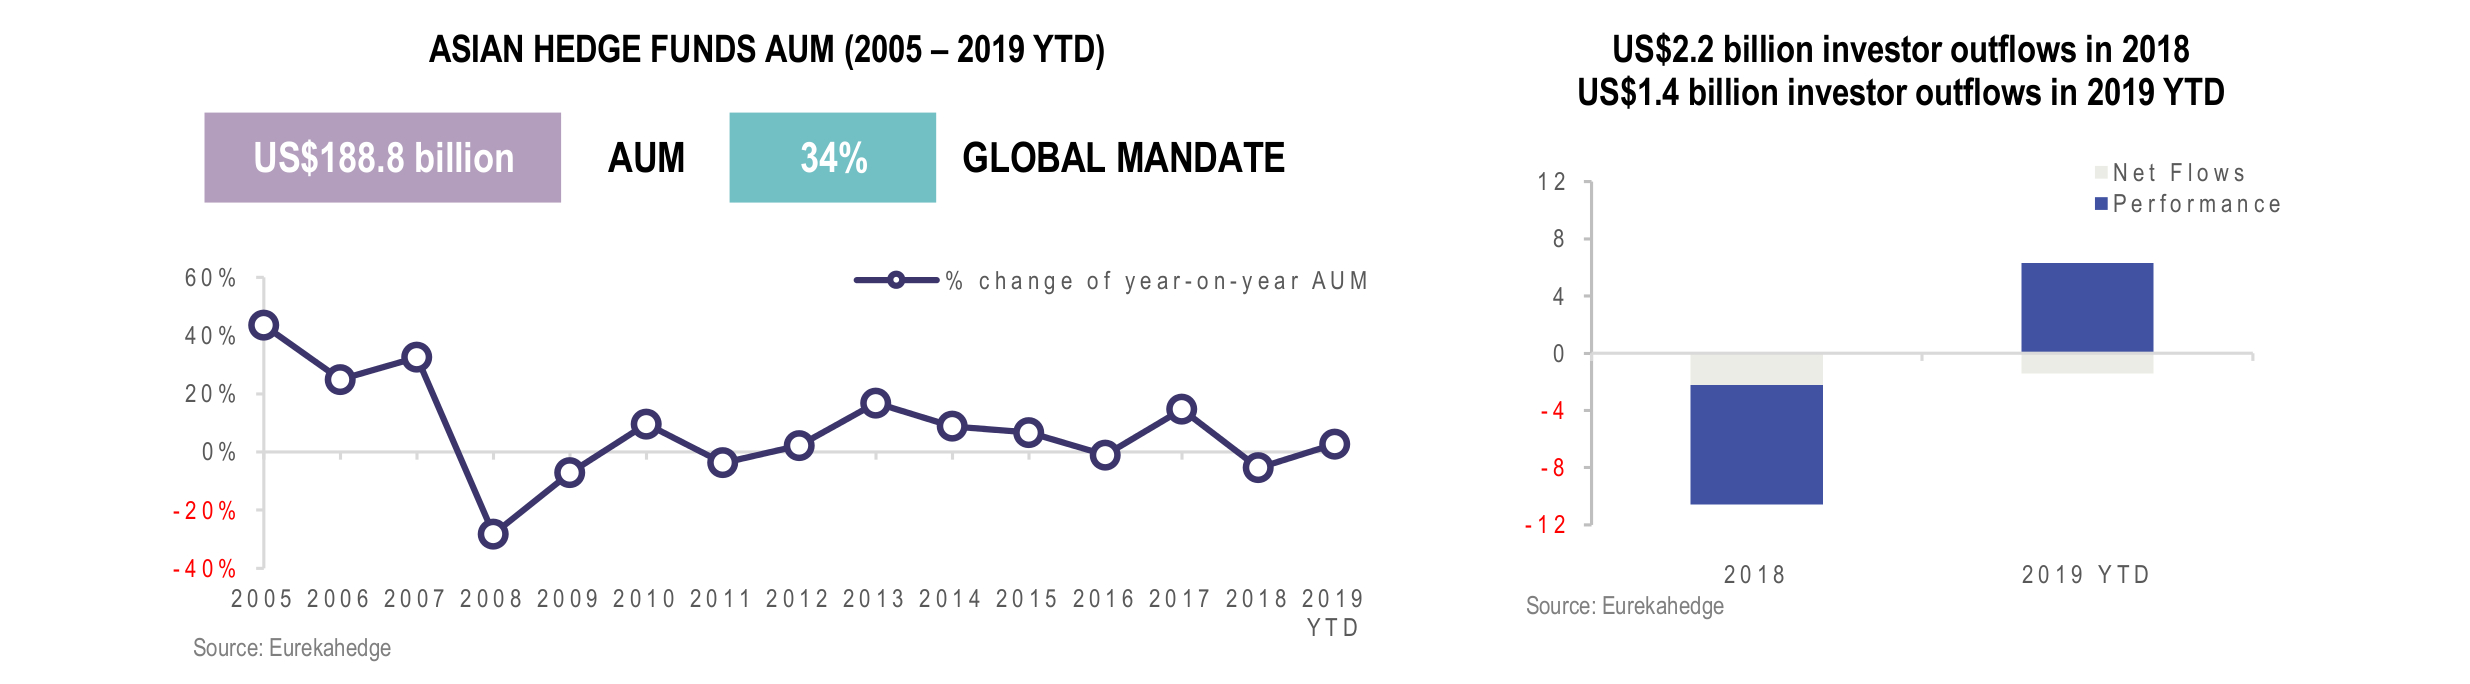
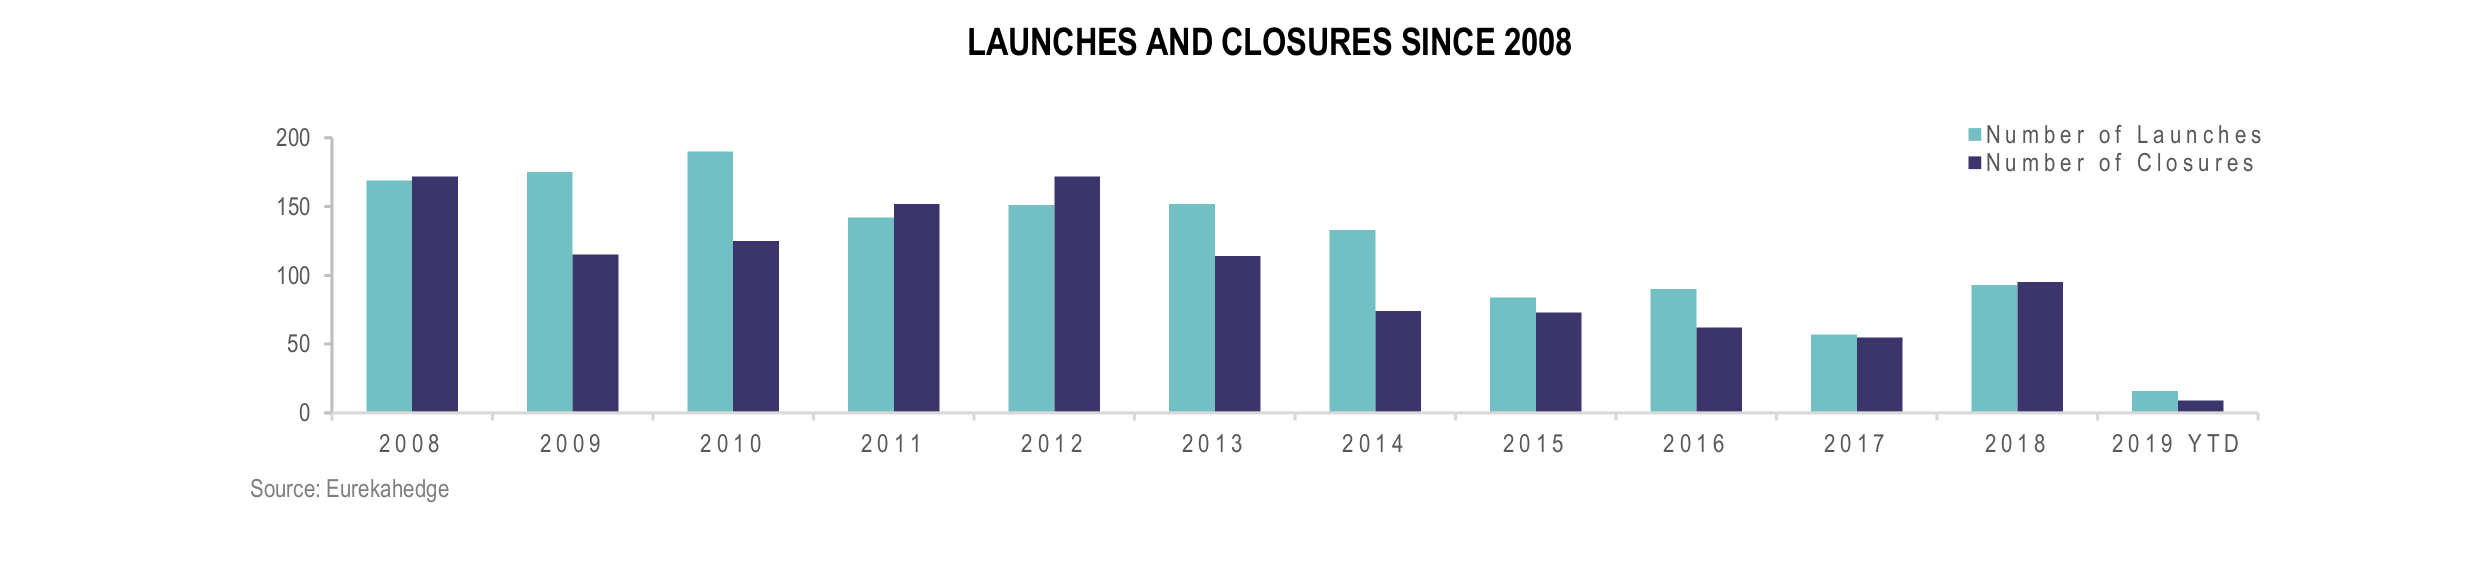
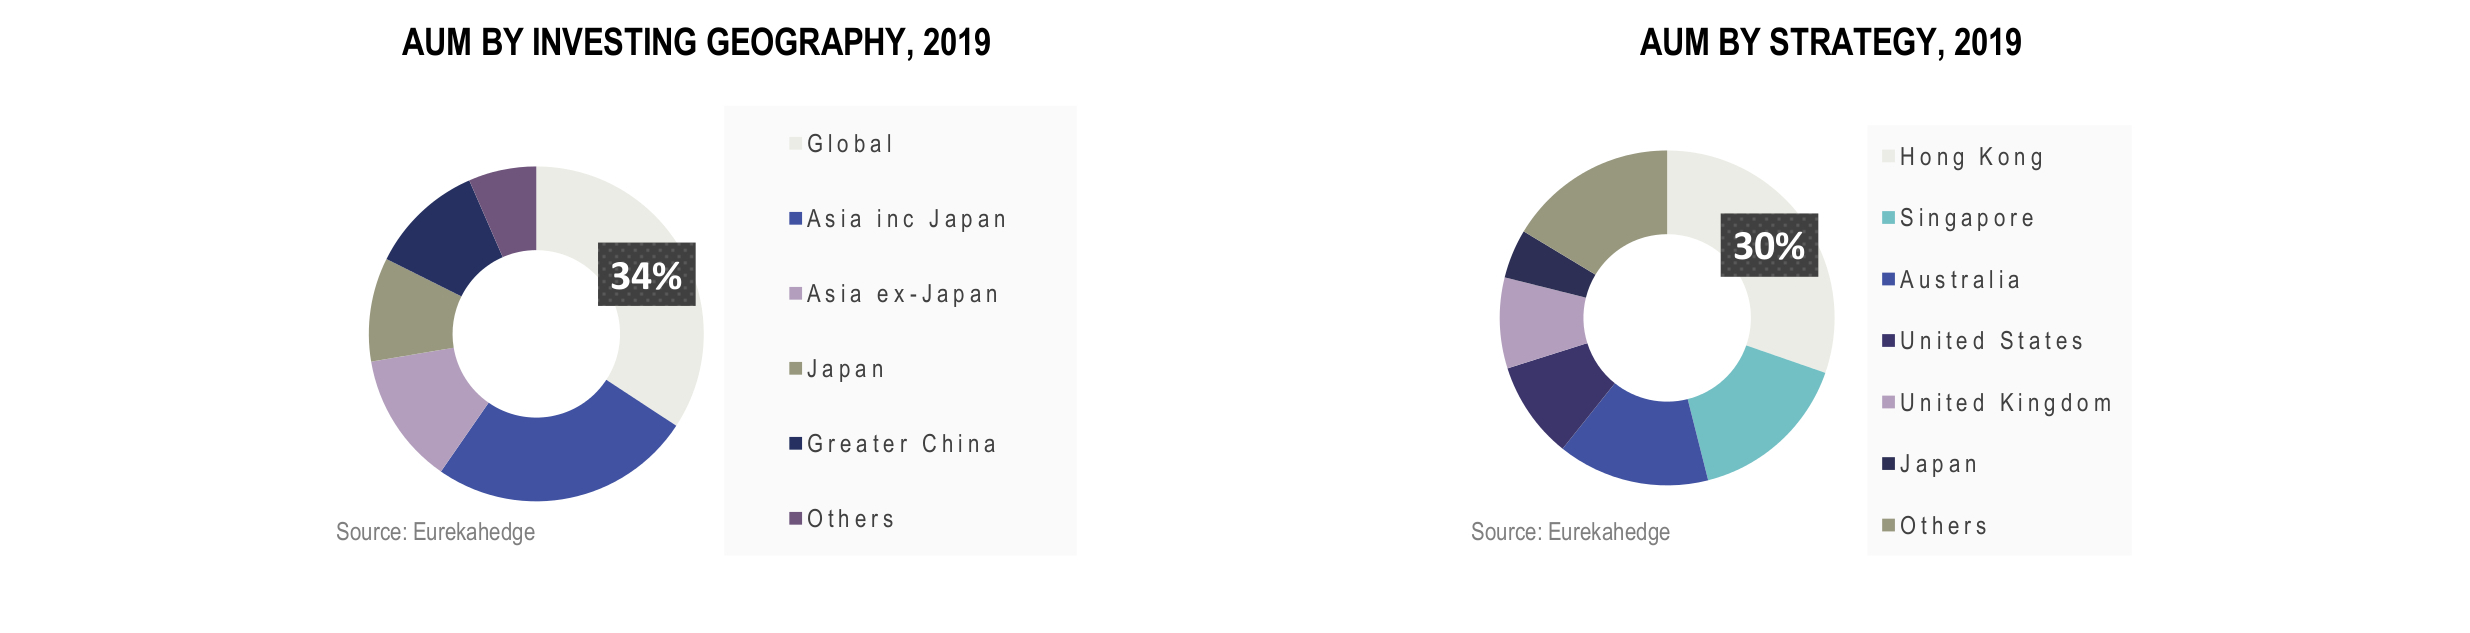
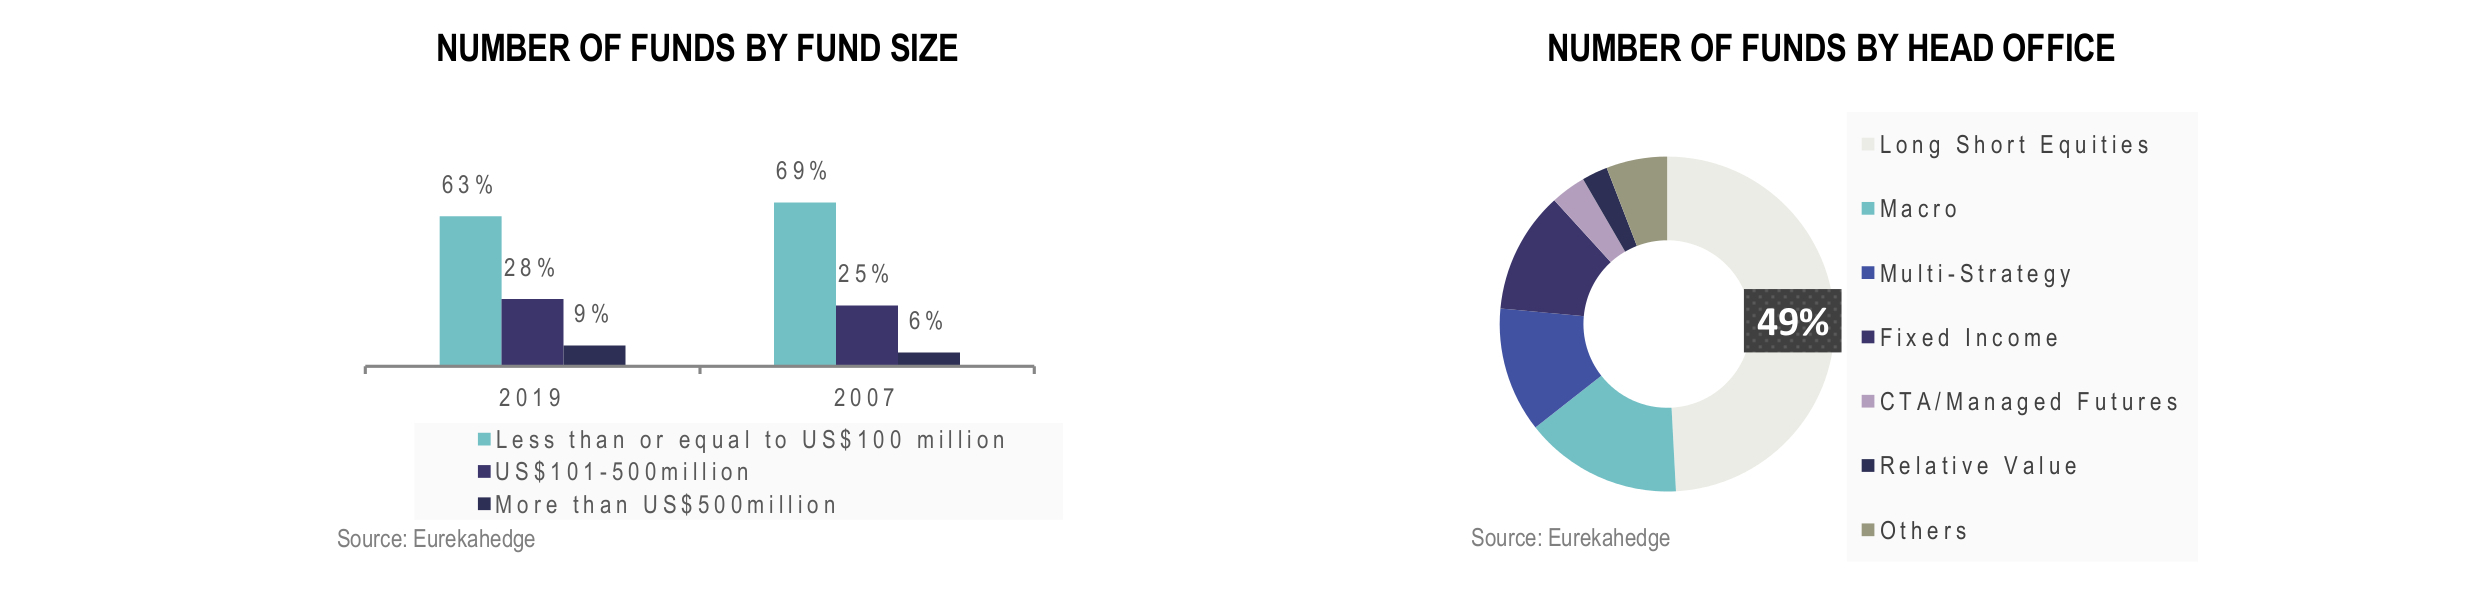
2019 Key Trends in Asian Hedge Funds
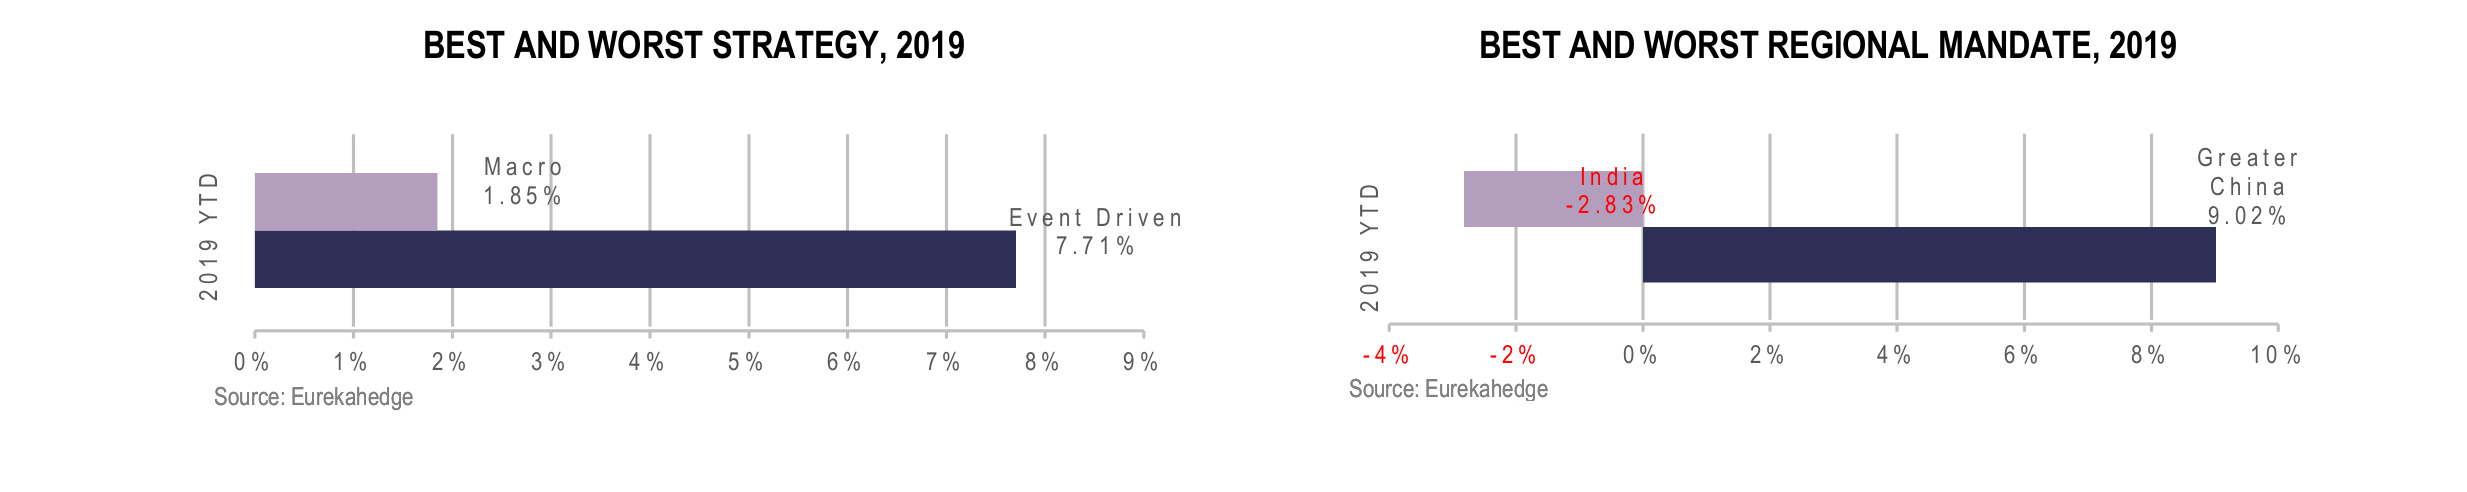
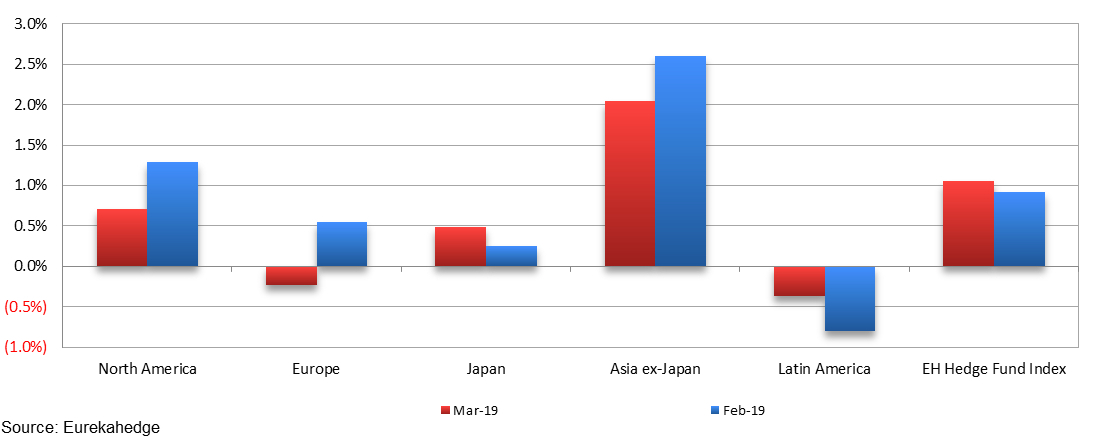
The Eurekahedge Hedge Fund Index gained 1.06% in March, resulting in the strongest post-crisis Q1 return of 4.36%. Hedge fund managers recorded three consecutive months of positive performance, supported by strength in the global equity and bond markets as central banks shy away from tight monetary policies. Optimism over the progress of the US-China trade talks helped bolster the equity markets around the globe, counterbalancing concerns over economic growth slowdown. Hedge fund managers focusing on Asia ex-Japan gained 2.04% over the month, outperforming their North American peers who returned 0.71%. On the other hand, European fund managers were down 0.23% as Brexit uncertainties and growth concerns continued to weigh on the region’s equity markets. The Eurekahedge Greater China Hedge Fund Index was up 12.27% year-to-date as the country’s onshore equity markets recovered from the devastating losses suffered in 2018. Despite that, China’s growth is expected to remain under pressure, potentially necessitating further policy support from the PBOC throughout the year.
Approximately 64.3% of the hedge fund managers tracked by Eurekahedge posted positive returns in March, and 16.3% of them managed to generate double-digit gains year-to-date. Managers utilising CTA/managed futures strategies were up 2.66% in March, with the underlying trend following sub-strategy up 5.05% during the month. Long/short equities hedge funds gained 0.53%, trailing behind the global equity market as represented by the MSCI AC World IMI (Local), which was up 1.09% in March.
March 2019 and February 2019 returns across regions
Looking at year-to-date returns, Asia ex-Japan and North America mandates posted the strongest returns on the back of the respective regions’ equity market performance. The two mandates were up 7.21% and 5.55% respectively as of March 2019. Meanwhile, European funds lagged behind with 2.42% gain year-to-date.
2019 returns across regions
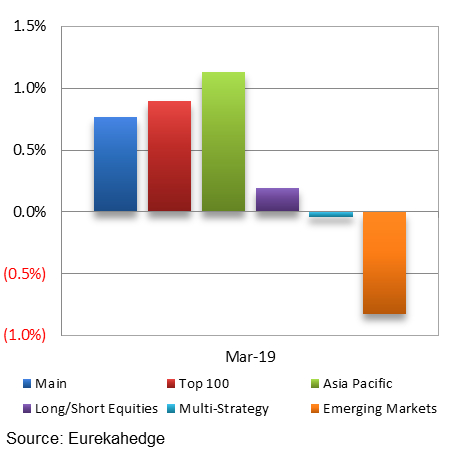
Mizuho-Eurekahedge Asset Weighted Index
The asset-weighted Mizuho-Eurekahedge Index – USD gained 0.77% in March, after ending 2018 down 4.14%. It should also be noted that the Mizuho-Eurekahedge Index is US dollar denominated, and during months of strong US dollar gains, the index results include the currency conversion loss for funds that are denominated in other currencies.
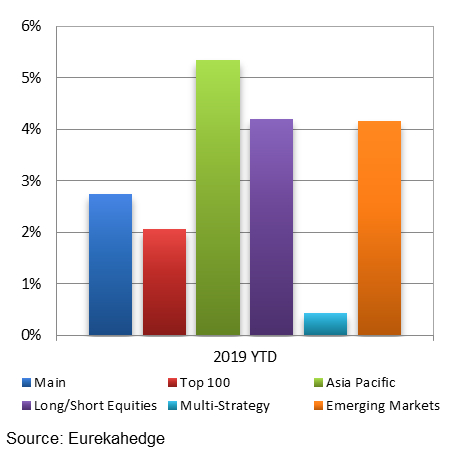
Most of the Mizuho-Eurekahedge indices posted positive returns in February, with the Mizuho-Eurekahedge Asia Pacific Index gaining 1.13% over the month, supported by the strength in the underlying region’s equity markets. In terms of year-to-date return, all Mizuho-Eurekahedge indices were in positive territory, with Asia Pacific and long/short equities managers posting the strongest returns of 5.35% and 4.21% respectively as of March 2019.
| Mizuho-Eurekahedge Indices
March 2019 returns
|
Mizuho-Eurekahedge Indices
2019 year-to-date returns
|
CBOE Eurekahedge Volatility Indexes
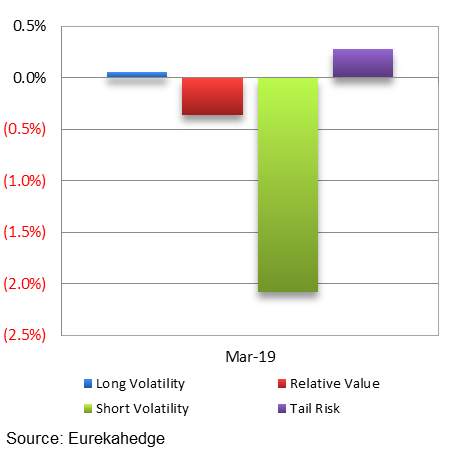
The CBOE Eurekahedge Volatility Indexes comprise four equally-weighted volatility indices – long volatility, short volatility, relative value and tail risk. The CBOE Eurekahedge Long Volatility Index is designed to track the performance of underlying hedge fund managers who take a net long view on implied volatility with a goal of positive absolute return. In contrast, the CBOE Eurekahedge Short Volatility Index tracks the performance of underlying hedge fund managers who take a net short view on implied volatility with a goal of positive absolute return. This strategy often involves the selling of options to take advantage of the discrepancies in current implied volatility versus expectations of subsequent implied or realised volatility. The CBOE Eurekahedge Relative Value Volatility Index on the other hand measures the performance of underlying hedge fund managers that trade relative value or opportunistic volatility strategies. Managers utilising this strategy can pursue long, short or neutral views on volatility with a goal of positive absolute return. Meanwhile, the CBOE Eurekahedge Tail Risk Index tracks the performance of underlying hedge fund managers that specifically seek to achieve capital appreciation during periods of extreme market stress.
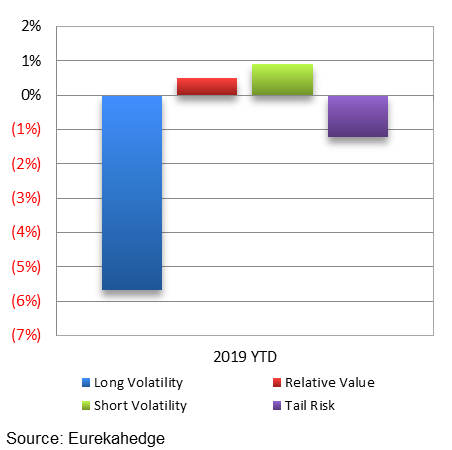
Returns were mixed among the CBOE Eurekahedge indices, with the CBOE Eurekahedge Short Volatility Hedge Fund Index down 2.08% as market volatility spiked up in mid-March when the US treasuries yield curve inverted. Hedge fund managers utilising long volatility strategies gained 0.06% during the month, trailing behind their peers utilising tail risk strategies who returned 0.28% over the month. On a year-to-date basis, long volatility hedge fund managers were down 5.67%.
| CBOE Eurekahedge Volatility Indexes
March 2019 returns
|
CBOE Eurekahedge Volatility Indexes
2019 year-to-date returns
|
Summary monthly asset flow data since January 2013
Eurekahedge
Launched in 2001, Eurekahedge has a proven track record spanning over 16 years as the world’s largest independent data provider and alternative research firm specialising in global hedge fund databases and research. Headquartered in Singapore with offices in New York and Philippines, the global expertise of our research team constantly adapts to industry changes and needs, allowing Eurekahedge to develop and offer a wide array of products and services coveted by institutional investors, family offices, accredited investors, qualified purchasers, financial institutions and media sources. In addition to market-leading hedge fund databases, Eurekahedge’s other business functions include hedge fund research publications, due diligence services, investor services, analytical platforms and risk management tools.

