
Trading costs are a hot topic these days.
The topic has sparked investor attention because of the rise of systematic factor investing strategies available via the ETF structure. It seems as if everyone is a “quant” these days, slinging money around like drunken pirates, destroying the price discovery process along the way.
[timeless]
Q2 hedge fund letters, conference, scoops etc
A popular narrative is the following:
- There is too much capital chasing the same factors
- Frictional costs associated with factor strategies are simply too high to make them profitable after transaction costs.
On #1, we recommend reading this post, which suggests that there is little evidence that factor funds are radically shifting asset prices.
On #2, we’ve addressed the transactions cost debate in fairly great detail in the following pieces:
- Factor investing and trading costs
- Surprise! The Size, Value, and Momentum Anomalies Survive After Trading Costs
But in addition to the pieces above, we recommend you read the paper we are about to discuss. It is seriously a magnum opus on transaction costs.
The summary from our analysis of the research published on the topic is that factor strategies have capacity limits due to transaction costs, but that the capacity on these strategies might be much higher than academics have previously considered. How was that conclusion reached? Simple: practitioners have better data that can more accurately answer the question than academics.(1)
So what’s new on the topic?
We didn’t really think there was much to add at this point until Cliff Asness highlighted that his team at AQR has been hard at work — yet again!

Source: fintwit
Frazzini, Israel, and Moskowitz, who already have an incredible paper that tackles the question on net-of-cost returns of the well-known asset pricing anomalies, have reframed their original analysis to address the broader question of transaction costs and how their analysis compares to prior work on the subject.
The bottom line up front:
- Trading costs are a lot less than previously estimated.
- The model for transaction costs estimated from the data outperforms other models proposed in the literature.
The Core Differentiation of This Trading Costs Study: Better Data
A huge driver for trading costs is the price impact, especially for larger investors. For example, if I try to buy $1mm worth of stock in a single day when the average daily value traded in $100,000, it is likely that my order will have a major impact on the price. Historically, getting access to data on market impact costs has been difficult. Fortunately, the authors access a unique dataset of over a trillion dollars of live trades from a large institutional money manager. The execution data is available for over 1.7 trillion dollars in trade value covering nearly 10,000 stocks between 1998 and 2016.
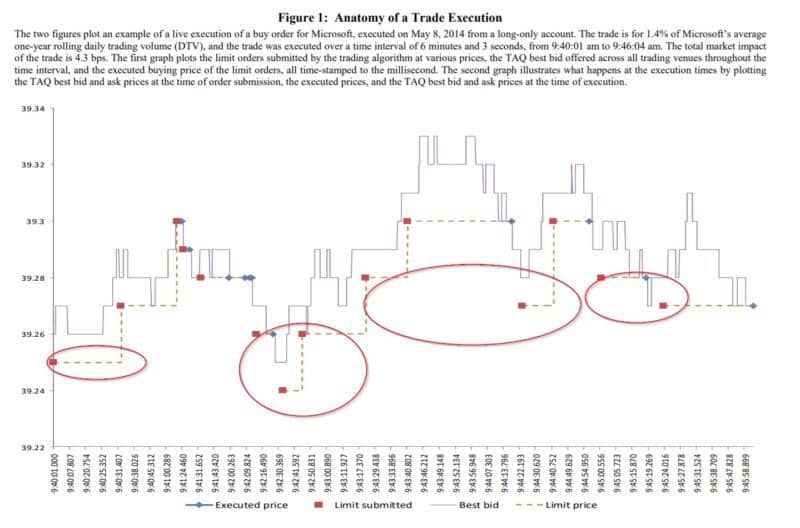
The authors believe that this sample of live trading data can accurately capture the marginal investor’s trading costs with regard to these strategies. The authors also explain that their trading approach is meant to provide liquidity to the market, not be a liquidity taker. In other words, for longer horizon investment strategies the manager chooses to sit near the bid (for buys) and near the ask for sells. An example in the updated paper highlights their approach. Note that the “Limit price” for a buy trade is generally at or below the bid and that executions often take place near the bid (versus the ask).
The results are hypothetical results and are NOT an indicator of future results and do NOT represent returns that any investor actually attained. Indexes are unmanaged, do not reflect management or trading fees, and one cannot invest directly in an index.
The authors highlight an obvious caveat of their study:
One caveat of our data is that we only have costs for one particular investor, albeit a large one, that may not generalize to other investors or other trading strategies not deployed by our manager.
So with that setup in mind and an understanding that the results are applicable to a sophisticated patient trader, we can examine the core results.
Trading Costs May Be A Lot Less Than Previously Thought
The authors describe the methodology for calculating trading costs in this paper. They reconstruct long-short anomaly portfolios following the techniques documented in the literature (e.g., SMB, HML, UMD, etc.) and apply trading costs to these portfolios based on their live trading data.
The chart below maps out the average impact for US trades over a 24 hour period following the initial trade:
The results are hypothetical results and are NOT an indicator of future results and do NOT represent returns that any investor actually attained. Indexes are unmanaged, do not reflect management or trading fees, and one cannot invest directly in an index.
The authors summarize the key finding:
…our estimate of market impact is just under 9 basis points on average for all trades completed within a day. Most (around 85%) of that price impact appears to be permanent, as only 1.26 basis points on average are reversed over the next 24 hours.
The authors also examine the market impact costs across countries. As expected, there are different costs for different countries.
The results are hypothetical results and are NOT an indicator of future results and do NOT represent returns that any investor actually attained. Indexes are unmanaged, do not reflect management or trading fees, and one cannot invest directly in an index.
Later in the paper, the authors identify that the key driver behind market impact cost heterogeneity(2) is the size of the trade as a fraction of daily volume traded (which makes sense!).
The results are hypothetical results and are NOT an indicator of future results and do NOT represent returns that any investor actually attained. Indexes are unmanaged, do not reflect management or trading fees, and one cannot invest directly in an index.
The key takeaway is that the transaction cost estimates are much lower than previously identified by academic researchers using “TAQ” data:
In particular, the linear cost models employed by Korajczyk and Sadka (2004), Lesmond, Schill, and Zhou (2003), and Novy-Marx and Velikov (2017) imply trading costs that are an order of magnitude
larger than our model or live costs suggest.
The best way to “see” this result is via Figure 7, which compares the author’s estimates (“FIM 2017”) against TAQ estimates:
The results are hypothetical results and are NOT an indicator of future results and do NOT represent returns that any investor actually attained. Indexes are unmanaged, do not reflect management or trading fees, and one cannot invest directly in an index.
The best way to benchmark the “believability” of the various approaches is to see how the techniques estimate the costs of trading known index portfolios. Here are the estimated costs to trade several well-known index portfolios (S&P 500 and the Russell 2000):
The results are hypothetical results and are NOT an indicator of future results and do NOT represent returns that any investor actually attained. Indexes are unmanaged, do not reflect management or trading fees, and one cannot invest directly in an index.
And here is the visual version for those who are number-challenged:
The results are hypothetical results and are NOT an indicator of future results and do NOT represent returns that any investor actually attained. Indexes are unmanaged, do not reflect management or trading fees, and one cannot invest directly in an index.
The approaches based on TAQ data are all multiples of the actual ETF costs incurred to trade these indexes, whereas the model using the calibrated version based on data from the paper (labeled “Trade data, FIM”) generate a near perfect result. Clearly, the authors have identified a better empirical approach to estimating transaction costs.
This Trading Costs Paper is Simply Mind Blowing
The discussion above is merely meant to highlight some of the wavetops. But this 88 paper digs deep on so many important issues for investors/traders. I highly recommend you read the entire body of work. Incredible insights on building better pre-trade models, understanding transaction costs, and really shedding light on an aspect of the market that has simply been out of reach for academic researchers in the past.
Bravo.
Trading Costs
- Frazzini, Israel, and Moskowitz
- A version of the paper can be found here.
- Want a summary of academic papers with alpha? Check out our Academic Research Recap Category.
Abstract:
Using 1.7 trillion dollars of live trade execution data from a large institutional money manager across 21 developed equity markets over a 19-year period, we measure the real-world trading costs and price impact function of a large trader. We provide a novel description of how costs vary across trade type, stock characteristics, trade size, time, and exchanges globally to test various theories of price impact. We find actual trading costs to be an order of magnitude smaller than previous studies suggest, and describe the tradingprocess leading to these costs. A model calibrated to match the distribution of actual costs across trade size, stocks, and time outperforms other models from the literature in out of sample tests that attempt to describe independent costs from brokers and realized costs of traded index funds. Our model based on realized costsfrom live trades portrays very different implementation costs than previous studies suggest.
- The views and opinions expressed herein are those of the author and do not necessarily reflect the views of Alpha Architect, its affiliates or its employees. Our full disclosures are available here. Definitions of common statistics used in our analysis are available here (towards the bottom).
- Join thousands of other readers and subscribe to our blog.
- This site provides NO information on our value ETFs or our momentum ETFs. Please refer to this site.
References
- There is always a concern that practitioners have a conflict of interest when presenting findings that go in their favor. There is no way to completely eliminate this criticism except to say that practitioners are heavily incentivized to maintain a brand/reputation, which might counteract their conflict of interests.
- a five dollar word for different characteristics across different observations that academics love
The post “The Best Research Paper Ever Written on Trading Costs” appeared first on Alpha Architect.

