
“The economy is a collection of emotions.” – Kenneth Langone
Q1 hedge fund letters, conference, scoops etc
Speaking to first-year NYU medical students, Kenneth G. Langone and his wife, Elaine, stepped to the podium. Their announcement shook the room. “From this point on, NYU Medical School is tuition-free for all students,” they said. “The students and their parents were first stunned and then erupted in joy,” Ken said in a 60 Minutes interview aired last Sunday. “And these kids went nuts. One father yelled out, ‘I told you that you picked the right place!’”
Ken and Elaine Langone donated $100 million to NYU School of Medicine and helped raise an additional $350 million to make attendance free of charge for every medical student. I tuned in to listen to the Ray Dalio interview but what lifted me most was the piece on the Langone’s donation. More than 10 years of thoughtful planning went into the design of the program. It is a story about unprecedented debt and it’s a story about making the world a better place.
Langone said, “When we announced it, a mother, a pediatrician, came up to me, 30 years out of medical school, and she told me she was still paying off her medical school debt. She said, ‘This morning when I woke up and I knew I was coming here, I was convinced I would be in debt when I died to help my son become a doctor.’ These are great people. So, we just said, ‘You know what? Let’s do what we can to help make it easier for them.’”
And this is the part that lifted my heart the most. Ken said, “I think about the mindset of a kid saying somebody did something for me. Now, I’ve got to do something for somebody. Okay? Think of that… That, one day, if you’re dealing with a patient who can’t afford to have something done, you might say, ‘It’s on me.’ Pass it on.”
Ken Langone is an American businessman, who made an early investment in and became a co-founder of The Home Depot. He has an estimated net worth of $3.4 billion, as of February 2018 according to Forbes. Langone grew up in a working-class neighborhood near New York City. His father was a plumber and his mother a cafeteria worker. Langone’s family has been described as having “a lot of love, but not a lot of money.” As a student at Bucknell University, Langone worked various jobs: a butcher’s assistant, a caddy and a ditch digger. After graduation, Langone headed to Manhattan where he attended NYU Stern School of Business at night while working full-time during the day. The American dream… Do good, pay it forward.
You can watch the 13-minute special here.
Long-term Debt Cycle
Few have studied the history of debt more than Ray Dalio. If you are not familiar with Ray Dalio, he is one of the most successful investors of all time. He predicted the 2008 financial crisis and he sees a prolonged period of sluggish economic growth and he is worried about the threat of a confrontation between the U.S. and China. One of his biggest concerns is how global economic conditions are creating a growing divide between the haves and have-nots. He says, “If you look at history and you have a group of people who have very different economic conditions and you have an economic downturn, you have conflict. In the ’30s, for example, you had four major countries that were democracies that chose not to be democracies because they wanted leadership to bring order to the conflict. I’m not saying we’re going to go there. I’m saying that right now it’s a huge issue; it’s unfair and, at the same time, it’s unproductive and, at the same time, it threatens to split us.”
Ray has written a great deal about long-term debt cycles. Managing $160 billion in a global macro go-anywhere strategy, his hedge fund has been profitable in 25 of the last 28 years. His firm’s success is driven by their understanding of how economies work and positioning to profit. Debt plays a significant role in an economy’s expansions and contractions. His fund can bet up or down to profit. The big message today is that we sit at the end of a long-term debt cycle. They happen every 75 to 100 years and few of us has ever seen one. The last was in the mid-1930s.
Ray believes we are in the endgame of the current cycle and that the debt will de-lever and the outcome, our path ahead over the next decade, may be “beautiful” or “ugly.” Asked about the probabilities, he puts the odds for “beautiful” at 35% and “ugly” at 65%. Ultimately, we just don’t yet know as it depends on leadership… our elected officials, central bankers and you and me. The 60 Minutes interview with Dalio didn’t disappoint. You may not agree with everything he says, but it will get you thinking… and wait until you see his underwater submarine. You can find the full interview here.
We sit divided not just in the U.S. but in much of the world. We are generally all happy when our personal economies are good. It’s when it turns that stresses build. We sit late in a long-term debt cycle. I believe this is the most important risk for us to get our heads around. Personally, I think we need more Ken Langones in the room. Unfortunately, “kick the can down the road” likely continues as it is the path of least resistance. Thus, in my view, it is tough to bet against Dalio’s odds.
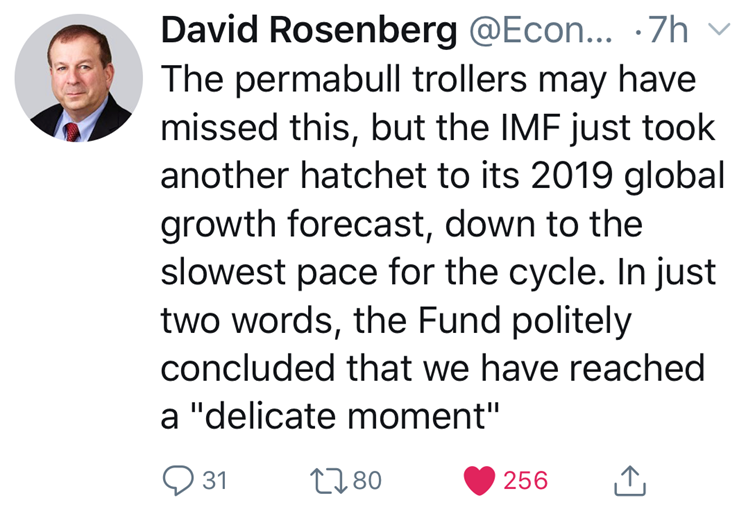
The bottom line is debt is the elephant in the room. It is a drag on growth. To wit: The European Central Bank held interest rates steady Wednesday morning and issued a gloomy outlook. And the day prior, the International Monetary Fund cut its global growth forecast to the lowest since the Great Financial Crisis warning that the world economy is at a “delicate moment.” You can find the IMF report here.
On that good news… Grab that coffee and find your favorite chair. I think the more we can educate our elected representatives, the better our chances for a “beautiful” outcome. In the meantime, stay nimble, alert and mindful that we sit late cycle – risk is high. Today’s piece is about debt. When you read on below, you’ll see that the ratios are staggering.
♦ If you are not signed up to receive my weekly On My Radar e-newsletter, you can subscribe here. ♦
Follow me on Twitter @SBlumenthalCMG
Included in this week’s On My Radar:
- Debt Charts, Deflation and Long-term Debt Cycles
- “Did the Fed Tightening Cycle Ever Get Underway,” by Samuel E. Rines
- Trade Signals – Trend Evidence Remains Moderately Bullish for HY, Equities and FI
- Personal Note – One Last Powder Day
Debt Charts, Deflation and Long-term Debt Cycles
The elephant in the room is debt. Let’s take a look today at just how big it is. You’ll see that it is here, there and everywhere. At the peak of long-term debt cycles, debt is a deflationary drag on growth. The following is from my friends at Ned Davis Research.
One can look at many different categories of debt to try and get a picture of possible problems ahead. Many have looked at public debt as a cause of a financial crisis while we have looked at total credit market debt in the past to warn of secular debt problems. One measure of debt that may be better able to predict an upcoming financial crisis or slower economic growth is private domestic non-financial debt.
The advantages of this measure of debt is that it represents the debt held by the private sector of the economy which is the driver of growth. Unlike government debt, the private sector cannot simply raise revenue through taxes or monetize the debt if it gets too high. Also by not including financial debt, it avoids double counting debt as debt held by financial institutions is used to lend to the household and business sectors.
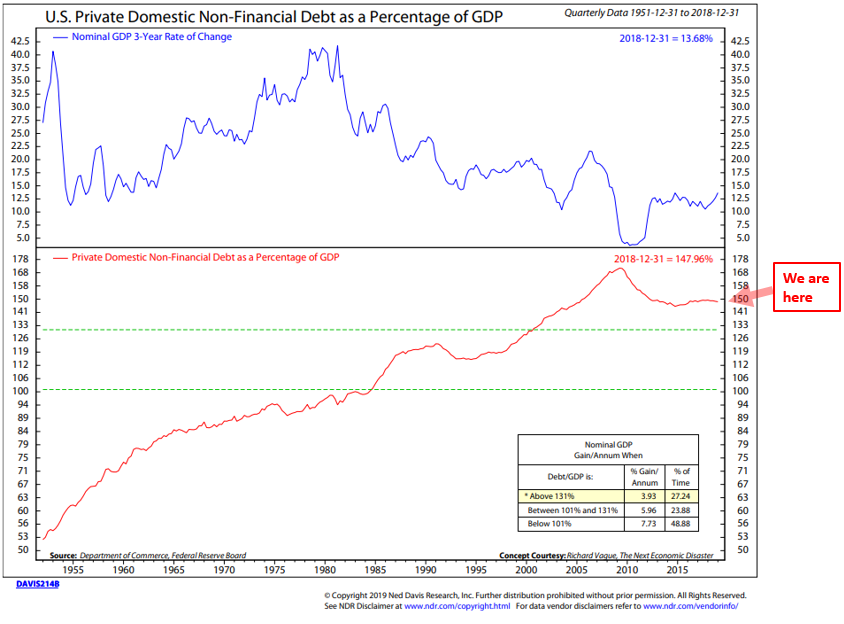
Historically high levels of private domestic non-financial debt relative to GDP have led to slower Nominal GDP growth. [SB here: think of it simply as your debt relative to your income. If debt is high, it takes more out of your paycheck to pay it back plus interest and therefore your personal economy slows.] Private debt-to-GDP levels that have risen more than 18% over 5-years and exceeded 150 percent has signaled coming financial crisis in the past according to Richard Vague in his book The Next Economic Disaster, and can be used to predict future economic crisis.
A side effect of high private domestic non-financial debt is disinflation. Since consumers and businesses have limited spending, they must retrench once they reach their saturation points. When the demand for goods and services diminishes due to the over-extension of credit, the result is disinflation.
The next chart shows the nominal 3-Year rate of change in GDP in the top section. Private Domestic non-financial debt as a percentage of GDP is plotted in the bottom section of the chart. A mode box in the second clip shows the growth of nominal GDP when debt/GDP is low, high or in between.
Focus in on the red “We are here” arrow.
I wrote last week in Recession Obsession and Why It Matters,
It’s worth remembering that it is income (from work or from investments) and borrowing that drive short-term economic cycles and long-term cycles. Parallel to this are short-term debt cycles and long-term debt cycles. The last long-term debt cycle peaked in the mid-to-late 1930s. It’s money spent that drives an economy higher. Credit is actually a form of money that is borrowed from tomorrow and spent today. More spending is good for the economy. The money you and I spend is ultimately someone else’s income. The baker, the butcher, the builder, the landscaper, the auto manufacturer, the auto dealer, the car sales person. Visualize how that multiplies. The same is true for corporations and true for all the actors in the economic ecosystem. Ultimately, debt builds to be too burdensome and has to be paid back. Along the path, it becomes a greater portion of one’s monthly budget and it leaves them with less to spend. An individual’s personal economy slows. If this happens on a mass scale, the overall economy slows. Less to spend is less money available to buy things.
Short-term cycles end in recession and reset. Long-term debt accumulation cycles are different. They are an accumulation of many short-term cycles and different in terms of size and risk. Few of us have lived through a long-term cycle. You know you are near the end when debt relative to GDP (measure of the market value of all goods and services produced) is more than 300% and the central bankers drop interest rates to zero.
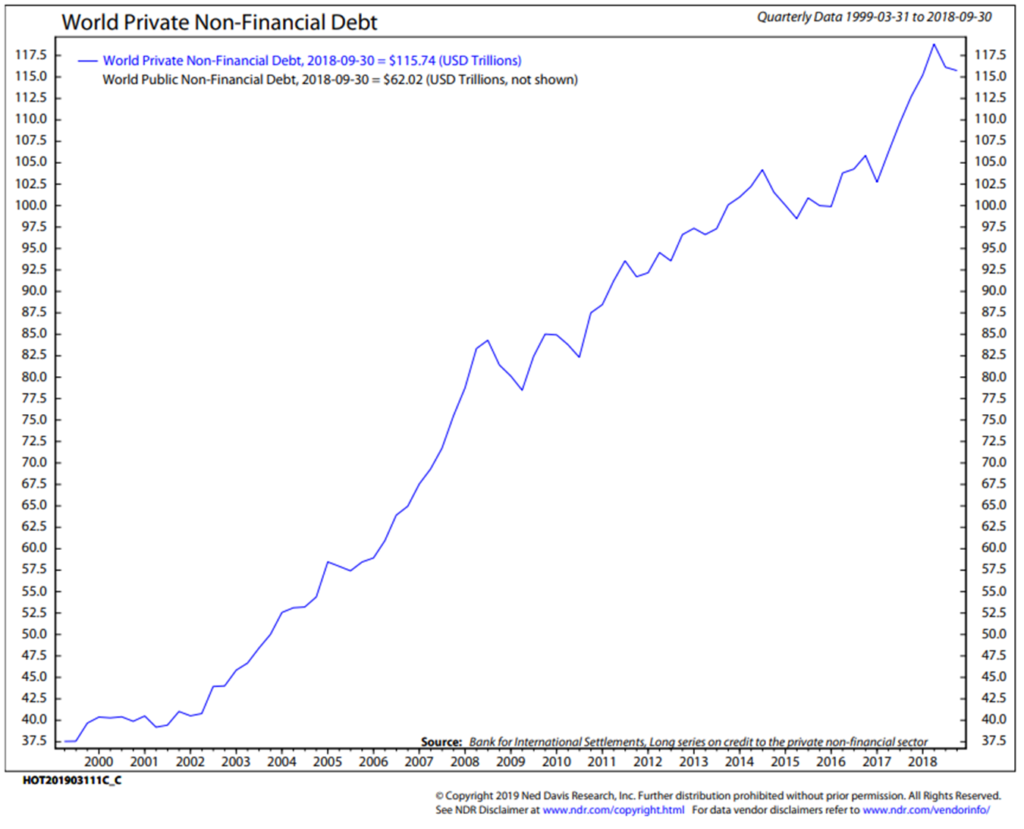
Private debt is from individuals and businesses. Public debt is from governments. Here is a look at world private non-financial debt. Same bottom line. Our bellies are full with debt.
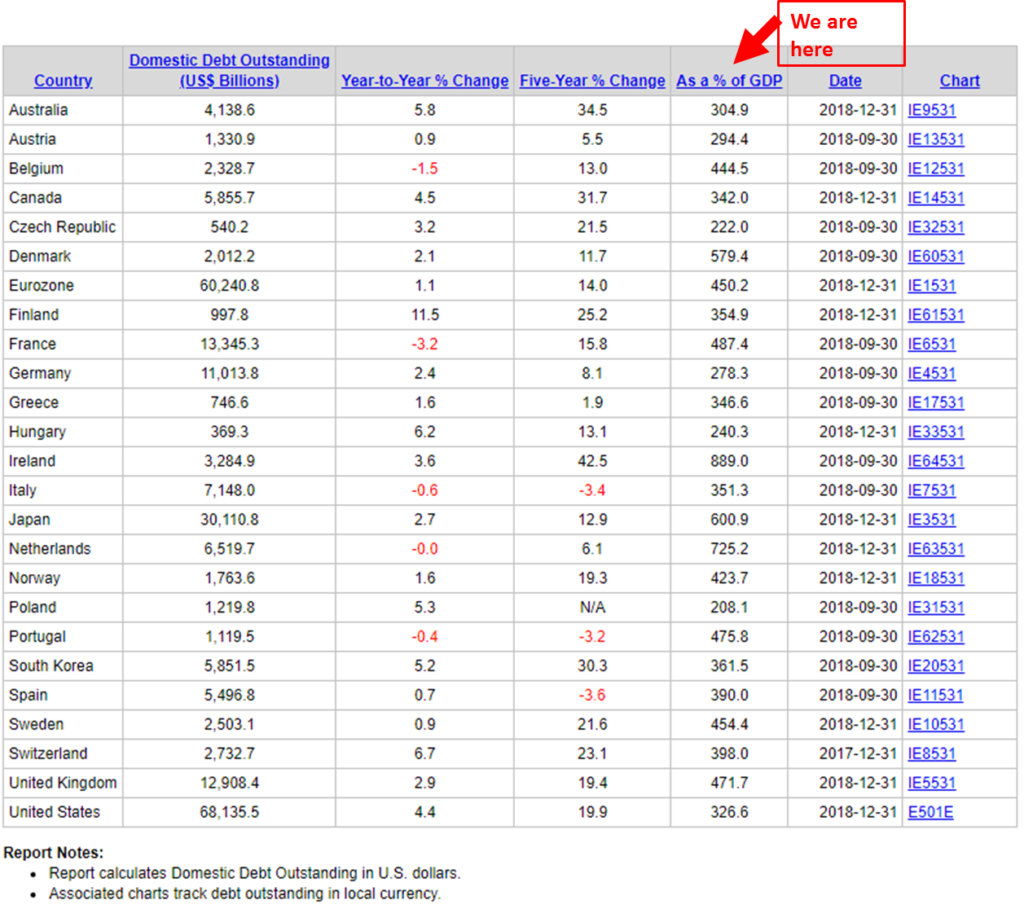
Here is a 30,000-foot view of the debt across much of the developed world. Debt is massive relative to domestic production (income) everywhere:
If you were wondering about China, here is data from Bloomberg through 2017.
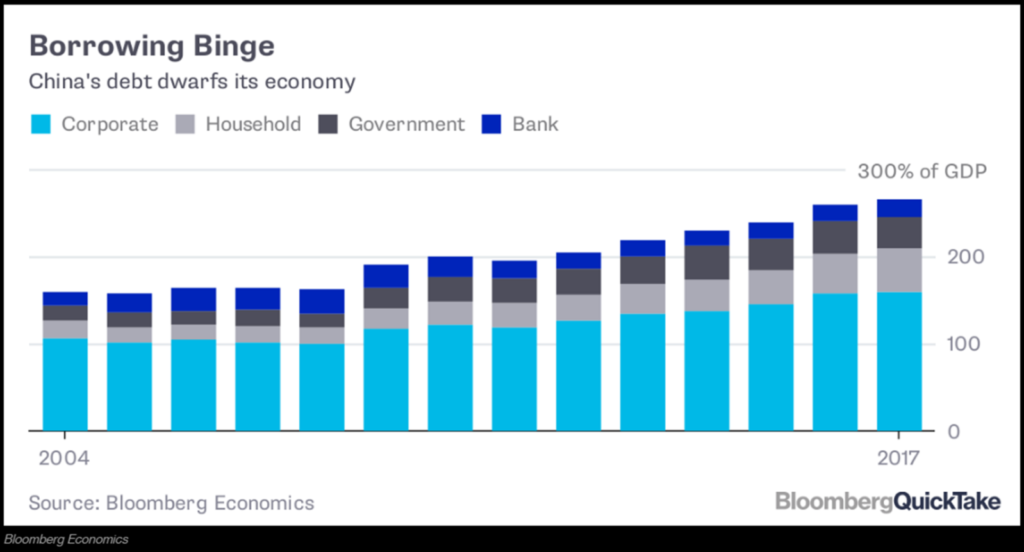
Good friend, Peter Boockvar, put out a note this morning writing, “The China loan data reported today was literally off the charts. Aggregate financing totaled 2.86 trillion yuan, well more than the estimate of 1.85 trillion. Of this, bank loans increased by 1.69 trillion, 440b more than expected. To smooth out the January/February Lunar New Year impact and the month after, total loan growth rose 40% y/o/y. Bank loans are up 19.5% ytd y/o/y. Household borrowing was particularly strong, rising by 460b yuan, the biggest increase in two years. Corporate bond issuance was also up solidly as was local government bond issuance. Money supply growth was higher by 8.6% y/o/y, above the estimate of up 8.2% and the quickest since February 2018.” [SB here: total loan growth rose 40% year-over year… that puts debt-to-GDP above the 300% threshold. I’ll see if I can zero in on the most current number in a future post.]
Bottom line: the world needs a strong economy and growth in China but this economy, which was already hooked on debt, just ramped up its addiction to the credit juice. If you can tell me how this ends well, I’m all ears because I’m bullish on China long term. This data came out after the Chinese stock market closed.
Is it any wonder the IMF issued its warning this week? A tweet from friend, David Rosenberg:
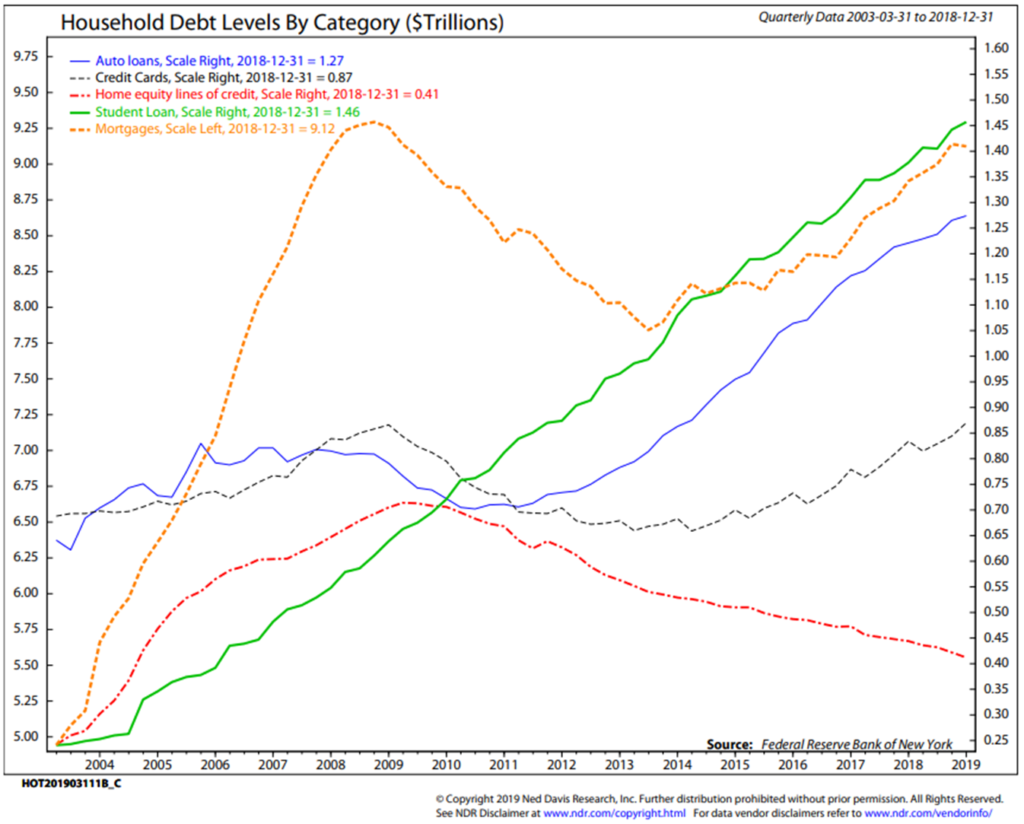
In the next chart, take a look at that green line – Student Debt. This is in TRILLIONS. Look at the growth since 2010.
And to add a little humor into your day. The tweet of the week:
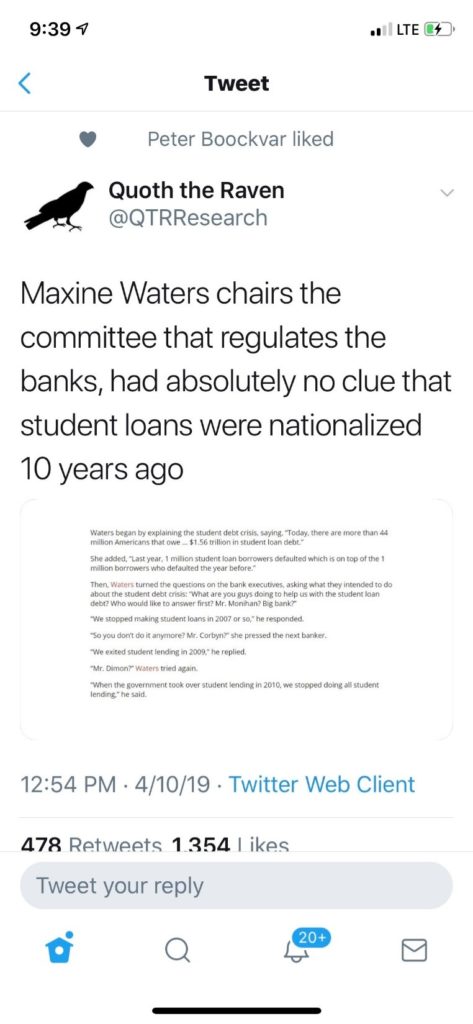
The lower section of the tweet is tough to read, here it is typed out:
Waters began by explaining the student debt crisis, saying, “Today, there are more than 44 million Americans that owe… $1.56 trillion in student loan debt.”
She added, “Last year, 1 million student loan borrowers defaulted which is on top of the 1 million borrowers who defaulted the year before.”
Then, Waters turned the questions on the bank executives, asking what they intended to do about the student debt crisis: “What are you guys doing to help us with the student loan debt? Who would like to answer first? Mr. Monahan? Big bank?”
“We stopped making student loans in 2007 or so,” he responded.
“So you don’t do it anymore?
Mr. Corbyn?” She pressed the next banker.
‘We exited student lending in 2009,” he replied.
“Mr. Dimon?” Waters tried again.
“When the government took over student lending in 2010, we stopped doing all student lending,” he said.
Ok, you just can’t make this stuff up. And note, the government has a different way of dealing with loan defaults, they garnish your wages. I’d rather see the market set the rates and let the bankers and investors take the loan risks (defaults).
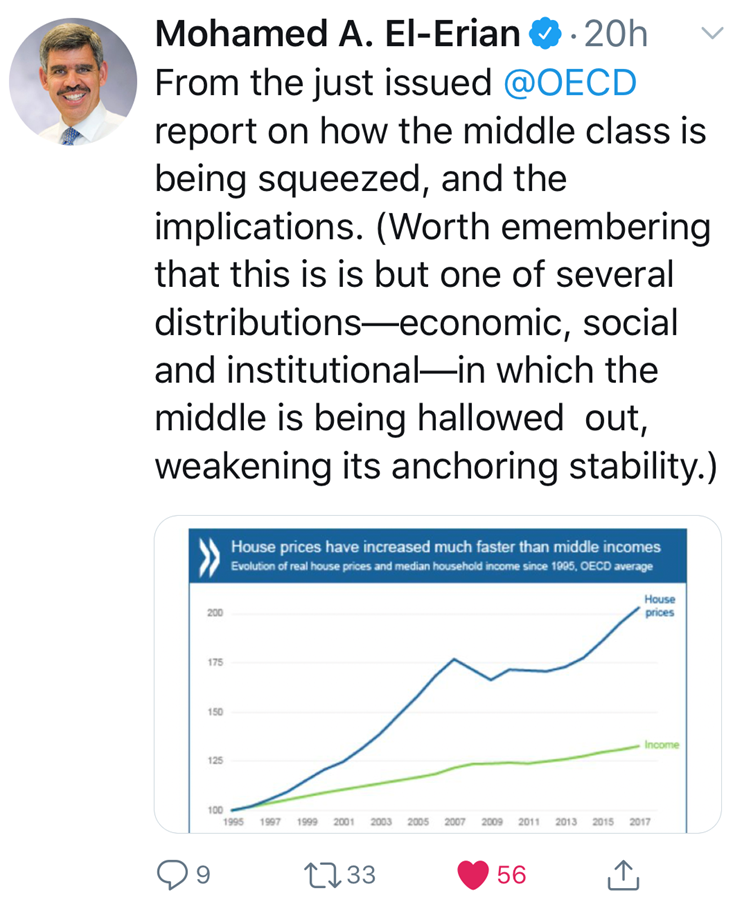
Long-term Debt Cycle Implications
Debt and its economic implications on society. This from Mohamed El-Erian referring to an OECD report, “The middle is being squeezed out, weakening its anchoring stability.”
U.S. Total Credit Market Debt
I often hear from advisor clients that debt was high in the 1980s, 1990s and 2000s. “Why is now any different,” they ask. My answer is that it was around 2004 that debt relative to GDP in the U.S. crossed above 300%. Since 2000, GDP has averaged about 2% per year. Note the yellow highlighted sections in the following chart. All categories measured show that when debt is high, growth is low. Makes sense, of course, but doesn’t fully answer our clients’ questions.
My answer requires some degree of faith just as Dalio has faith in his work on long-term debt cycles and how they play out. After all, investing is a game of probabilities. I wrote about this last July in an On My Radar titled: The Risks Inherent at the End of a Long-Term Debt Supercycle. And last September in: On My Radar: Ray Dalio’s Template for Understanding Big Debt Crises (OMR Part II). They are worth a review if you haven’t seen the research before.
I tell our advisor clients that few of us have lived through a reset of unmanageable debt. Timing is tough but trigger points are debt levels north of 300% debt-to-GDP and interest rates at 0%. At that point central bankers are out of bullets and need to invent something new. Zero percent interest rates on savings is deflationary, it drives investors into riskier asset classes, it inflates asset prices to extreme valuation levels and it hurts pension plans and retirees who need income from investments. This time is not different, we have been here before. Don’t fall into the trap that debt was high in the 80s, 90s and 2000s. I believe we are near the peak… everywhere.
Here is a look at Total Credit Market Debt:
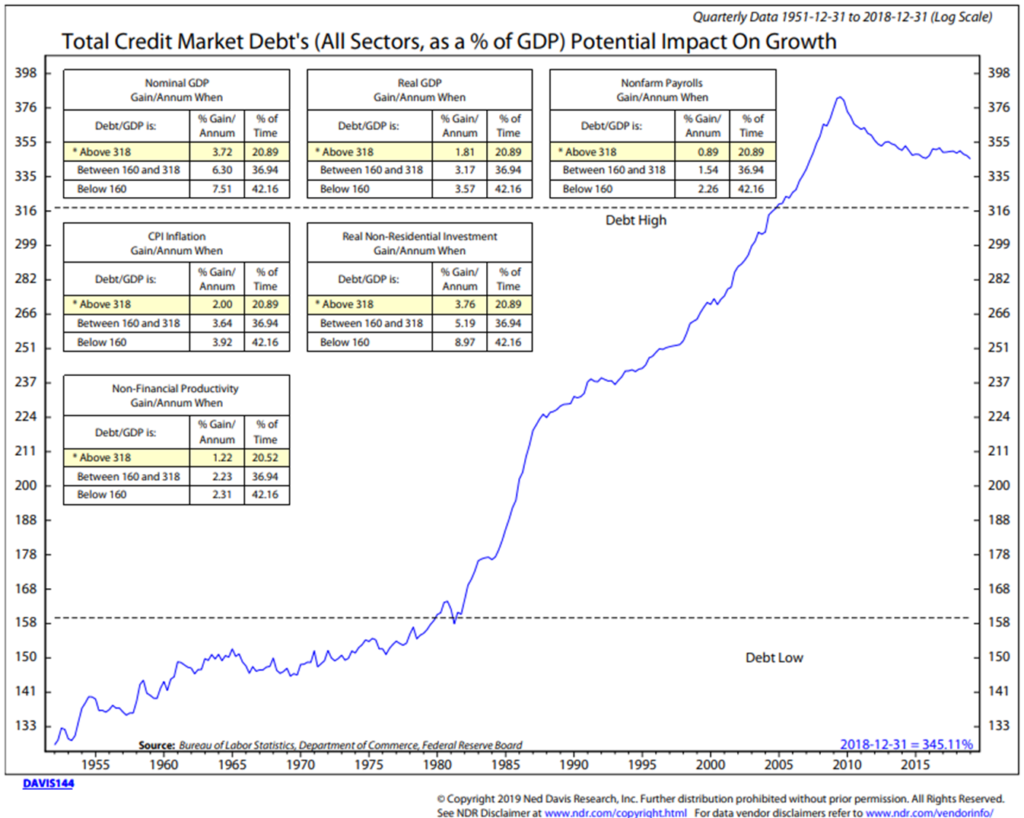
Note: Total Credit Market Debt is the total outstanding debt owed by all sectors (households, corporations, farms, state and local governments, federal government, financial companies and foreigners) and includes open market paper, Treasurys, agencies, muni, corporate and foreign bonds, bank loans, other loans and advances, mortgages, and consumer credit. (Source: Ned Davis Research.)
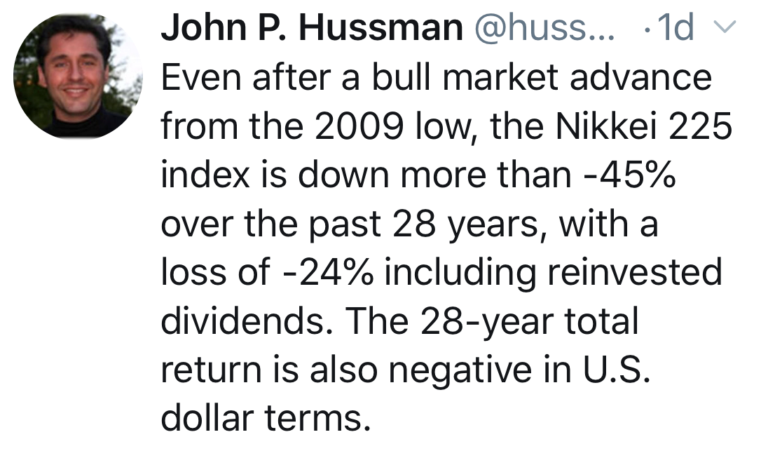
I’m not sure how this plays out. Mark Yusko believes Europe and the U.S. are following the Japanese monetization game plan. He believes we are nine years behind them. My view is I don’t believe we yet know what we will invent next to solve the debt crisis, but he may be correct. I’ll be doing a series of podcasts and will be asking John Mauldin, Yusko, Dr. Lacy Hunt, David Rosenberg and Peter Boockvar to join me. Dalio would be great but that’s a long shot. I think we are headed to a “Debt Jubilee” of some form. Stay tuned.
Now, if we are on the Japanese monetization path, keep this in the back of your mind with our risk assets so richly priced. From John Hussman:
A default wave will occur in the next recession. I’m keeping a close eye on the high yield trend charts and my favorite recession watch indicators. The current trends remain friendly.
But long-term debt cycles are unlike what you and I have witnessed in our lives. I’m screaming as loud as I can… put some form of a risk management game plan in place. Especially if you are a pre-retiree or already in retirement. The opportunity on the other side of the next major correction will be epic. Now, if you are my children’s ages, dollar cost average every year and go really big when prices reset. You have the years to recover.
“Did the Fed Tightening Cycle Ever Get Underway,” by Samuel E. Rines
Sam’s a fishing buddy from Camp Kotok. This was an excellent piece this week and he has given me permission to share it with you.
- Did the tightening cycle ever really get underway? Yes and No.
- The widespread use of quantitative easing and other non-traditional stimulus measures from central banks makes this question a bit difficult to answer.
- Including removing the effects of QE, the U.S. has tightened by 5.5%. Oddly enough, that is roughly in line – to a bit more aggressive than – with a typically rate hiking cycle.
- Both the U.K. and the ECB maintained their stimulus for longer but have recently diverged.
- Given this divergence, the currencies have been one of the primary ways financial conditions have been eased.
So, the tightening cycle was actually fairly aggressive in the U.S., got off the ground in the U.K., and never started in the Eurozone.
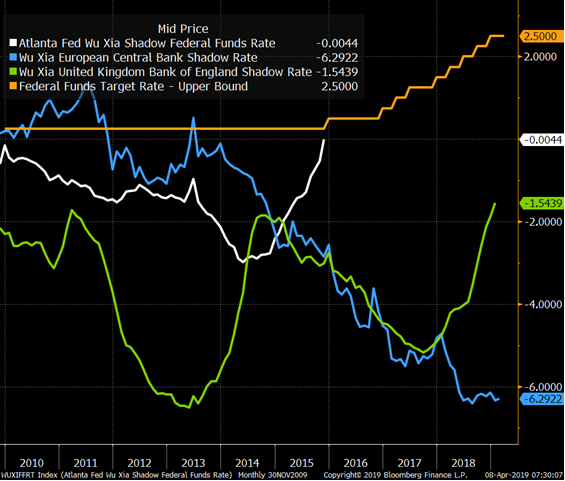
This note ignores the work of the Bank of Japan. It goes without saying that there has been little in the way of tightening from the BoJ. An examination of that will be left for another note (which I am unlikely to write). The focus here will be on the three central banks that had not engaged in QE or similar policies for several decades prior to the financial crisis – the Fed, BoE, and ECB. Granted, the ECB has not been around that long, but it is still included here.
Using the Wu – Xia shadow rates calculated by the Atlanta Fed, it becomes obvious fairly quickly the amount of easing injected into the system in the wake of the financial crisis was enormous. The U.K. was the most aggressive from the beginning, the U.S. joined the party but to a lesser total extent, and the ECB bumbled around for a while before turning on the taps.
Interestingly, if the Fed’s tightening of unconventional policy is included in the calculation, the “rate hikes” equate to a 5.5% increase in the fed funds rate. That amount of tightening is the most the U.S. has seen post the early 80’s breaking of inflation. The ECB has been forced to go in the opposite direction and the U.K. has only begun to move its overall policy tighter.
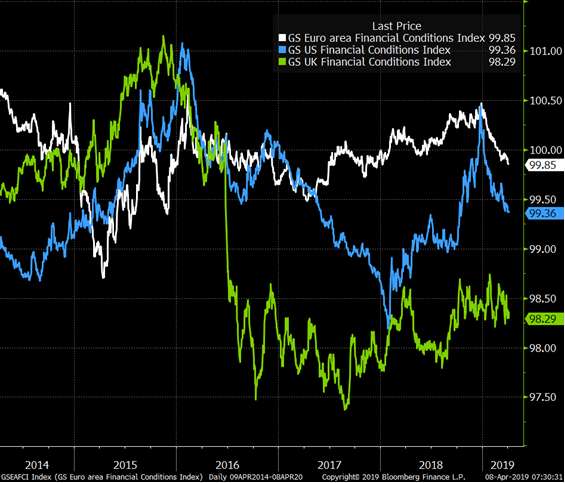
The overall result of these conditions has been a mixed bag in terms of financial conditions recently. The U.K and U.S. have seen generally easy financial conditions, a result of a weaker currency (Brexit) and appreciating stock market. The Eurozone has generally been tighter, but is beginning to join the loosened conditions party.
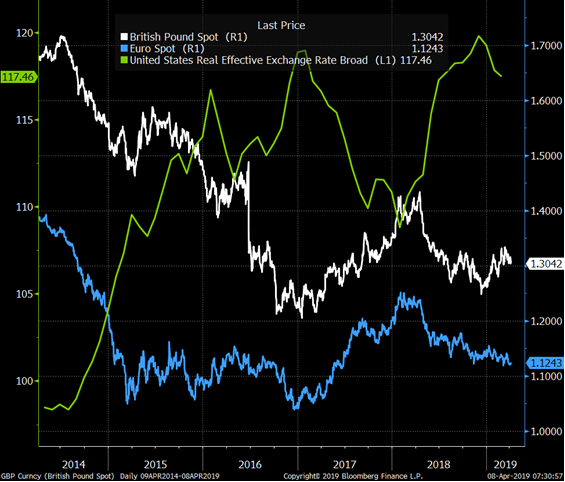
Of note, currency is one of the primary transmission mechanisms of unconventional policy. When the U.S. began tightening in 2014 – 2015 the dollar appreciated rapidly. According to the Bank for International Settlements, the dollar is over valued by roughly 17%. Meanwhile, the Pound and the Euro have seen no appreciation over the past several years. With the Fed on hold, will this last?
The Fed has “tightened” more than in the past several cycles, the BoE has moved higher by 3.5%, and the ECB is at its rock bottom. The divergence lives on, but – while it is tempting – there should be no question about the amount of tightening the Fed has undertaken.
By Samuel E. Rines, Chief Economist, Avalon Advisors, LLC
[Bottom line: Because of the massive load of global debt, tightening causes a quicker hit to economies. Thus, the IMF’s warning of a “delicate moment.”]
Trade Signals – Trend Evidence Remains Moderately Bullish for HY, Equities and FI
April 10, 2019
S&P 500 Index — 2,878
Notable this week:
No significant changes since last week’s post. All of the equity market trend indicators are bullish. The fixed income indicators remain bullish, as do both the short-term and long-term gold trend signals. Investor sentiment is neutral to extreme optimism.
You’ll find the updated equity and fixed income charts below as well as the most recent recession watch charts. Europe is likely in recession. Economic conditions are weakening in U.S. but little chance of recession in the next six months.
Click here for this week’s Trade Signals.
Important note: Not a recommendation for you to buy or sell any security. For information purposes only. Please talk with your advisor about needs, goals, time horizon and risk tolerances.
Personal Note – One Last Powder Day
Daughter Brianna and I flew to Salt Lake City and took an Uber to a ski resort called Snowbird. I’ve had a one-week ownership interest in a condo at the Cliff Lodge for nearly 20 years. This year marked my 40th anniversary. Hard to believe. My father first took me to Snowbird when I was eighteen. Brianna’s first trip was when she was just a few months old. The year after she was on skis. My two boys soon followed and Susan and her boys. However, this year it was just Brie and me.
Our plan was to ski for four days and return on Wednesday but it started snowing Tuesday evening and with fresh 24” in the forecast, we bumped our flights to Thursday. Wednesday was tough. 50 mile per hour wind gusts and pelting snow. Visibility was nearly zero so we called it quits after lunch. With flights set for 2:00 pm on Thursday, we set our hopes on two hours of powder snow before rushing to the airport.
We woke to this… very good news:

We packed our bags as fast as we could, called the bell hop and then raced to get to the tram. The tram is a big lift that holds about 125 people. The idea on powder days is to catch the first tram so you can ski untouched fresh powder. The lift opens at 9:00 am. We were about #75 in line with excitement high. However, we sat in line for another hour plus before the ski patrol gave the all clear to send skiers up. Avalanche control work ongoing. But boy, was it worth the wait. The first run down was a total high. I said a prayer to my dad at the point atop the mountain where we spread some of his ashes… the first run is always for him and oh, what a first run it was… Hard to describe the feeling. Think floating effortless down a mountain on a soft cloud. It’s quiet, peaceful and a really great natural high.
In the center top of the above picture is a fun ad – here’s the close up.
Monday was sunny and 50 degrees – perfect spring day.
NYC follows next Wednesday then Chicago for the Peak Advisor Summit. Mauldin’s Strategic Investment Conference is May 13-16 in Dallas. David Rosenberg will once again kick off the conference on Tuesday morning, May 14. I’ll be moderating a discussion with the Economic Cycle Research Institute’s Lakshman Achuthan and Peter Boockvar, CIO of the Bleakley Financial Group. Both are Camp Kotok fishing friends. If you are curious about the conference agenda, speakers, etc., you can find more information here.
OK, that was way too much about me… Let me hear about you… and let me know if you have a fun story I can share.
Wishing you an outstanding day!
Best regards,
Stephen B. Blumenthal
Executive Chairman & CIO

