
While the quality factor has been identified in the literature (including papers such as “Buffett’s Alpha,” “Global Return Premiums on Earnings Quality, Value, and Size,” and “The Excess Returns of ‘Quality’ Stocks: A Behavioral Anomaly”), and there are now a number of investment vehicles with quality strategies (such as the iShares Edge MSCI USA Quality Factor ETF, or QUAL, and Invesco S&P 500® Quality ETF, or SPHQ), there is no consistent definition of the factor as there is with other factors. Note that while value is generally defined in the literature by the price-to-book (P/B) metric, there are also other accepted measures, such as price-to-earnings (P/E), price-to-cash flow (P/CF), and price-to-earnings before interest, taxes, depreciation, and amortization (P/EBITDA), etc.
Q3 2019 hedge fund letters, conferences and more
AQR Capital Management has defined the factor (QMJ, or quality minus junk) to be companies with the following traits: low earnings volatility, high margins, high asset turnover (indicating efficient use of assets), low financial leverage, low operating leverage (indicating a strong balance sheet and low macroeconomic risk) and low stock-specific risk (volatility that is unexplained by macroeconomic activity). Companies with these attributes historically have provided higher returns, especially in down markets. In particular, high-quality stocks that are profitable, stable, growing and have a high payout ratio outperform low-quality stocks with the opposite characteristics. If you happen to be really excited about profitability I’ve previously covered using it as a factor in an early post. Using their own definition, AQR found that, for the period from 1958 through 2018, the quality premium had an annual average return of 4.7 percent, a standard deviation of 9.6 percent, and a Sharpe ratio of 0.5.
Jason Hsu, Vitali Kalesnik and Engin Kose contribute to the literature on the quality factor with their study “What Is Quality?” which was published in the Second Quarter 2019 issue of the Journal of Financial Analysts. They noted that MSCI, FTSE Russell, S&P, Research Affiliates, EDHEC, and Deutsche Bank, among others, have created quality indexes for licensing and have typically included quality as part of their multifactor offerings.
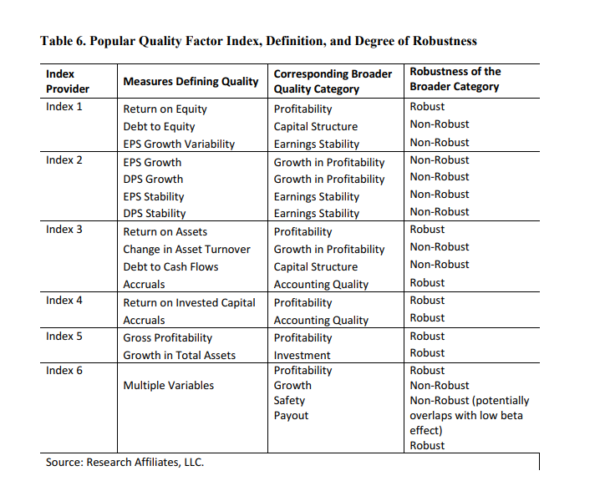
Because of the lack of consistency when implementing quality, Hsu, Kalesnik, and Kose examined which traits were responsible for the quality premium. They examined the following traits: profitability, earnings stability, capital structure, growth, accounting quality, payout/dilution, and investment, noting that each of the six index providers listed above uses substantially different characteristics in their portfolio construction. They tested each of the traits for robustness (using three to eight definitions, such as return on assets and return on equity for profitability) and pervasiveness (time and geography) as well as whether it had been explored thoroughly in peer-reviewed journals. Specifically, they examined factor performance in five regions: the United States, Global Developed, Japan, Europe, and Asia Pacific excluding Japan. The U.S. data covers the period 1963 through 2016, while global data covers the period 1990 through 2016.
The following is a summary of their findings:
- Among a comprehensive group of the quality categories used by practitioners, capital structure, earnings stability and growth in profitability show little evidence of premia, whereas profitability, accounting quality (few accruals), payout/dilution and investment tend to be associated with premia (and provide credible models that motivate the phenomenon); further, profitability and investment-related characteristics tend to capture most of the quality-related premia.
- Characteristics, such as low book leverage and low earnings growth volatility, appear to be overly related to the low-volatility characteristic to warrant independent consideration.
- The correlations of returns among the six index providers reveal a lack of similarity, indicating they are not proxies for a common hidden factor, suggesting these leading quality index products are a collection of heterogeneous attributes linked by the theme of financial and accounting quality.
- No evidence exists that the six indexes proxy for a unique homogeneous source of risk or a single anomaly. Therefore, quality indexes are more appropriately interpreted as multifactor portfolios, the primary commonality is that they are constructed mostly from the less well-known and less vetted firm characteristics.
Hsu, Kalesnik and Kose concluded that the design of indexes “seems driven more by marketing optics than theory or data.” They added:
All of the selected quality characteristics are viewed as being attractive firm attributes, those characteristics investors would generally be willing to ‘pay up’ for. Implicit in the design is that the high-growth and high-profitability firms with low debt and conservative accounting practices are underpriced and thus generate high returns! This should raise alarms for the economists among us. It’s not just a free lunch, it’s a free feast!
I would add the following warning. While premiums resulting from risk-based characteristics cannot be arbitraged away (though cash flows to exploit premiums can cause them to shrink), behavioral characteristics are more susceptible to arbitrage, especially in large stocks where limits to arbitrage (that prevent mispricings from being corrected) are less present. Quality companies tend to also be large companies. Thus, limits to arbitrage play a much lesser role. In other words, buyer beware.
There is one more important point we need to cover.
Indirectly Gaining Exposure to Quality
While some value strategies use the single metric of P/B to determine value, others include other metrics such as P/E and P/CF. The metrics which include earnings-related measures provide exposure to the profitability factor (and the related quality factor). Thus, providing exposure to traits which Hsu, Kalesnik, and Kose found passed their tests. As examples, in their portfolio construction design, Dimensional’s value funds now use not only P/B but also a measure of profitability. AQR Capital Management’s value funds, in addition to using P/B, also use P/E, P/CF, price-to-forecasted earnings and sales-to-enterprise value. In other words, you can gain exposure to profitability and quality indirectly through investments in value funds that use metrics other than P/B. And multifactor funds are more efficient than single-factor funds. One reason for this is that, if you use the component approach, you could have one factor-based fund buying a stock (or group of stocks), while another factor-based fund will be selling the same stock (or group of stocks). For example, if a stock (or an entire sector) is falling in price, it might drop to a level that would cause a value fund to buy it, while a momentum fund would be selling the very same security. Investors would thus be paying two management fees and also incurring trading costs twice, without having any impact on the portfolio’s overall holdings.
Summary
Hsu, Kalesnik, and Kose show that, when selecting funds to gain exposure to desired traits/characteristics, investors need to dig deeper than just relying on a fund’s name. Fund construction rules matter a great deal. And while it’s important to consider a fund’s expense ratio, fund construction rules can matter more than fee differentials.
We observe that most of the indices use at least a few non-robust measures in their definitions.
Jason Hsu, Vitali Kalesnik, and Engin Kose; What is Quality
The Most Important Chart from the Paper
The results are hypothetical results and are NOT an indicator of future results and do NOT represent returns that any investor actually attained. Indexes are unmanaged, do not reflect management or trading fees, and one cannot invest directly in an index.
- The views and opinions expressed herein are those of the author and do not necessarily reflect the views of Alpha Architect, its affiliates or its employees. Our full disclosures are available here. Definitions of common statistics used in our analysis are available here (towards the bottom).
- Join thousands of other readers and subscribe to our blog.
- This site provides NO information on our value ETFs or our momentum ETFs. Please refer to this site.
The post “The Quality Factor – What Exactly Is It?” appeared first on Alpha Architect.

