
Why So Many Managers Bucked the Trend That Was Supposed to Be Your Friend
The Federal Reserve has an explicit dual mandate. Managed Futures strategies have an implicit one—specifically, 1) deliver positive returns on average and 2) generate especially attractive returns during large equity market drawdowns. This dual mandate is one of the big reasons managed futures strategies can be valuable in a portfolio. Unfortunately, by and large, the industry—intentionally or not—has been optimizing for one at the expense of the other. Admittedly I have a self-serving axe to grind here as we believe we stuck to the dual mandate and suffered for it for quite a while (but not lately!).
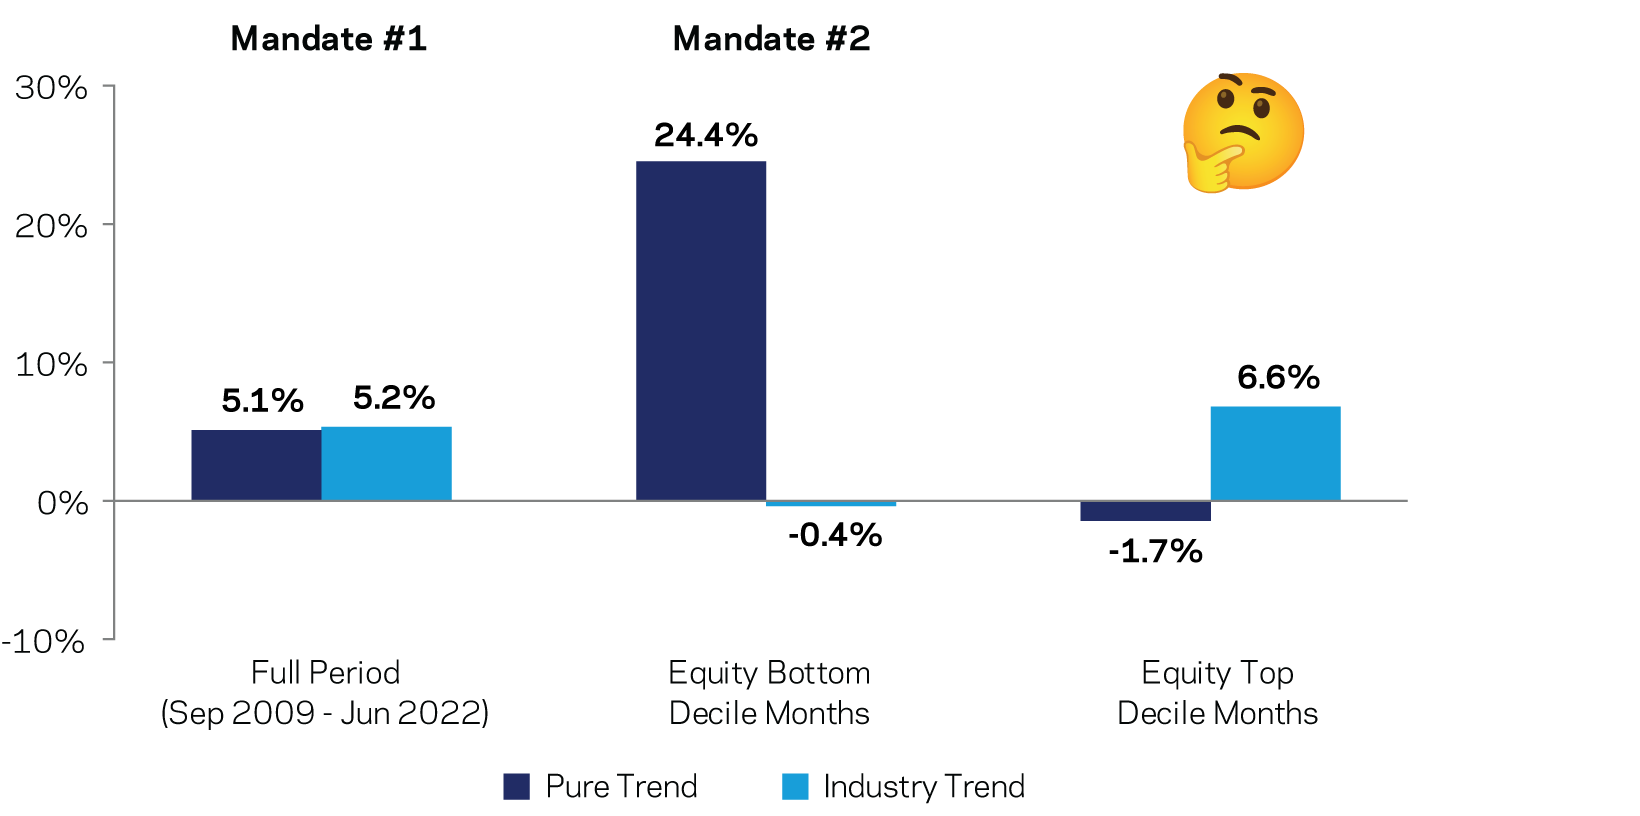
Exhibit 1 shows what I’m talking about, using the SG Trend Index as a proxy for the industry (“Industry Trend”), and the AQR Managed Futures Composite as a proxy of “Pure” trend-following (more on what I mean by that later). Both pass Mandate #1 (positive average returns), but not Mandate #2 (especially attractive returns when most needed). How can this be? The rightmost set of bars—performance when equities did especially well—is the smoking gun (I know it may seem odd for me to crow over the periods when we underperformed, but I think it will make sense soon).

Exhibit 1: Trend Performance during Top and Bottom Decile Equity Months
September 1, 2009 – June 30, 2022

An Industry That Got Carried Away
Let’s go back a decade or so. Managed futures were a rare bright spot among alternatives in the Global Financial Crisis (GFC). However, since then—and until fairly recently—strategies built to profit from price trends have had a hard road to hoe. Since the GFC, markets have trended less than their historical norm. Also until fairly recently, while there have been some scary times, markets have generally been quite strong. Markets trending less than normal (i.e., a challenge for Mandate #1) and few tails to hedge (i.e., little need for Mandate #2) has been a desultory combination for the managed futures industry.
But bad times happen to good strategies. Everybody knows that. So, what’s the right thing to do when a good strategy with over 100 years of evidence across a very wide range of markets and with solid economic intuition has a decade of tepid performance for reasons that are quite easy to explain? Naturally, you change it, right? This (in an admittedly snarky nutshell) is what seems to have happened to much of the managed futures industry.
Let’s look at the facts. The first thing we’ll want to analyze is exposure to equities, as during a bull market, exposure to markets should be a boon to average returns and a detractor in bad times. I use two versions of managed futures: the first is AQR’s version of trend-following (“Pure Trend”), and the second is the industry in general, proxied by the SG Trend Index (“Industry Trend”) and regress each on the global stock market.


Over the whole period it looks like a behind-the-scenes victory for Pure Trend (i.e., AQR). If anything, we have been a slight hedge against market moves (though not statistically significantly), and the SG Index the opposite. Thus, the “problem” for Pure Trend isn’t its alpha—it’s that markets have gone up spectacularly. But we think it means we’ve stuck more to what managed futures is supposed to do.
Let’s add one more thing to the regression. Anecdotally (from lots of sources) many managed futures managers try to improve their Sharpe ratios and realized total returns by adding carry strategies. That’s fine if you’re trying to improve Mandate #1, but carry is often a “risk on” strategy. Thus, it can become a real problem when it comes to Mandate #2. So now we’ll add a simple carry strategy to our regression.
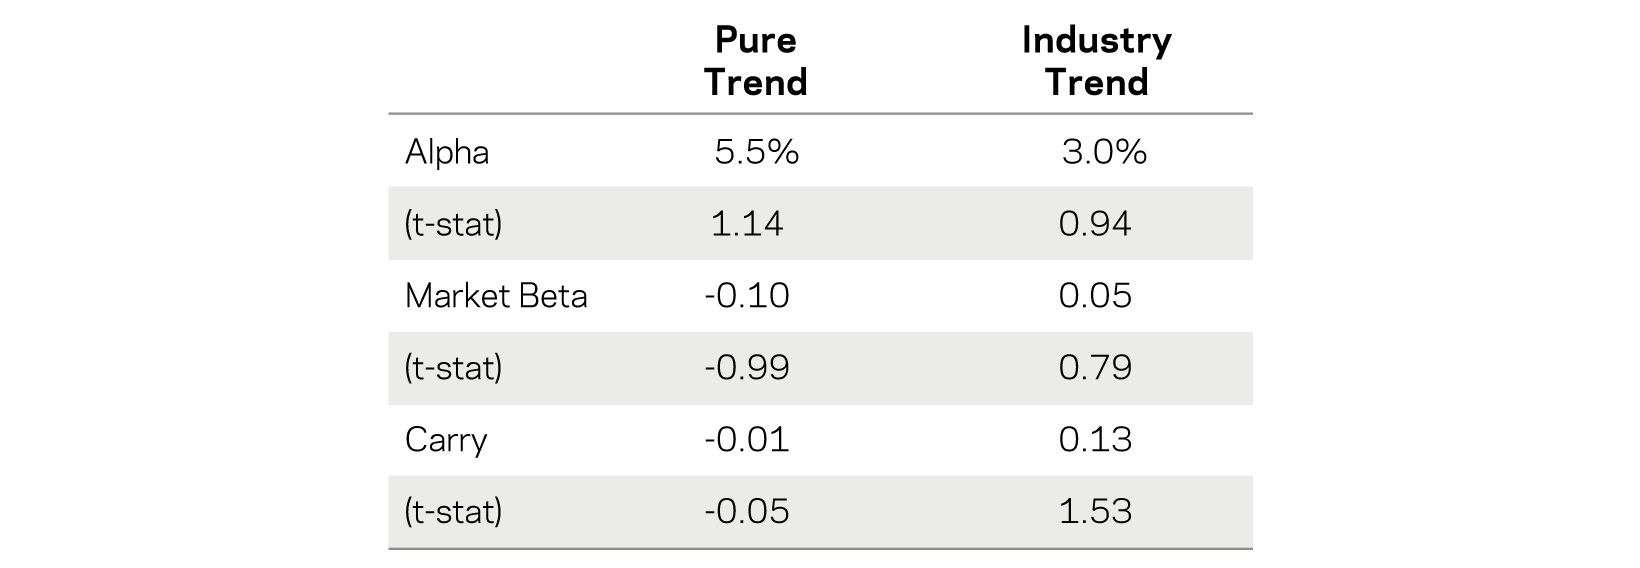

The alpha gap has widened once more, with AQR now adding near double the alpha net of these exposures (exposures you don’t want in managed futures if its job is to save you in a downturn). Which brings us to the betas—what about the exposure to stuff that compromises Mandate #2? The above table shows a 1.53 t-statistic on carry for the industry, and that doesn’t pass traditional hurdles of statistical significance. So maybe there’s really nothing there?
Actually, there is something but you can’t see it in the above regressions. Below is an easier way to see it. It’s the same table we just saw, but in the last column I take Industry Trend minus Pure Trend to show how far managed futures as an industry have strayed from what they purport to do.
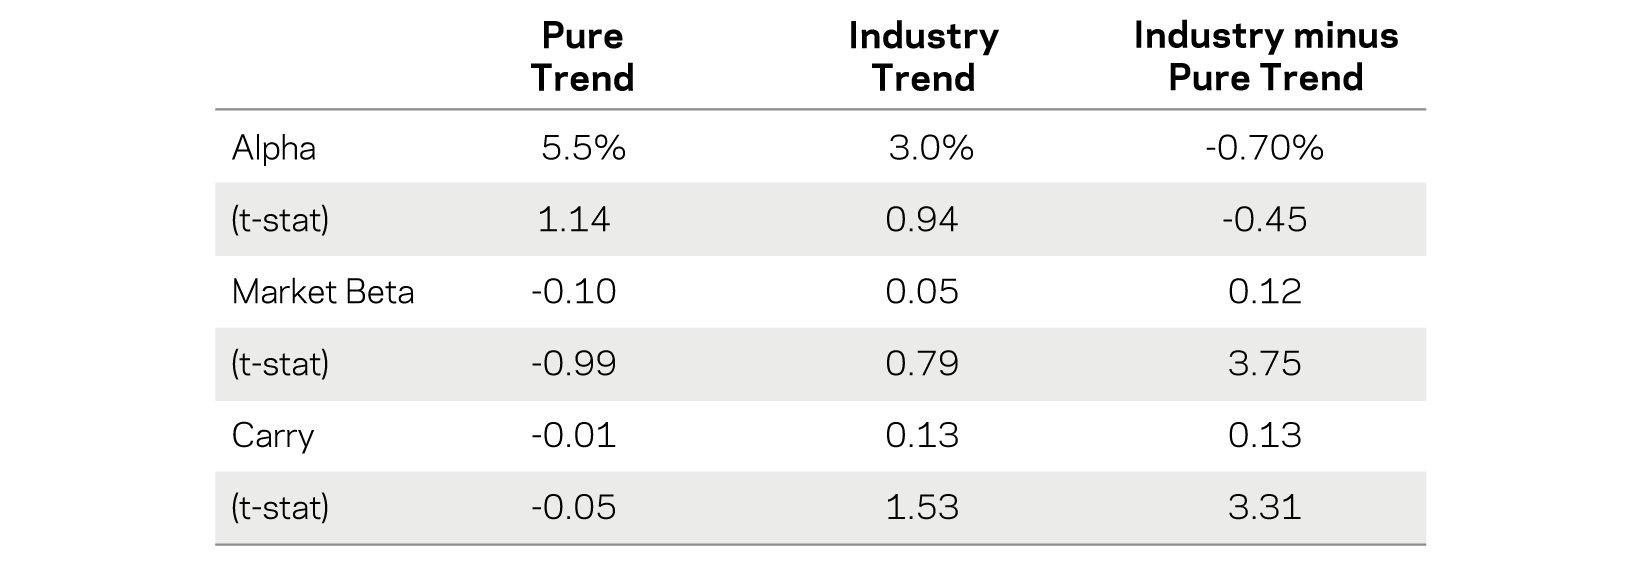

This last table is why we feel pretty good about the choices we’ve made compared to the industry. The differences hurt us when things were mostly very good for the world—i.e., when market beta and carry strategies were doing well. But we didn’t stray from our purpose. Our version of managed futures has been competitive, though slightly behind the SG Trend Index over the past five or so years of a raging bull market. And unfortunately, that’s a horizon over which much of the world compares managers. However, adjusted for the industry’s general bullish equity and carry exposures, we’ve actually won (albeit by a statistically weak amount) over our full history (and we argue that adjusting for these exposures fits the point of managed futures).
Tattle-Tail Hedgers
We’ve now seen how “Pure Trend” and “Industry Trend” have differed on average. Industry Trend, in seeking to look better on Mandate #1 (positive returns on average), picked up exposure to things we’d expect to weaken its ability to deliver on Mandate #2 (especially attractive returns when most needed). We can see this more directly, and perhaps more relevantly—regression averages are nice, but huge drawdowns for traditional assets are more to the point—by comparing their performance during the three worst drawdowns for traditional portfolios since the GFC.
Exhibit 2: Hypothetical Performance in Three Drawdowns of Global 60/40
Oct 1, 2008 – June 30, 2022
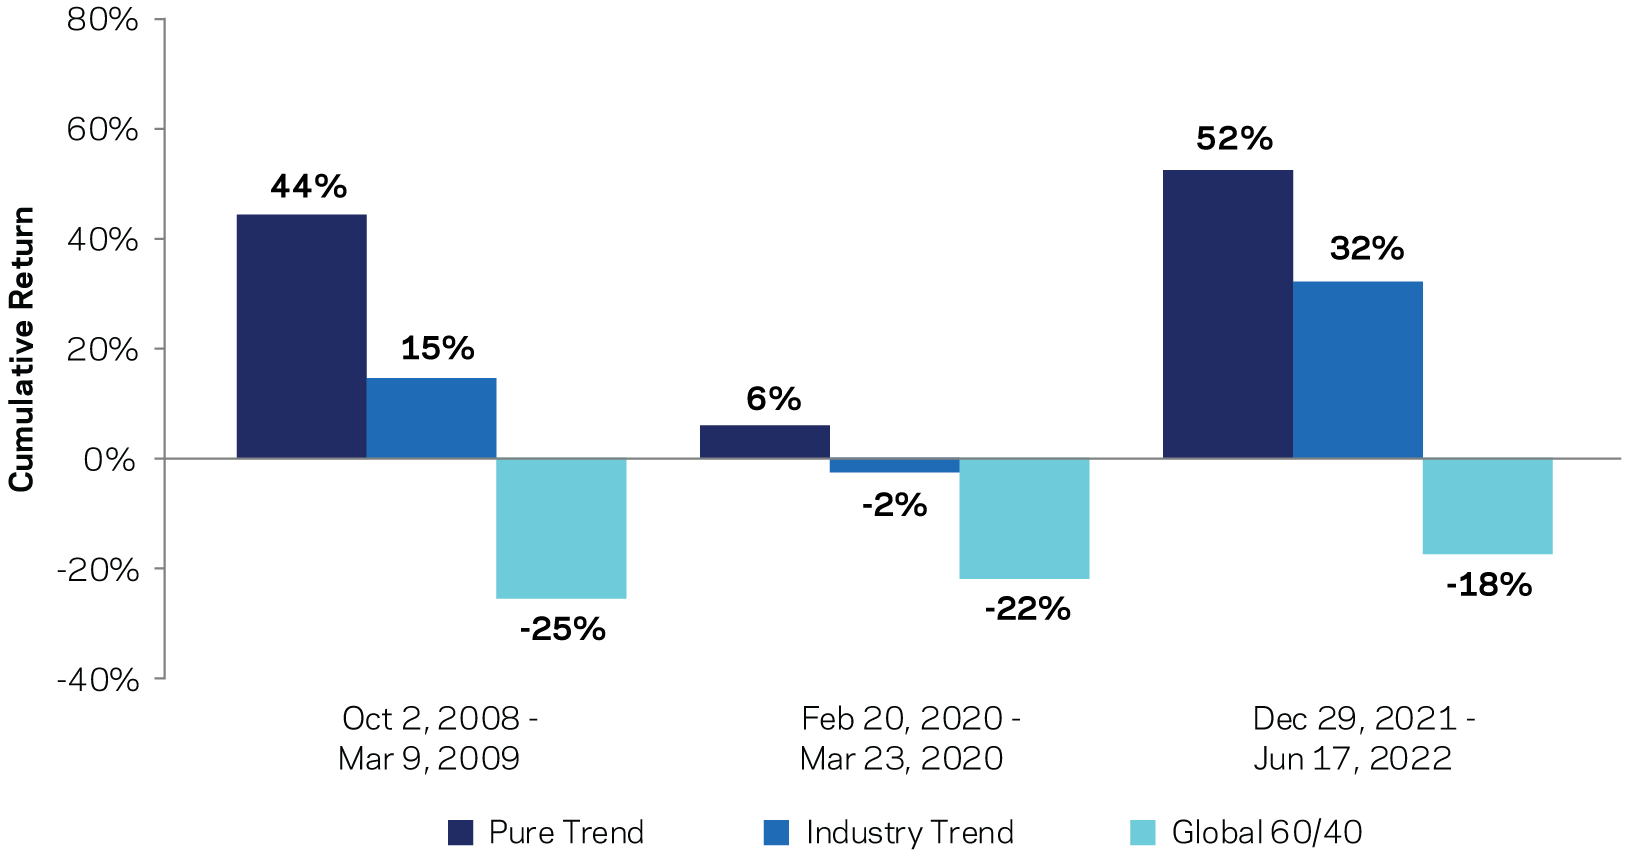

These are not inconsequential numbers. The average drawdown of 60/40 across the three above is -22%. The average return of Pure Trend is 34%, meaning a 10% allocation to Pure Trend saved 5.6% on average in these drawdowns (and if it were a nice 20% allocation, you know you could double that, because math!). In contrast, Industry Trend saved you a bit more than half that.
I’ve got nothing against exposure to equities and carry strategies— but when wrapped into managed futures it can be a problem, as it is contrary to part #2 of their reason for living. In good times (e.g., most of the post-GFC period), the kinds of managed futures everybody likes best are the ones with the highest average return (as opposed to ones having the best defensive characteristics). However, what that can mean is the investors themselves10 have traded off one mandate for the other. Whether they’ve done that intentionally or by chasing returns too much is another question unanswerable with the data.
A weakened ability to deliver on Mandate #2 may be especially problematic today. One of the biggest areas of growth in the “alternatives” industry is in illiquids, such as private equity. I’ve cathartically written about how “great” smoothed returns can be for the investment manager—but for the investor, what you often get is a mirage of lower volatility and lower market risk, even though the underlying economic exposures are pretty much the same. Smoothing returns helps conceal market drops that quickly recover, like the COVID shock. However, it can’t help against a very protracted bear market where eventually you need to mark your positions. The bright side for managed futures strategies, though, is that they are designed to do well in exactly these types of slow-moving train wrecks. In other words, tough times for private equity tend to be great for trend-following. Thus, Mandate #2 is likely especially important for investors who’ve increased their allocations to privates and illiquids since the GFC.
Stand By Your Mandates
Like others, we always want to improve our process. But improving something that you already believe is a long-term good strategy is fraught, especially when in reaction to a period of weak returns. Biases can come in. Grizzled veterans like tried-and-true strategies; newer market participants are biased toward the cool and new— and these are often at odds with each other (guess which one I am 😀). And regardless of when you decide to add something new to the process, something to always worry about is data mining.
But too often “innovation” is taken to mean “something totally new”. It doesn’t have to be; for strategies like managed futures, we think innovations can be—and ideally should be—firmly tied to the core thesis of the strategy itself (i.e., investors systematically under-react to information). This can help ensure changes don’t come at the expense of Mandate #1 or Mandate #2.
At a very high level, here are two innovations that we think of as the “right” kind of improvements for managed futures. Both strategies have return characteristics that achieve the dual mandate on their own.
• “Alternative” Trends: Admittedly, this one is pretty obvious. If you find trend-following to be a pretty persistent and pervasive strategy, then you would expect to find evidence for it even in places you didn’t originally check. And not just in different asset classes, but even in factors themselves. Trend-following in these harder-to-access or harder-to-implement contexts is a natural extension of the core thesis of managed futures strategies, and as such not surprisingly has also shown the ability to meet the dual mandate.
• Economic Trends: This one is less obvious but I think is pretty cool. Managed futures is all about capturing the tendency of markets to gradually incorporate new information. This creates persistent price trends— but it also implies that positioning on the basis of recent news should also be profitable, which means trend-following based on economic fundamentals is worth taking a look at, too. The gist of this strategy is to go long assets for which fundamental macroeconomic trends are improving, and short assets for which fundamental macroeconomic trends are deteriorating.
You might expect “price trend”—and “economic trend”-based strategies to be correlated but still complementary: sometimes markets can seem disconnected from fundamentals and sometimes they seem more driven by fundamentals —so having both in a process makes intuitive sense. You’d be right.
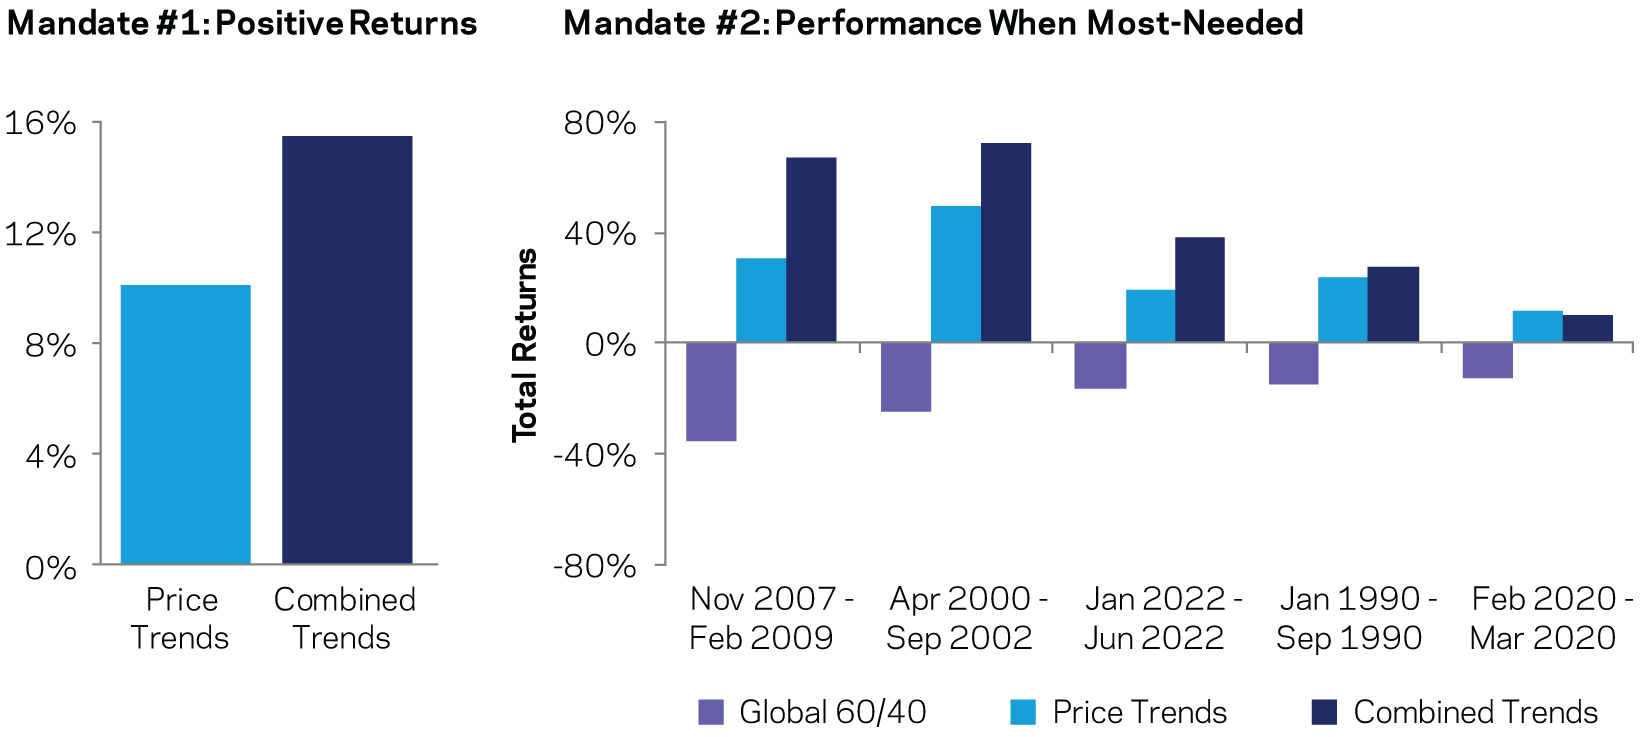
Can these more novel approaches actually improve “tried-and-true” managed futures? Below I compare the two versions, with “Price Trends” being traditional managed futures and “Combined Trends” being one that—you guessed it—combines Price Trends with the two innovations described above (one essentially being more, and more esoteric, price trends, the other being economic trends). Since these are somewhat recent improvements, we’ve left the world of live returns and are looking at backtests below.
Exhibit 3: Hypothetical Performance for Each Mandate
January 1, 1990 – June 30, 2022

What the Managed Futures Industry Can Teach All Investors
The managed futures story is a microcosm of the alternatives industry in the post-GFC era—a decade-or-so stretch in which traditional assets were enough to reach many investors’ return objectives. Arguably, with these same traditional assets now even richer than they were a decade ago, investors need to be careful to take away the right lessons.
The first is that when it comes to alternatives, “above-average returns” doesn’t always mean “better for your portfolio.” Going back to the regression tables earlier, investors need to look beyond raw average returns to evaluate how much value a strategy is actually adding. This is especially true amid a bull market, where “beta” can easily be sold as “alpha,” leading investors to add to risks they already have.
Similarly, even an investor who wants to stick with the strategy, whose heart and brain are in the right place, often implicitly ends up sorting on and choosing the versions of the strategies that aren’t really doing what they’re supposed to. To be even more explicit, say you are disappointed with your existing managed futures manager because he or she has underperformed the peer group, but you’re worried about the market environment going forward, so you want to stick with the strategy. If you search among all managed futures managers and switch to the one that has performed the best over the last five or ten years, you will very likely choose one that has traded off mandate #2 for mandate #1. This is like the alternatives equivalent of selling at the bottom.
The second, and more general takeaway, is that good strategies have bad times. Maybe paradoxically, if they didn’t have bad times, they probably shouldn’t be expected to work going forward. Prolonged good times attract large flows and eventually strategies become over-capitalized, and whatever expected return advantage they had is driven down. In contrast, bad times drive flows away from strategies and leave them less capitalized but with better expected returns going forward. This cycle of good times and bad times is precisely what allows positively-rewarded strategies to persist over very long periods of time.
It’s always a noble (if fraught) effort to improve a good strategy. Doing so without harming the strategy’s reason for living is even harder. We believe adding market beta and carry is the wrong way to do it for managed futures. Instead, we think adding strategies like Alternative Trends and Economic Trends that preserve (and improve upon) the dual mandate is the better way to innovate.
The bottom line is we think the long-term evidence is that trend-following delivers on the “dual mandate.” It can have tough times, sometimes for years, if markets don’t need their diversification and if trends reverse more often than normal. But these few years are a drop in the bucket versus the longer-term evidence and logic. Even over one of the tougher decades you’ll see for managed futures, it did what it’s supposed to do. It delivered non-trivial positive returns and excelled when it was supposed to and was most needed.

