
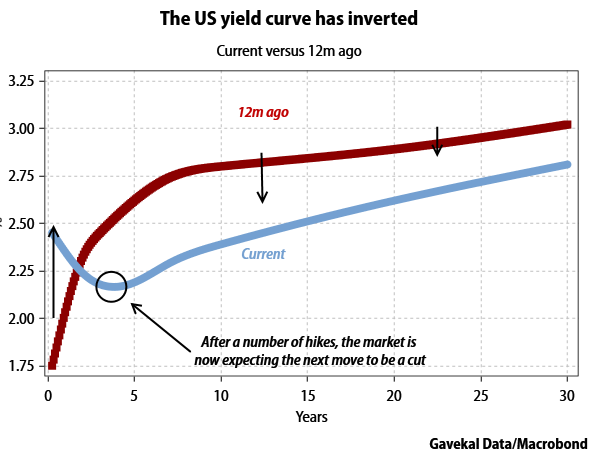
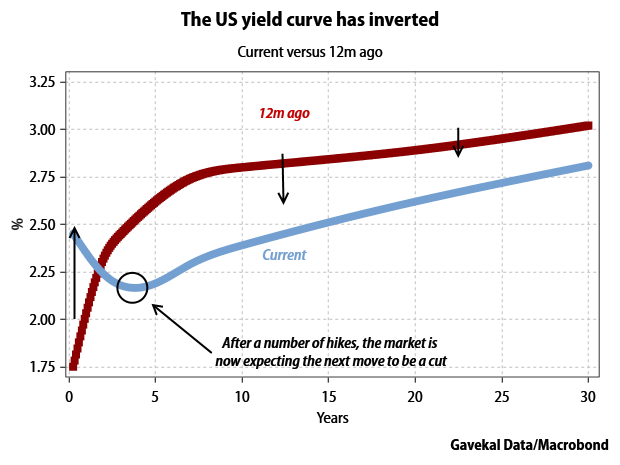
“There’s a lot of reasons to think that it has been a recession predictor for reasons in the past that kind of don’t apply today.” – John Williams, President and CEO, Federal Reserve Bank of New York
Is it different this time? Williams is saying yes. The bond market is saying no. After nine Fed hikes since December 2015, the market is expecting the next move to be a rate cut.
Q4 hedge fund letters, conference, scoops etc
I had filed away Hoisington Investment Management Company’s Quarterly Review and Outlook for 4Q2018. Dr. Lacy Hunt’s and Van Hoisington’s letter began in normal fashion: deeply wonkish. Their data dive is excellent, but to save you the CFA-level mind meld, Hunt and Hoisington conclude that we are heading back to “zero bound.” That means they see the Fed, whether they know it yet or not, on the path to reducing the Fed Funds rate to 0% (it currently sits at 2.25%). I filed the piece away with the intent of bringing it to you a number of months from now to simply say, keep your eye on the intelligent, process-driven players with skin in the game. Van, Lacy and their team are generally a few steps ahead of the pack.
Below you’ll find Van and Lacy’s conclusion along with a link to the full letter. Additionally, I share with you Louis-Vincent Gave’s client letter. He walks us through five potential scenarios and shares potential outcomes pro and con. Louis then concludes,
“The current economic slowdown is an odd development. Logically, with cheap oil, low interest rates, tight spreads and a stable US dollar, the global economy should be booming. But it is not.
From here, you can come to one of two possible conclusions.
- The economy is going through some kind of soft patch: maybe a mid-cycle slowdown, or maybe just a speedbump linked to political uncertainty. But whatever the reason, it won’t last and soon growth will be roaring again.
- This time it is different.”
Personally, I have trouble betting on “This time it is different.” Put the odds at 1.5 out of 10. Anyway, that’s what history tells us. 85% of the time recession has followed inversion. So two sections to zero in on when you read below. First, take a look at Van and Lacy’s conclusion and then read what Louis shared with his clients, and allowed me to share with you (hat tip to John Mauldin), a piece titled “Beyond the Yield Curve.” It prints long but reads fast.
My mom had a beautifully impatient way about her. She was always a “get to the point” kind of person. I loved that about her, but must say I bet my inheritance that trait drives my team nuts from time to time. So, in the spirit of my wonder mother, let’s get to the point… to which Louis sums it up at the end of his piece (keep a close eye on the HY bond market):
Today, we are simply not seeing this deterioration in spreads. Therefore, investing along the lines of the first two scenarios—avoiding structurally challenged industries, while simultaneously positioning portfolios for a continuation of ultra-easy monetary policies from Western central banks—makes the most sense. But if spreads start to widen, then the odds of the last scenario will go through the roof—and the price of most financial assets through the floor. [Emphasis mine.]
What “spreads start to widen” means is that the yield on high yield bonds move up much higher than yield on safer bonds, such as high grade corporates and Treasury bonds. I again suggest that the HY bond market holds the key and share with you a simple process that you may find helpful in terms of timing. You’ll find that chart in the Trade Signals section below.
Grab a hot coffee and find your favorite chair. Thanks for reading!
♦ If you are not signed up to receive my weekly On My Radar e-newsletter, you can subscribe here. ♦
Follow me on Twitter @SBlumenthalCMG
Included in this week’s On My Radar:
- Return to the Zero Bound, by Dr. Lacy Hunt and Van Hoisington
- “Cashing In: How to Make Negative Interest Rates Work,” by Ruchir Agarwal and Signe Krogstrup
- “Beyond the Yield Curve Inversion,” by Louis-Vincent Gave and Charles Gave
- Trade Signals – Data Dependent, Process Driven, Risk Management
- Personal Note
Return to the Zero Bound, by Dr. Lacy Hunt and Van Hoisington
I read Lacy and Van’s 2018 quarter-end letter and tucked it away. Their message is the Fed will be returning to zero-bound. In English, this means that the Fed will reduce the Fed Funds rate, currently at 2.25%, to 0% in order to stimulate the economy. Essentially, in attempt to fight recession. As usual, Lacy and Van are a few steps ahead of the pack.
Excerpts and conclusion from his letter:
In view of the increasingly restrictive monetary conditions, a change in Federal Reserve policy is in the offing. The historical record indicates even a quasi-recession would necessitate a significant decrease in the Federal funds rate. However, the Fed will not be able to deliver the same rate cut as historically has been the case since the Funds rate would be truncated by the zero bound. Even a quasi-recession would lead to such diminished inflation that the U.S. economy could face zero inflation or outright deflation. Zero inflation would imply that some sectors would be in deflation and that the real burden of the debt levels would become onerous enough to eventually turn a slowdown into a more persistent and/or deeper economic funk.
We looked at three time periods when sufficient economic difficulties arose that a major Fed response was required although a full-fledged recession did not materialize: 1966- 67, 1984-86, and 1995-99 (Table 1). All three cases have important similarities…
There are four key differences this time compared to past episodes which cast doubt on the Fed’s current capability to turn the economy around with already current low interest rates. First, money velocity was much higher in all cases and was not in a secular downturn as presently. Second, indebtedness was far less. Third, demographics were robust and in stark contrast to the population growth that was only 0.6% in 2018 and an eighty-one year low. Fourth, foreign business conditions were far superior to the synchronized slowdown currently apparent.
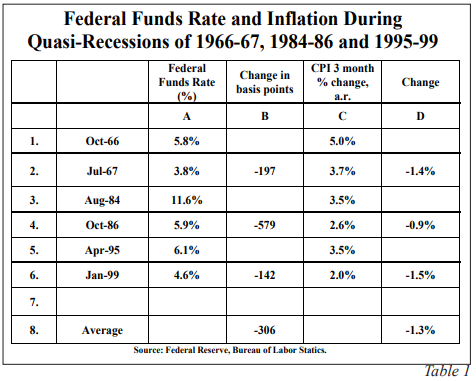
On average, during those episodes, the Federal Funds rate and the U.S. inflation rate, decreased by 300 basis points and 1.3 percentage points, respectively. Interest rates and inflation were much more elevated during these previous episodes. However, as noted, our current lower rate and inflation circumstances are due to lower velocity of money, higher debt, and poor demographics. Therefore, a larger percentage decline in inflation and interest rates can be expected. Even a mild recession in 2019 would put the Fed in an untenable situation.
It is conceivable that the Fed, constrained by the zero-bound interest rates and in attempting to raise economic activity, could engage in another untested experiment with unforeseen consequences to boost debt levels. If that occurs, the U.S. debt overhang would worsen and the country would follow a path pursued by other heavily indebted countries such as Japan, Europe and China. The risk is rising that the U.S. will not only return to zero short rates but, as they have in Japan, might remain there for several years.
By Van R. Hoisington Lacy H. Hunt, Ph.D.
Here is the link to the full piece.
“Cashing In: How to Make Negative Interest Rates Work,” by Ruchir Agarwal and Signe Krogstrup
If your lights are on and, I’m sure they are, you’ve seen the massive drop in the yield on the 10-year Treasury the last several weeks. Since Lacy and Van’s Q4 2018 review, the economy appears to have slowed and the yield curve has inverted (shorter-term Treasury yields higher than longer-term Treasury yields).
Now, this does not mean rush to the equity market exit doors. The stock market generally rises after a yield curve inversion. That’s happened four out of the last five times with the average gain approximately 17% over approximately six months. It is also notable that recession followed just over a year after inversion. None of this guarantees that this time will take the same path but it is worth noting. It doesn’t guarantee us anything this time. It does mean keep your lights on and maybe step a little bit closer to your defensive coordinator with game plan in hand. There is a lot of overconcentration in those FAANG stocks and note that many cap-weighted indices, by rule, own a greater percentage of them in their passive indices. Similar to tech in 1999 and financials in 2007. We humans tend to chase into the same things, which drives prices higher and valuations to unsustainable levels. Eventually, a panic cycle follows and we humans tend to do dumb things when we feel fear.
Accordingly, I suggest we keep an eye on the Zweig Bond Model (a trend-based process), as it does an excellent job of signaling for high quality bond funds and ETF exposure (see Trade Signals section below). The yield curve is inverting, a common precursor to recession.
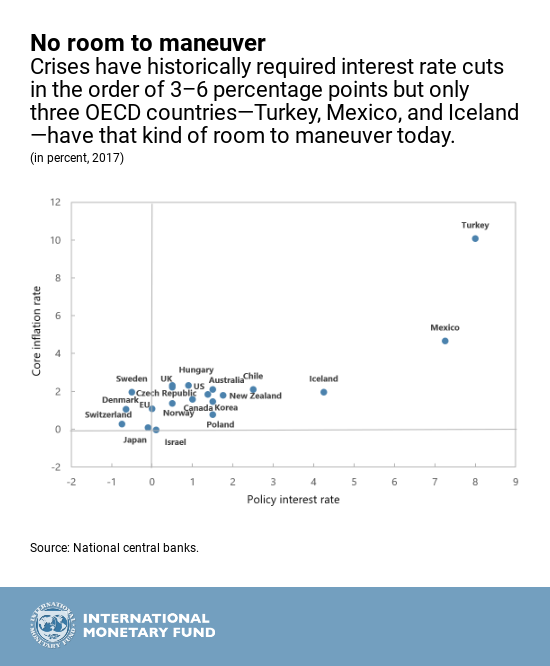
The next few charts are from “Cashing In: How to Make Negative Interest Rates Work,” by Ruchir Agarwal and Signe Krogstrup of the International Monetary Fund (IMF). First, note how low interest rates are everywhere… this is our current starting position. Hat tip to good friend and advisor partner, Jeff Kennedy, for sharing a link to a recent IMF report recommending a “cashless” society and negative interest rates when the next recession crisis hits. Commenting something like, “Yikes!”
From the IMF report: “One option to break through the zero lower bound would be to phase out cash. But that is not straightforward. Cash continues to play a significant role in payments in many countries. To get around this problem, in a recent IMF staff study and previous research, we examine a proposal for central banks to make cash as costly as bank deposits with negative interest rates, thereby making deeply negative interest rates feasible while preserving the role of cash.”
This chart shows just how much cash is out there per country in terms of cash relative to the country’s GDP.
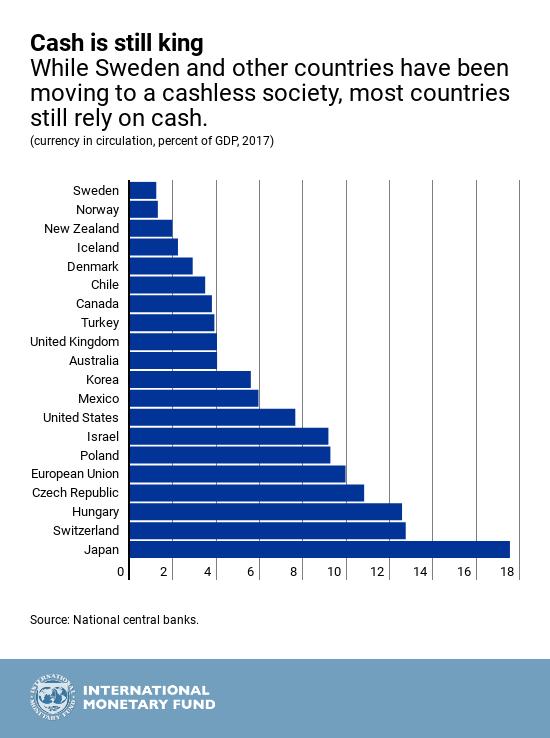
Here is the full report… Maybe don’t read it unless antidepressant is in hand. Unless you favor negative returns on your cash… Yikes, indeed.
“Beyond the Yield Curve Inversion,” by Louis-Vincent Gave and Charles Gave
Last week’s inversion of the US yield curve raised the specter of an approaching recession in the US, and by extension, of global recession.
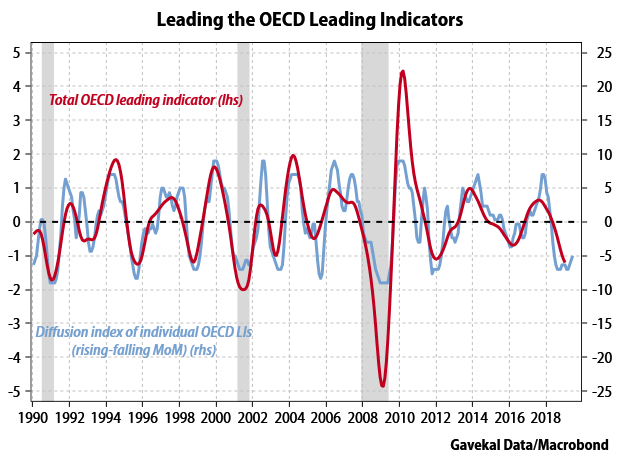
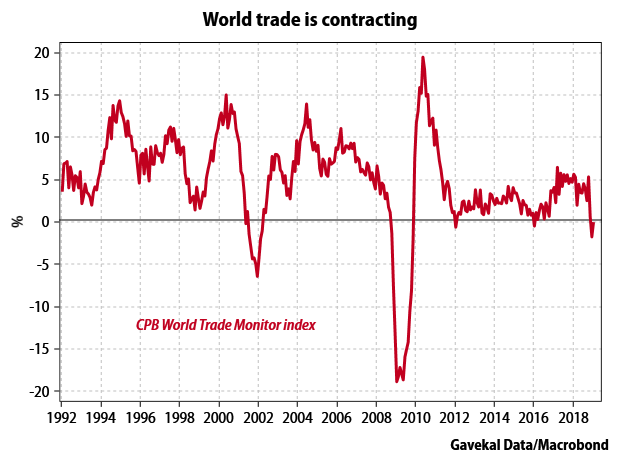
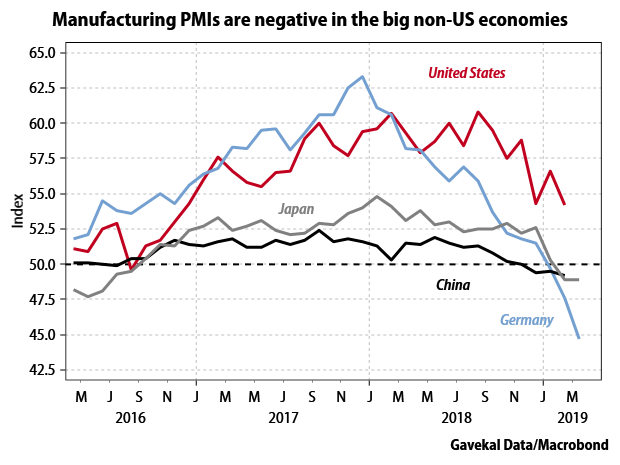
Unfortunately, the inversion of the US yield curve isn’t the only sign that global growth is at risk. Consider the following:
- The OECD leading indicators are in negative territory.
- Global trade is shrinking (never a great sign).
- Manufacturing PMIs are below 50 in three of the four biggest economies in the world.
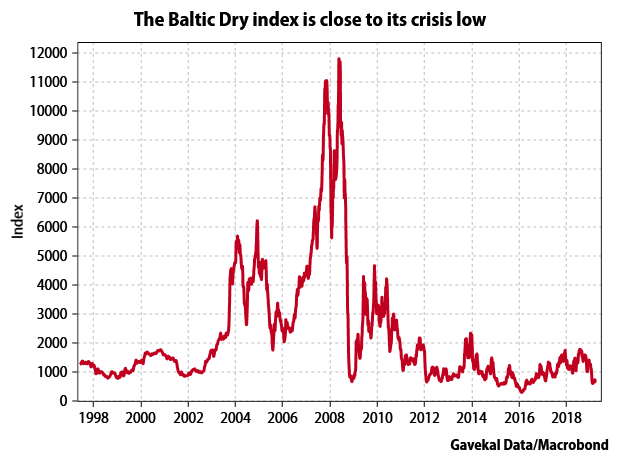
- The Baltic Dry index is close to its crisis lows.
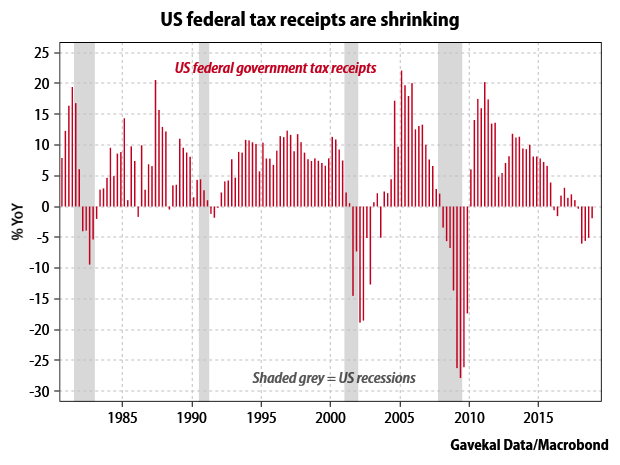
- US tax receipts are shrinking, which is something that usually only happens in recessions (of course, the US has just enjoyed a sizable tax cut, but to a true believer in the Laffer Curve, all else being equal, that should see revenues increase, not fall).
We could go on, but suffice to say that most recent economic data has been somewhere between “soft” and “disappointing”. And in one sense, this is odd. Our starting point is that there are four prices which tend to have an outsized impact on both financial assets and economic cycles. These prices are: (i) long bond yields, (ii) corporate yield spreads, (iii) the price of oil, and (iv) the value of the US dollar. What is interesting is that today none of these prices is sounding much of a warning signal.
Consider the following:
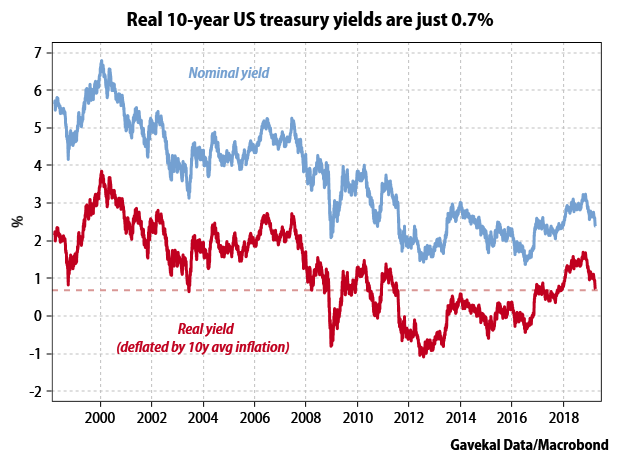
- Bond yields remain low everywhere. In the US, real yields are now back at 0.7%. That’s higher than at any point during the European crisis between mid-2011 and the end of 2016. But still, a 0.7% real yield should not be a serious brake on the economy.
- In spite of record high corporate debt, corporate spreads remain within their historical range (even if they did start to creep up in 2018).

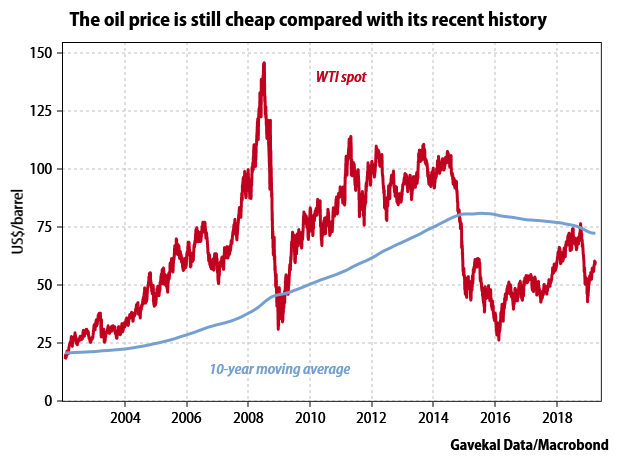
- In 2018, oil prices gave back all the gains they made in the first half of the year in the second half, and then some. At US$60/bbl today, oil is some US$12/bbl below its 10-year moving average.
- For the last few years, the US dollar has been remarkably stable, staying in a relatively tight trading band since 2015.
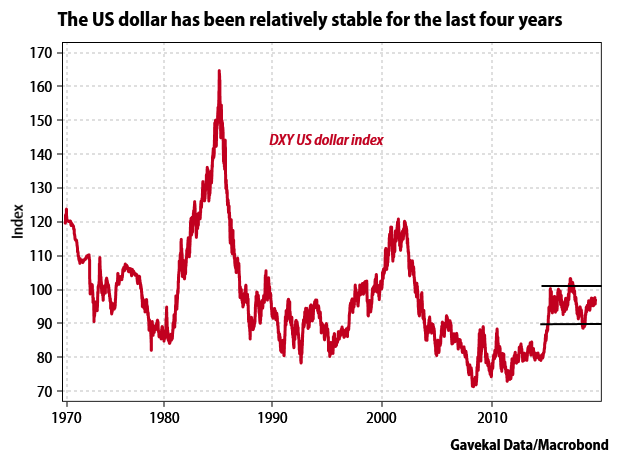
In short, as things stand today, we see none of the “usual” markers that typically precede a recession: no oil price spike, no significant move higher in real rates, no blow-out in spreads, no major disturbance in the foreign exchange market. Yet global growth is uninspiring. So, what (if anything) is acting as a brake on global growth? And what are the investment consequences likely to be?
Scenario #1: There is no brake
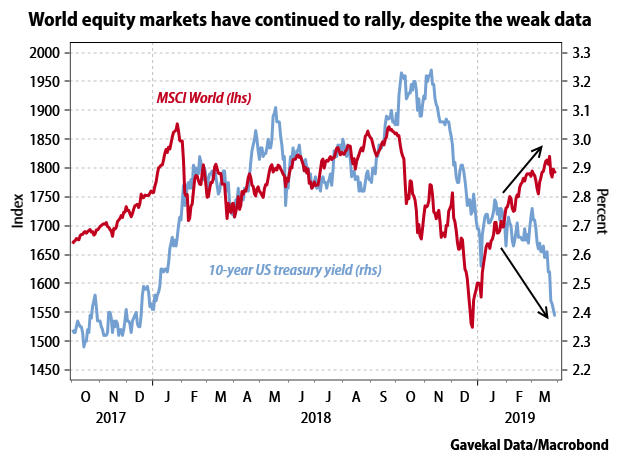
The first possibility—contrary to what we’ve suggested above—is that there is nothing acting as a brake on the global economy, and that the recent softness in the data is just noise. To some extent, this is the message being sent by global equity markets, which have continued to rally in the face of weaker economic data and earnings downgrades.
The consequences of scenario #1: If this really is the case, and the recent economic softness proves to be nothing more than a “pause that refreshes”, then the year-to-date gains on government bonds around the world could vanish even faster than they appeared. After all, if it turns out that growth is no longer deteriorating, why should some US$10trn of outstanding government debt trade at negative yields? So, just as yield curves have undergone a massive flattening in recent months, the realization that global growth is not collapsing should trigger a sudden sharp steepening of yield curves once again.
Our take on scenario #1: The message from global equity markets is a powerful one. And there are some supporting signs—copper prices, the relative underperformance of non-cyclicals—that growth is holding up. Moreover, anecdotal evidence continues to suggest that economies are “humming” along. So, this “no brake” scenario cannot be dismissed out of hand. Instead, the easiest way to position portfolios for this scenario might be to overweight underowned, undervalued and unloved financials. After all, if global growth isn’t going to fall apart, and if long bond yields have therefore finished falling, then perhaps we should look for a repeat of what we saw in the summer of 2017, with financials once again experiencing a (short-lived) moment of glory.
Unfortunately, things may not be that simple…
Scenario #2: The brake is politics
A second possible reason why global activity is slowing despite the absence of the usual “brakes” is that this time around the global economy is evolving in a much more uncertain environment. Over the past year, the typical corporate CEO has had to face up to:
- Fears of a global trade war centered on the US-China relationship, but which could quickly escalate to encompass the US-Europe relationship.
- Renewed fears about Europe’s structural integrity following the formation of the populist Five Star and Lega coalition in Italy,
- Brexit uncertainty,
- A flare up in tensions between India and Pakistan, which brought the two nuclear-armed countries perilously close to war,
- And the far-fetched accusation in Washington DC the US president was actually a Manchurian candidate in the pocket of Vladimir Putin.
Against this backdrop, it would be no great surprise if companies delayed major investment decisions, causing growth to slow.
The consequences of scenario #2: If global growth really is slowing because of political uncertainties, then the slowdown should prove relatively shallow, because it would not be the result of past excesses being worked through. In this case, the big question would be whether the uncertain political environment is likely to change any time soon? Although the Mueller investigation has now wrapped up, the average CEO continues to have very little visibility on Brexit (which increasingly resembles something out of Monty Python), on US-China trade talks, or on the future of Europe.
In short, it is not obvious what is likely to change in the near term to remove the negative political dynamics. Sure, China and the US may well arrive at some sort of agreement on bilateral trade relations. But would such an arrangement mean the end of the global trade war threat? Or would it just see Trump’s trade guns retraining towards Europe?
Our take on scenario #2: CEOs who do not want to invest can always find political reasons not to do so. The world is an uncertain place. Take the early 2000s as an example. With the rise of Islamic terrorism, the Afghan and Iraq wars, the regulatory blowback from the Enron and WorldCom scandals, the SARS outbreak, there were lots of reasons for CEOs to keep their hands in their pockets. Yet, global growth was strong.
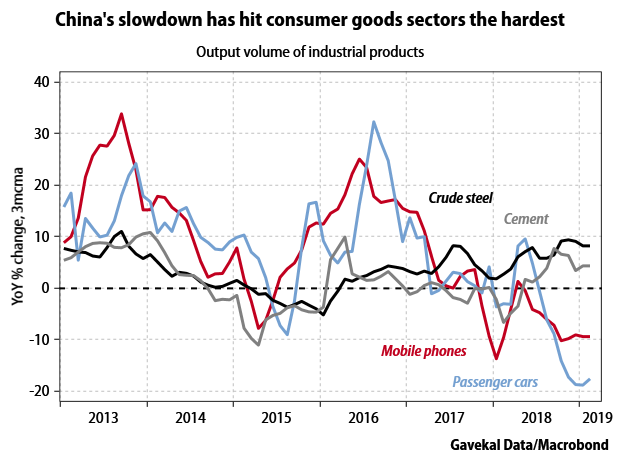
Another reason to be skeptical about the “it’s the politics” explanation is that in a number of countries the unfolding slowdown seems to have less to do with CEOs keeping their hands in their pockets than with consumers keeping their pocket books firmly closed. Consider China: while construction and the industries linked to real estate, such as cement and steel, have held up relatively well, the sales of mobile phones and passenger cars have plummeted.
Still, if political uncertainty really is the reason for the current growth slowdown, then the correct approach would probably be to fade the concerns, which is exactly what the equity markets (although not bond markets) appear to be doing.
Scenario #3: The brake is industry-specific headwinds
As the chart above shows, in China (as in a number of other countries), auto sales and smartphone sales have been disappointing. One question for investors is whether this weakness is cyclical (but why would it be at a time of low interest rates and low unemployment?) or structural. There is some evidence for the latter. When it comes to cars, it seems that in some countries, millennials are no longer passing their driving tests in the same numbers as their parents (choosing to use ride-sharing apps instead). Meanwhile, older drivers may be holding back from purchases out of a fear that today’s cars will turn out to be as valuable as a Ford Pinto when a new generation of electric/hybrid/self-driving cars is rolled out in the coming years.
Meanwhile, on the smartphone side, the lack of new killer features means that the latest models are essentially the same as three-year old smartphones. Sure, the cameras are better, and the screens display colors more sharply, but as the sales figures indicate, these incremental improvements aren’t enough to persuade consumers to dig deep into their pockets.
In short, we are living in a world where (i) the auto industry is struggling with some significant headwinds that could last for years to come, and (ii) the tech sector hasn’t brought out a must-have killer new product for several years. Given the size and importance of these two industries, maybe their respective slowdowns help explain the unfolding global slowdown.
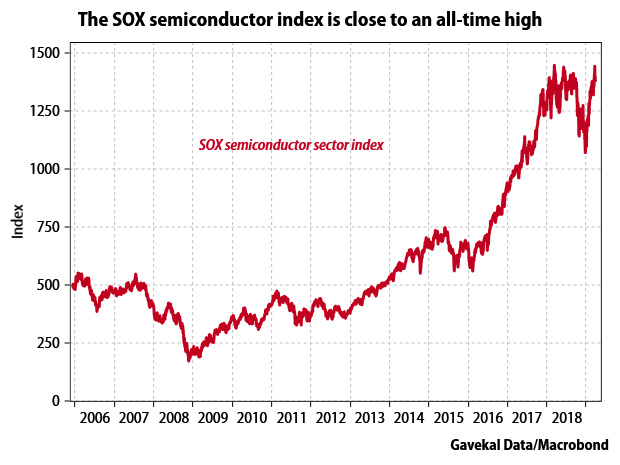
The consequences of scenario #3: Looking at the share price performance of the broad auto sector, and the share price performance of companies in the technology hardware industry (mostly in Asia), there seems to be some truth to the “sectoral headwinds” argument. But then, if both autos and tech hardware are struggling, why are semiconductor stocks (as measured by the SOX index) testing all-time highs? If one believes that “Dr. DRAM” has supplanted “Dr. Copper” in our new, knowledge-based, economy, the recent sharp rebound in semiconductor stocks could be seen as encouraging (and would bolster the case for scenario #1).
Our take on scenario #3: There is no doubt that the auto industry is facing a challenging time. And there can also be little doubt that the tech industry lacks a new must-have product (this much was underlined by Apple’s launch this week of… a credit card!). This combination may be lethal for growth in a number of countries (Germany? Japan? South Korea?).
Take Germany: an old saying tells us that the German economy is a stool resting on three legs: regional banks, the auto industry and the chemical industry. But what happens if the chemical industry becomes uncompetitive—because the US natural gas price is now less than half the price of Russian natgas price in Germany—and at the same time, the auto industry hits a nasty speedbump?
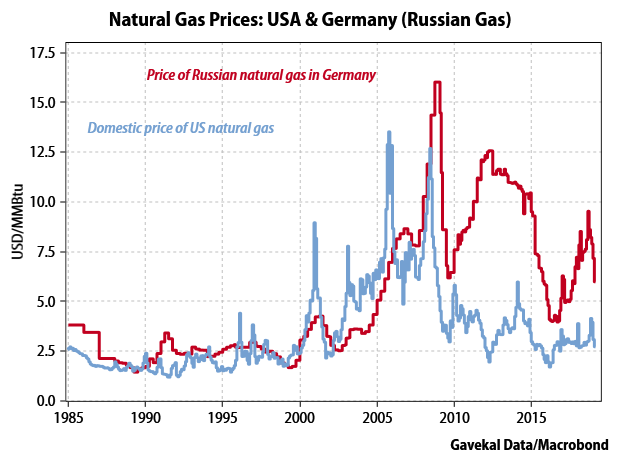
Will German banks have enough capital to help their industrial clients through the rough patch? Clearly, the fact that German banks are being pushed by Berlin to merge answers this question.
This brings us to scenario #4.
Scenario #4: We are entering a secondary depression
In the deflationary 19th century, economists often spoke of “secondary depressions”. Back then, the driver of the economy—more than consumption—was capital spending. This was never more true than during the railway boom of the 1870s. As railroads were built, economies underwent a massive boom. The demand for steel, for cement, for copper, for coal simply soared. This demand lead to massive increases in capacity, in part because there was a “double” demand for many of these products.
Consider steel: first, there was enormous end-user demand for steel to build all the new machinery and infrastructure. Second, there was heavy demand for steel from the steel industry itself, which needed steel to build the steel-making capacity to meet all the end-user demand. As a result, when end-user demand finally plateaued, or worse still started to go down, the steel industry found itself left with massive overcapacity. This led to a collapse in profits, to bankruptcies, and to economies falling out of bed. This was what economists of the time would call the “primary depression”.
Invariably, after the “liquidation phase” triggered by the primary depression, after some time (usually two to three years) the affected economies would find their footing, and markets would rally. Unfortunately, these rallies proved to be false dawns, as the realization set in that final demand for steel (or coal, or copper, or cement) was now in a structural decline. Activity then entered what 19th century economists called the “secondary depression”. On average, these lasted around 10 years. For example, the US entered into a primary depression in 1873, and only came out of its secondary depression in 1896.
Fast forward to today: in the last 20 years, China has gone through the biggest capital spending boom in history. As a result, shouldn’t we suspect that the “capital investment” industry might have overbuilt?
And shouldn’t we also worry that the countries that fed China’s capital spending boom and benefited from it—China itself, but also Germany, South Korea and maybe Australia—will now have to deal with the consequences of the roll-over in Chinese capital spending? With this in mind, could we be seeing the start of a primary depression in countries such as Germany? And if so, shouldn’t we be troubled that this slump is beginning when banks are already in a precarious position.
One of the “deflationary bust” indicators we like to follow is the relative performance of banks. When a country enters a deflationary bust, banks tend to fare worse than any other asset class, if only because banks tend to be leveraged plays on economic activity and asset price inflation. With this in mind, we find it particularly alarming that since January 26, 2018, banks in the eurozone are down -36%, and are now at a critical technical level.

The recent deterioration in the value of European bank shares raises the question whether the Federal Reserve’s policy U-Turn was driven by (i) pressure from the White House, perhaps in a bid to secure a second Plaza Accord with China, (ii) the recent softening of global growth and inflation data, or (iii) the possibility of a real financial accident in Europe. Of course, it could be all three. But the fact remains that European bank stocks are now at a critical juncture. Either they rebound from here or investors will need to start pricing the odds of some kind of a banking cataclysm in the eurozone.
The consequences of scenario #4: If we are entering a secondary depression centered on a structural decline in capital spending, then obviously investors should avoid financials, cyclicals, and any high-beta stocks. Instead, portfolios should be focused on yield strategies.
And we should make no mistake about it: a secondary depression now would be especially scary because it would unfold with interest rates at or close to record low levels, budget deficits almost everywhere already wide, and government debt in most countries reaching new highs. Of course, any significant slowdown will be met by more of the same: more central bank easy money and more government debt. Although, unfortunately, it seems that the multiplier effects from such policies is really not as strong as policymakers had hoped (more on this later).
Our take on scenario #4: A secondary depression is the most bearish scenario and would be the main reason to own government bonds today. Clearly, we are at a crossroads: if the economic data continues to deteriorate, and if financials continue to underperform, then the odds of this scenario will increase markedly. But this would bring us back to our “four prices that matter”. If a secondary depression’ were to unfold, spreads would widen meaningfully, and (although this is less certain) the US dollar could well fall (as the Fed eased policy and the US budget deficit widened even further). So far, neither is happening—although both prices should be monitored closely.
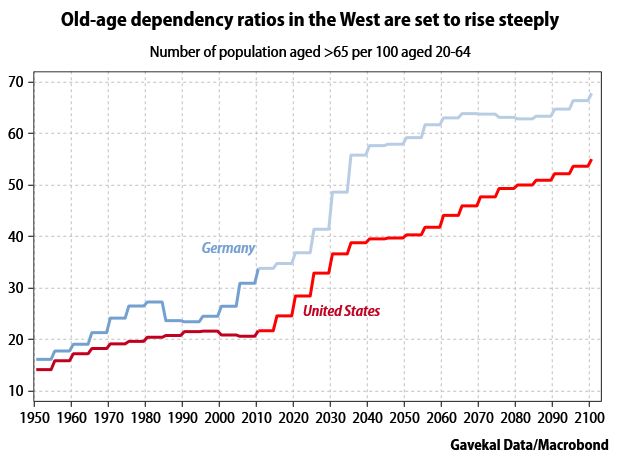
Scenario #5: As societies age, growth will remain lackluster
Economic growth is made up of productivity gains and population growth. Now, as everyone knows, population growth in most Western and East Asian countries, has either slowed to a trickle, or even moved into negative territory. This alone would account for a weaker growth environment. Less well understood is the effect that an aging population might have on an economy’s productivity growth.
Of course, both Charles and Anatole would argue that being in your 60s and 70s is the new 40. For some, that is undeniably true. Better diets, better medicine, and healthier lifestyles mean that baby boomers can remain productive members of society for far longer than their own parents did. But can the very large cohort of retiring baby boomers be as productive, or as entrepreneurial, or as creative, as people in their 20s, 30s, or 40s?
Anecdotal evidence would suggest “probably not”. Charles likes to point out that Sam Walton was 52 before he took Walmart public, and became anything more than a small local retailer. But, almost all of the corporate behemoths that are changing the face of business today—Google, Facebook, Amazon, Alibaba, Apple, Tencent, Microsoft, etc.—were founded by visionaries in their 20s, 30s or (at most) 40s.
Beyond the creative urges of an aging society, the bigger question may concern the allocation of resources in the aging, democratic societies of the West. Take the UK as an example. When he was first elected prime minister, David Cameron’s earliest policy moves were (i) to guarantee and boost state pensions, while (ii) simultaneously introducing tuition fees for university students, who until then had enjoyed free tertiary education. Obviously, the political calculus was that there were more votes to be won pandering to Britain’s aging voters than to its youth. Perhaps this calculus made sense politically… but economically?
So, was Cameron’s decision to invest in old people rather than the young a one-off? Or is it likely to become the norm as all Western democracies age?
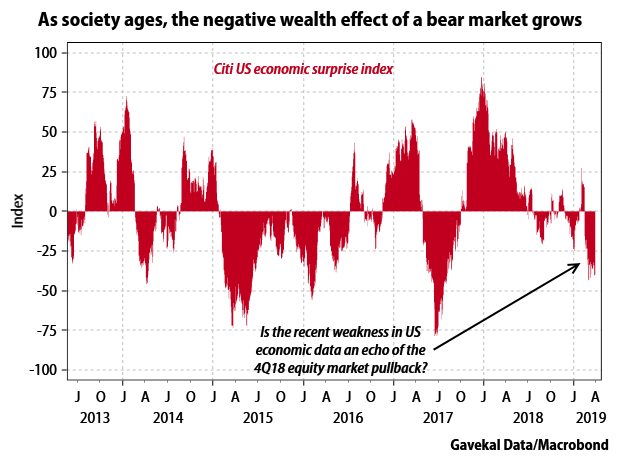
The consequences of scenario #5: If today’s low growth reflects the unfolding demographic transition, this raises an important question: Can the investing public withstand a bear market? When you are 35 years old, and starting out on the “savings towards retirement” path, an equity bear market is a blessing. It allows you to buy more stock at a cheaper price. Over the long term, that can only be good news. But unfortunately, when you are 70 years old, the opposite is true. At this advanced age, a bear market can prove a disaster that wipes out a significant portion of your retirement savings, if your savings are invested in equities. The reason we highlight this simple fact is that, in the US at least, households have seldom been more heavily invested in equities than they are today, both in absolute terms, and as a percentage of total assets.
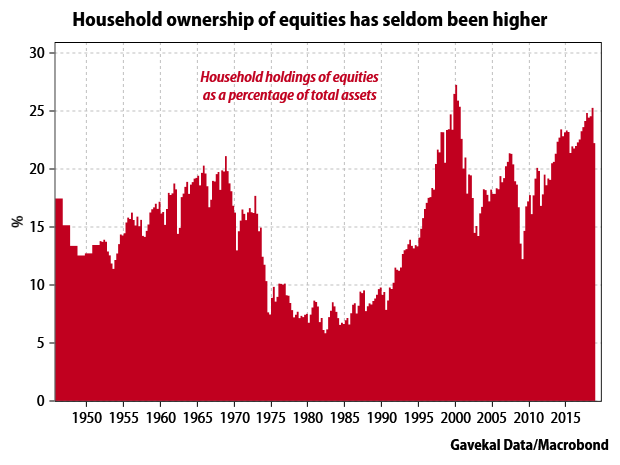
You have go back to the height of the 1999-2000 tech bubble to find household equity holdings comparable with today’s. But since then, the population has got older, and it will get older even more quickly from here—the US now gains some 3mn people over 70 years old each year. This means that the ability of the final investor to withstand any kind of downward equity price shock is much lower than it was a couple of decades ago. Perhaps this helps to explain the recent weakness in US consumption data and overall US growth. The fourth quarter of 2018 delivered very poor equity market returns, and almost immediately consumption fell back, and the economic data promptly softened.
Putting all this together, we could conclude that (at least in the US) we live in a world where:
- The federal government, and also state and local governments, have so much debt that it is almost impossible for the Fed to raise interest rates without triggering some serious fiscal policy problems.
- Corporates have so much debt that when interest rates start to rise, an economic slowdown may not be far behind.
- Individuals are getting older, and are so exposed to equities that their ability to withstand even a modest bear-market is limited.
If all this is true, then—just as we have seen in Japan—the aging of our societies may mean that interest rates will have to stay low forever.
Our take on scenario #5: It seems increasingly clear that Europe is going down the full Japanification path (but with a lot less social cohesion) and that European interest rates will not be able to rise for a long time, if ever. But is the US really that different?
This week, Fed board nominee Stephen Moore declared that the Fed needed to cut interest rates by 50bp. Usually, cuts of more than 25bp only occur during crises. But where is the crisis today? Sure, growth is slowing. But the S&P 500 is only -4% off its all-time high, spreads are tight, and unemployment is within a whisker of its 50-year low. That hardly suggests crisis conditions.
Conclusion
The current economic slowdown is an odd development. Logically, with cheap oil, low interest rates, tight spreads and a stable US dollar, the global economy should be booming. But it is not. From here, you can come to one of two possible conclusions.
- The economy is going through some kind of soft patch: maybe a mid-cycle slowdown, or maybe just a speedbump linked to political uncertainty. But whatever the reason, it won’t last and soon growth will be roaring again.
- This time it is different.
In the first scenario, you would want to fade the recent rally in US treasuries (and German bunds, and Japanese government bonds…), and the punchiest way to do that would be to own financials.
In the second scenario, you have to confront the question: Why should things be different this time? We have suggested three possible reasons:
- Growth is weak because of structural problems in a number of key industries. This is not ideal but it also doesn’t need to be a disaster outside these specific industries.
- Growth is weak because of the demographic shift that most Western and East Asian countries are undergoing. Again, this is not ideal, but it also doesn’t need to be a disaster. The demographic shift constrains monetary and fiscal policies, but it need not lead to structural bear markets.
- Growth is weak because of the unfolding of a secondary depression. The capital spending boom that China unleashed has now come to an end, and this means that a lot of investments need to be written off. Meanwhile, over the past 10 years, low interest rates meant that we kept bringing tomorrow’s growth forward to today. Unfortunately, we may now have run out of tomorrow’s growth, and are about to start to regret eating today’s growth yesterday.
Of these three negative scenarios, the first and second seem the most likely to us, if only because the third secondary depression scenario should be accompanied by a deterioration in corporate spreads (and eventually, by a possible collapse in the US dollar). Today, we are simply not seeing this deterioration in spreads. Therefore, investing along the lines of the first two scenarios—avoiding structurally challenged industries, while simultaneously positioning portfolios for a continuation of ultra-easy monetary policies from Western central banks—makes the most sense. But if spreads start to widen, then the odds of the last scenario will go through the roof—and the price of most financial assets through the floor.
* * * * *
SB here: I believe that last sentence holds the key, “But if spreads start to widen, then the odds of the last scenario will go through the roof—and the price of most financial assets through the floor.” What “spreads start to widen” means is that the yield on high yield bonds move up much higher than yield on safer bonds, such as high grade corporates and Treasury bonds. That happens in recession.
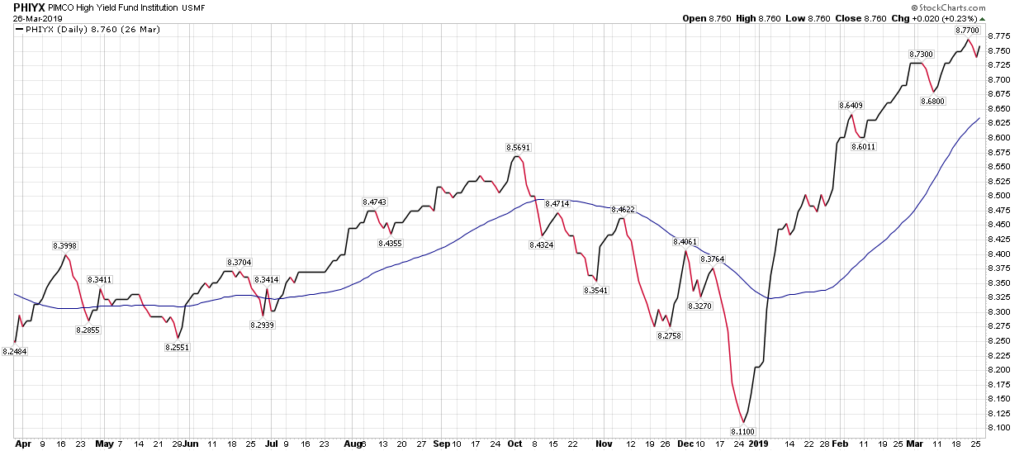
To which, take a look at the High Yield bond chart in the Trade Signals I share with you next. I believe it may be the most important chart for us to keep on our radars. There are a number of other high yield bond funds and ETFs but simply following the price trend in a large diversified fund like PIMCO HY can be helpful. (I explain more in the Trade Signals section immediately below.)
A special thank you to Louis for allowing me to share his latest client letter with you. Louis will be presenting at the 2019 Mauldin Strategic Investment Conference. I do love the thoughtful way he thinks around multiple alternatives. You can learn more about his research here. Hat tip to my partner, John Mauldin.
Trade Signals – Data Dependent, Process Driven, Risk Management
March 27, 2019
S&P 500 Index — 2,797
Notable this week:
The High Yield Bond Market Holds the Key
I have been trading the trends in the high yield bond market for more than 25 years. Over this period of time, as they say in the Farmers Insurance commercials, I’ve learned a thing to two. First, watching HY price trend is boring. Movement is slow. It’s a bit like watching paint dry but important nonetheless.
There are some obvious insights: Investor returns are best when yields are highest (prices are low). Returns are lowest when yields are lowest (prices are high). The best opportunities set up after periods of recession. The riskiest periods are in recessions. That’s when defaults rise. You can imagine that lesser quality companies (highly indebted) can get in trouble and many go bankrupt.
And perhaps some less-known insights: As a general rule, the HY market tends to be a leading risk-on/risk-off indicator for the equity market and both the HY market and the stock market tend to be excellent leading indicators for the economy (expansions and contractions). Signals become most important when the economic cycle is aged and equity bull markets mature. As Louis-Vincent said, “But if spreads start to widen, then the odds of the last scenario will go through the roof—and the price of most financial assets through the floor.” I think he is spot-on and that’s where I believe watching the HY trend (and taking appropriate action) can help.
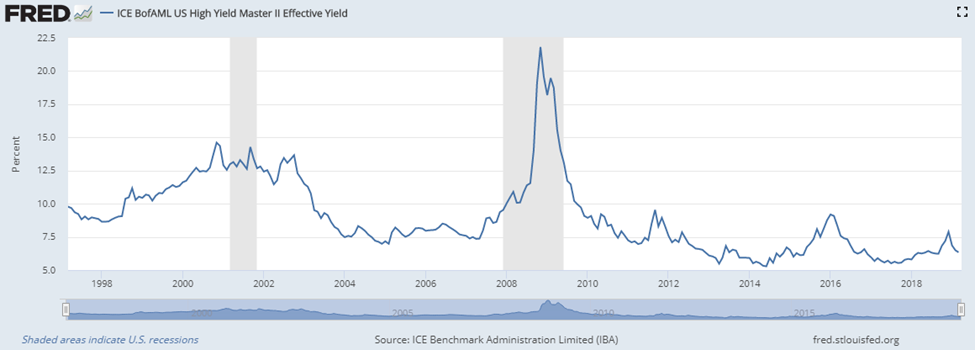
The next chart plots the yield of the Bank of America Merrill Lynch High Yield Index. Notice in 2008, prior to the great recession, yields were 7.5%. In the recession, they spiked to over 20%. The grey shaded areas show recession. That was an awesome buying opportunity in late-2008 and 2009 assuming you properly managed to avoid the crash in price.
The next chart plots the price trend of the PIMCO HY mutual fund. Think of it as a proxy to measure the trend in the HY space. You could use the BoAML price index or a large HY ETF or combine several of them. My two cents is following a large broad fund that owns HY cash bonds (not HY derivatives) or several of them works just fine. Here is how to use trend as an indicator: The solid blue line you see is a simple 50-day moving average price trend line. The squiggly line is the plotting of price each day. When the price is above the 50-day trend line, a bullish signal is generated. When the price drops below the 50-day trend line, a bearish signal is generated. (Bottom line: current HY is in a buy signal).
There are a few other subtleties; for example, I remove the dividend from the equation in plotting price. The above chart doesn’t do that… Key is to focus in on just the price. You can find HY price indices on Bloomberg. Also, it is important to note that not every bear trend signal leads to a recession and there are a number of head fake trades along the way, but overall given the late state of the current economic cycle and aged nature of the equity (and HY) bull markets, zeroing in on HY trend, I believe, may just be the most important indicator for us to follow. If you’ve got the guts, a great short opportunity lies ahead. I don’t trade the short side, as one must pay the yield carry away and that cost (currently a yield on the BoAML HY Index of 6.34%) can make the head fakes expensive. I do believe and will continue to message my excitement: The next great buying opportunity will be epic! Data Dependent, Process Driven, Risk Management…
Click here for this week’s Trade Signals.
Important note: Not a recommendation for you to buy or sell any security. For information purposes only. Please talk with your advisor about needs, goals, time horizon and risk tolerances.
Personal Note
Austin, Texas is up next. John Mauldin and I are presenting Wednesday evening and then again Thursday evening at a dinner event in Dallas. We’ll be talking about how we believe the debt will be reset, the likelihood of a beautiful outcome, the bumps we’ll encounter, what we see, what we might not be seeing and the overall timing for what John has coined, “The Great Reset.” It is a discussion that will be hosted and moderated by our partner Joe Quartucci and his team at e3 Wealth. There are a few seats available in Austin, but I believe the Dallas dinner event is sold out. If you would like to attend (or get on the Dallas wait list), you can sign up here.
The Mauldin Strategic Investment Conference follows May 13-16 in Dallas. David Rosenberg will once again kick off the conference on Tuesday morning, May 14. I’ll be moderating a discussion with the Economic Cycle Research Institute’s Lakshman Achuthan and Peter Boockvar, CIO of the Bleakley Financial Group. Both are Camp Kotok fishing friends. If you are curious about the conference agenda, speakers, etc., you can find more information here.
I just looked at the weather app and it’s showing 71 degrees for tomorrow. That forecast, to me, sounds like some golf could be a good idea. And much to do around the house. One of my favorite days is when the patio furniture is pulled out from storage. Susan’s telling me not tomorrow. So golf it is. And April is almost here… It’s been a long, cold and wet winter. Here’s a toast to spring!
Wishing you a fun-filled weekend!
Best regards,
Stephen B. Blumenthal
Executive Chairman & CIO

