
Here’s some of the standout economic and markets charts on my radar (originally posted on LinkedIn). I aim to pick a good mix of charts covering key global macro trends, and ones which highlight risks and opportunities across asset classes.
Q1 hedge fund letters, conference, scoops etc
Hope you enjoy!
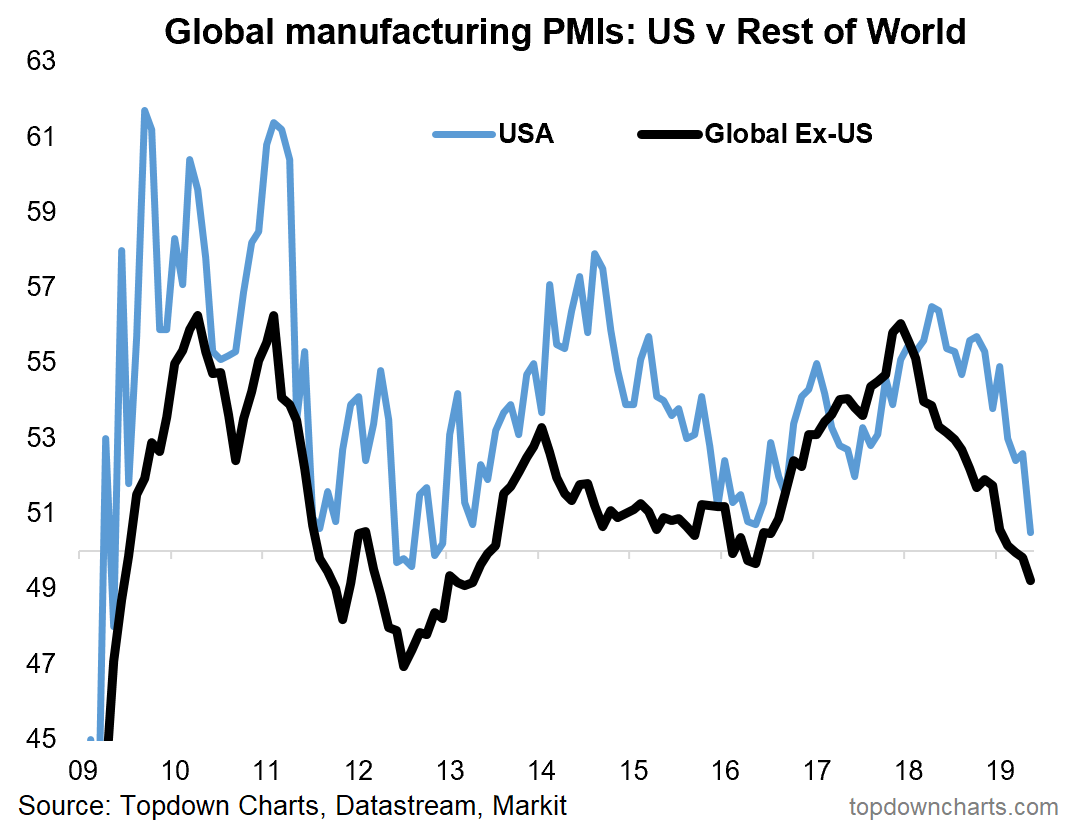
1. Manufacturing PMIs — USA vs the World:Well it’s June already, and you know what that means… PMI time! The May round of PMI data showed the Global ex-US manufacturing PMI drop deeper into contraction and the US swiftly catching down.
So, I guess now we have the answer as to whether the US can go it alone…
With the global growth scare still in full swing, it only adds to the case for a global policy pivot (and as discussed on Friday, it’s already underway).
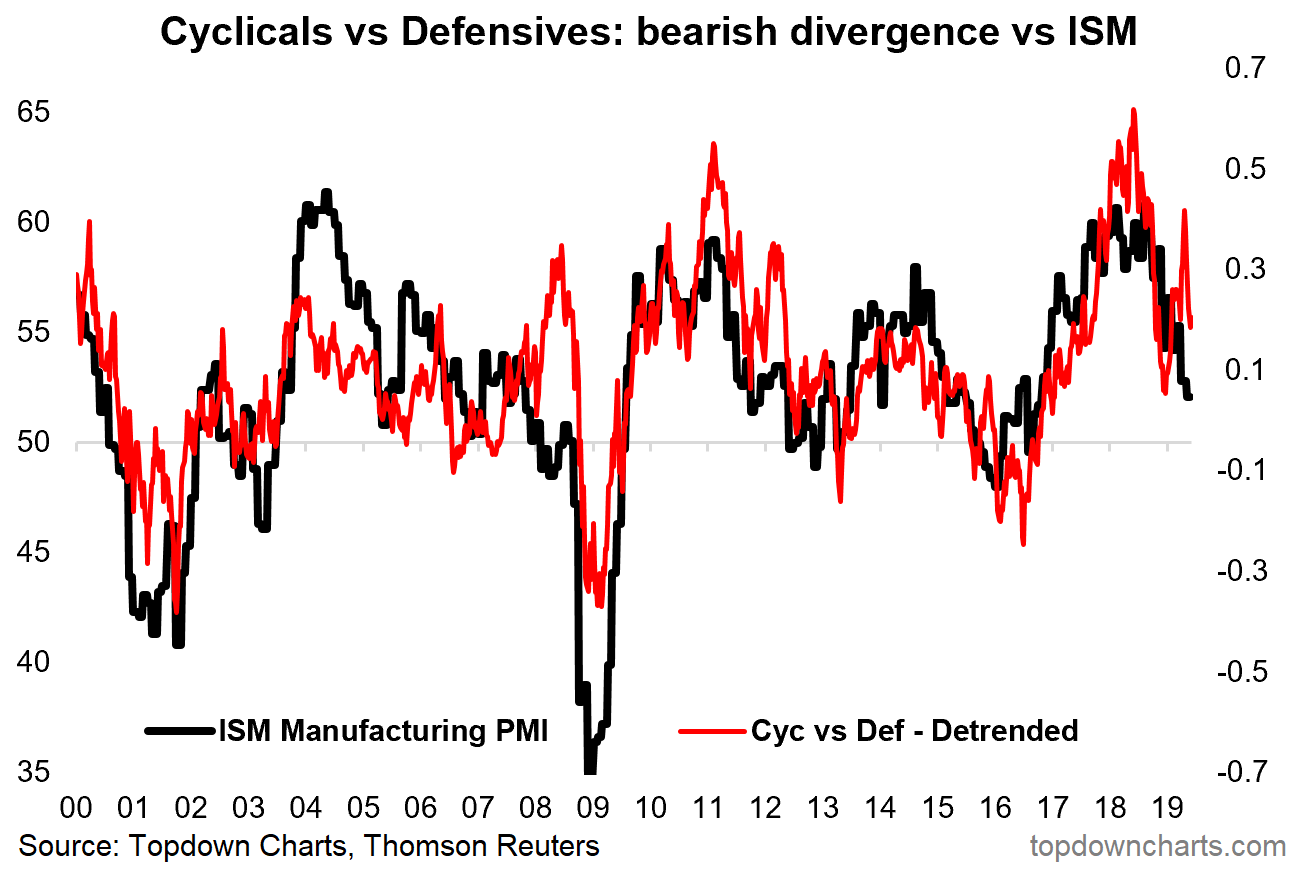
2. US Cyclicals vs Defensives and the ISM: On the USA, one direct implication of a weaker manufacturing PMI is that it puts cyclicals at risk of further downside (if the historical relationship in the chart below is anything to go by).
The problem with this is that cyclicals have been in the driving seat for US equities, so all else equal (it rarely is though) this arguably points to possible further short-term downside for equities.
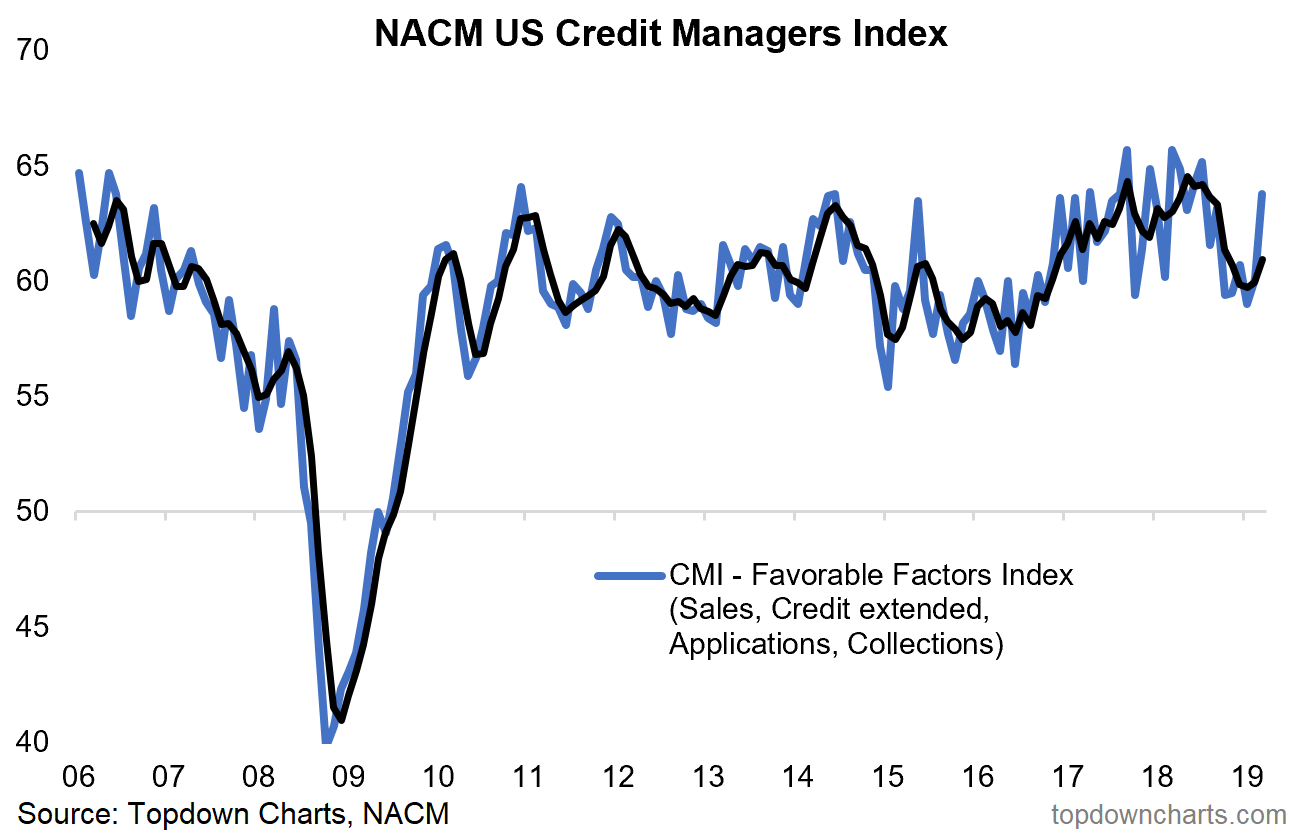
3. The CMI — Credit Managers more optimistic: I like poking around in obscure and non-mainstream datasets, and here’s a good example. This chart shows the “Favorable Factors Index” of the NACM CMI (i.e. the Credit Managers version of the PMI).
While it is indeed a volatile indicator, it’s interesting to note the big jump in this index in May (and the contrast against the PMI above). Seems like credit managers are telling us things ain’t as bad as some of the headline figures would make it seem. As usual with this sort of thing, we’ll need to wait and see the June reading to know whether it’s just a blip or a true nascent sign of resurgence.
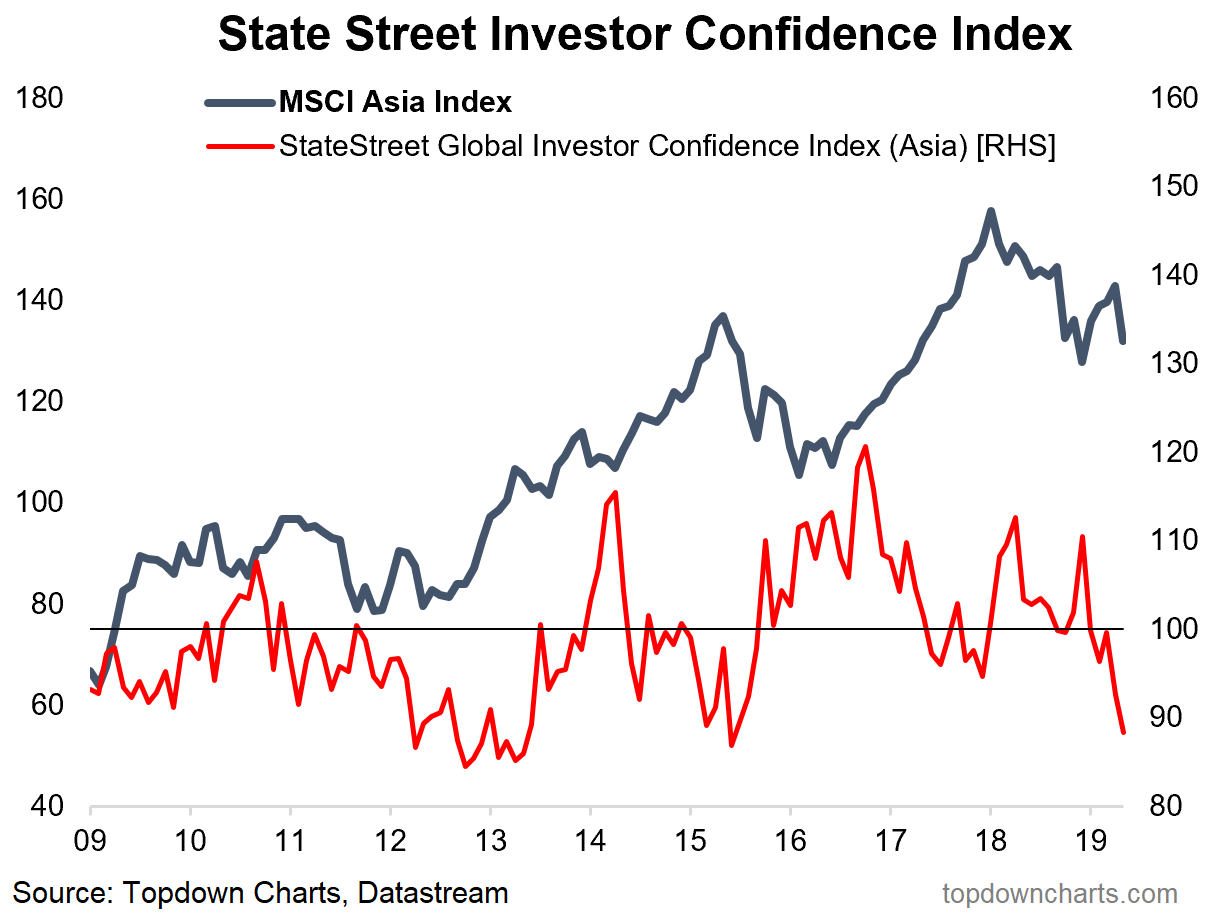
4. Institutional Investor Confidence Plunges in Asia:This next one shows the State Street Investor Confidence Index for Asia (State Street builds these indexes off their giant global custodian business, and thus it is based on actual activity by asset managers and institutional investors). Key point is Asian investor confidence has plunged.
No doubt the trade war is a key source of concern (along with a softer global growth pulse). Usually investor sentiment should be read as a contrarian indicator, but from first glance these guys seem to have had some luck in buying the trough and selling the peaks. We’ll soon find out if it’s different this time…
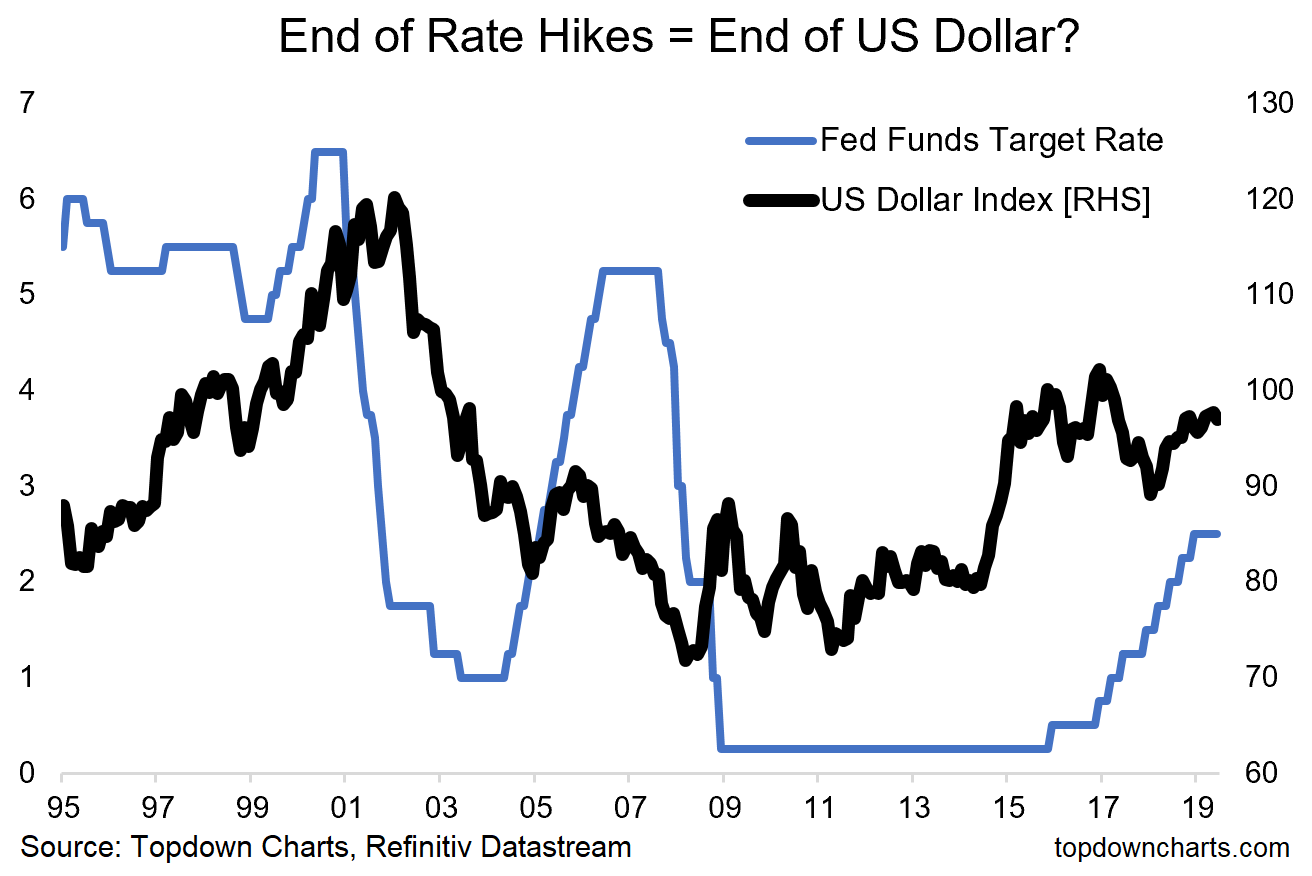
5. Fed in Transition = Dollar in Transition:Last but certainly not least, consensus is quickly shifting to expect Fed rate hikes, possibly as early as Q3 or early Q4. If you look at the PMIs I guess you can have some sympathy with that view.
Regardless, let’s assume the Fed does pivot to cuts in the near term. History seems to show that eventually rate cuts can help trigger off US dollar weakness. So maybe a 2019 Fed rate cut will spell the start of a US dollar bear market… that’s not consensus.
Thanks for reading, I appreciate your interest in my work.
This article was originally posted by me on LinkedIn. Be sure to connect with us there too.
Article by Top Down Charts

