
Here’s some of the standout economic and markets charts on my radar (originally posted on LinkedIn). I aim to pick a good mix of charts covering key global macro trends, and ones which highlight risks and opportunities across asset classes.
Q1 hedge fund letters, conference, scoops etc
Hope you enjoy!
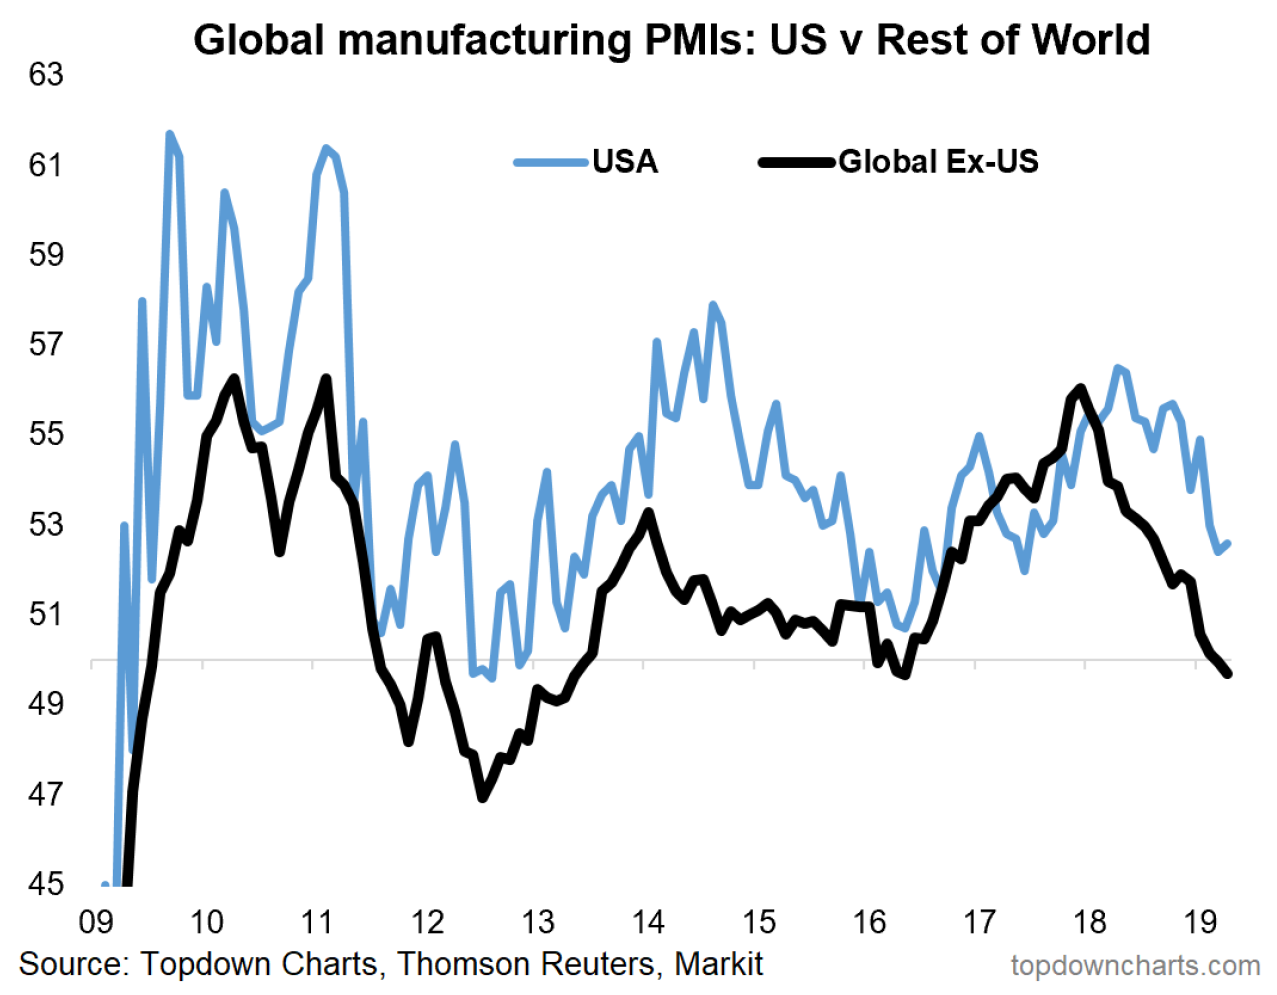
1. US vs the World:Though the US Markit PMI rebounded slightly in April, the trend is clear i.e. the US is being dragged down by the rest of the world.
If nothing else, this chart warns against taking a parochial view of the economic and investing world; even if you only invest domestically you’re still going to be exposed to international risks.
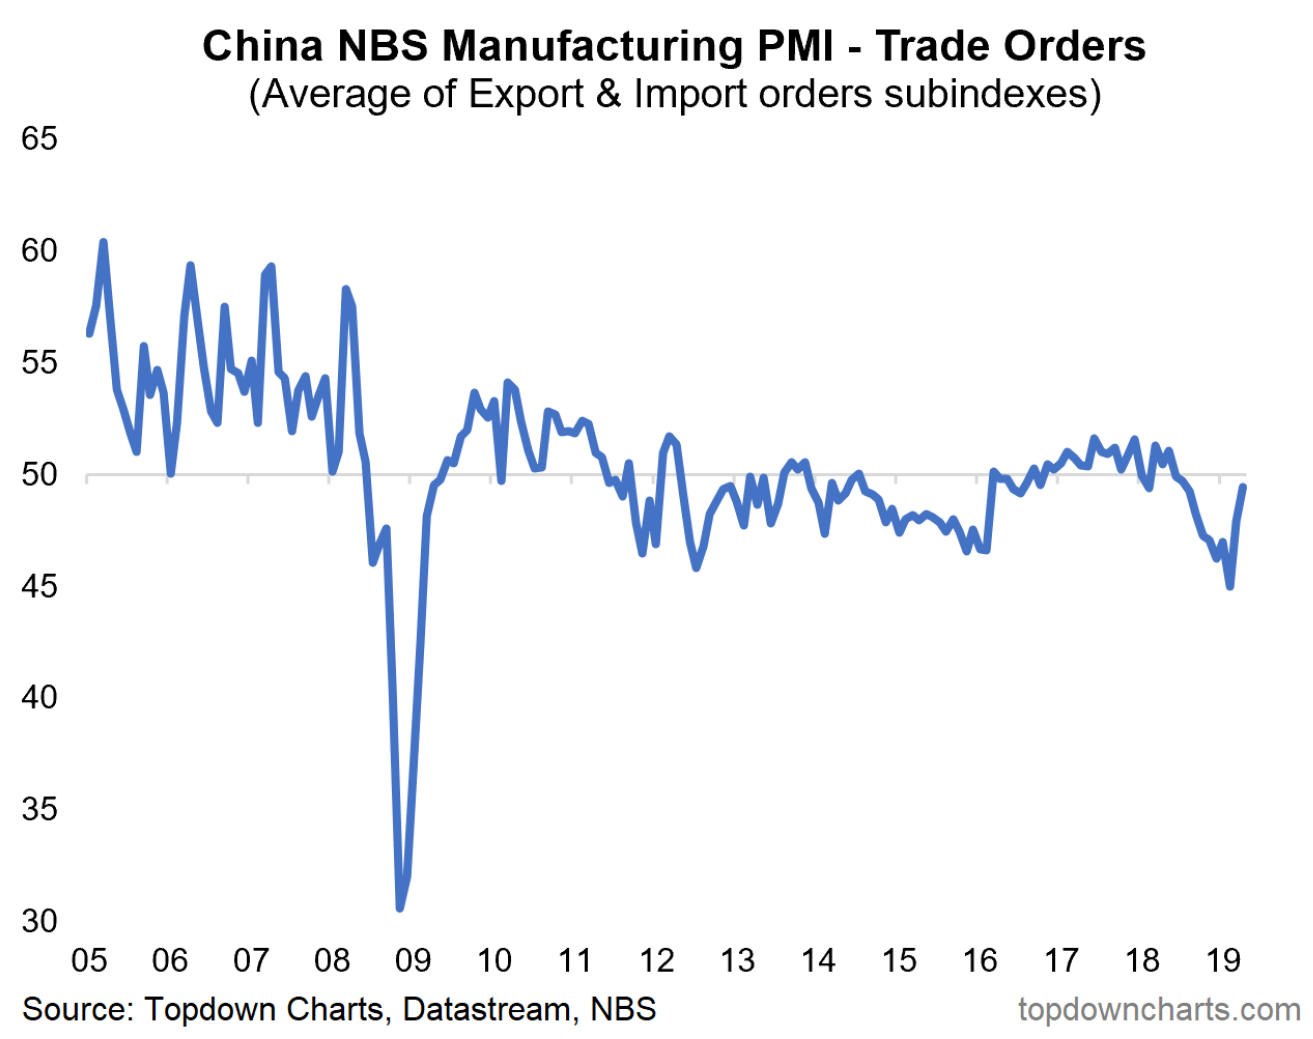
2. China Trade Orders – distinctly “less bad”… This was one of the standout charts from the April round of PMIs. It shows the combined import & export orders indexes of China’s manufacturing PMI, and the key point is after reaching the lowest point since the financial crisis, it has risen to a 10-month high.
With all the headline risk and noise around the trade war, it can be refreshing to explore the data – and at least for now, this chart is saying that it may not be all doom and gloom for trade. (source)
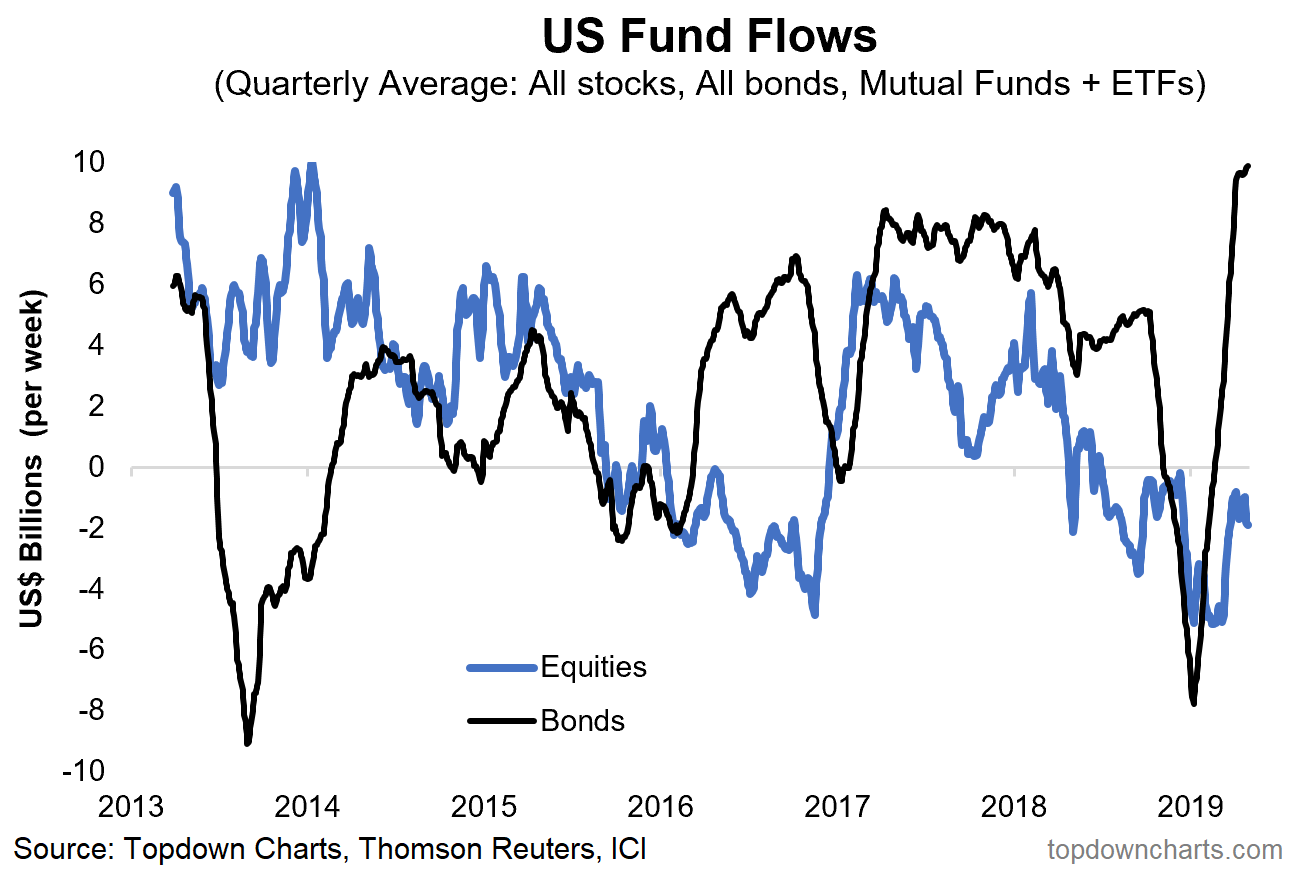
3. US Fund Flows – sell equities, buy bonds: The chart of US fund flows tells an interesting story of investors piling into bonds and dumping equities. Interesting because this comes precisely during a period where equities outperformed bonds.
It’s also quite telling in that while surveyed sentiment measures have rebounded, what investors are actually doing vs what they say they are doing reflects more an air of risk aversion. (source)
4. US Small Cap Stocks – Breakout?I talked about this in the Monday markets monitor – US Small Caps got left behind during the rebound, but at the end of last week made an attempt at breaking out. Aside from the nascent breakout, the Russell 2000 also put in a golden cross signal, and saw a breakout in market breadth too (reflecting an improvement in underlying strength).
Aside from the direct implications for small caps, I think what happens next here could have big implications for US equities in general.
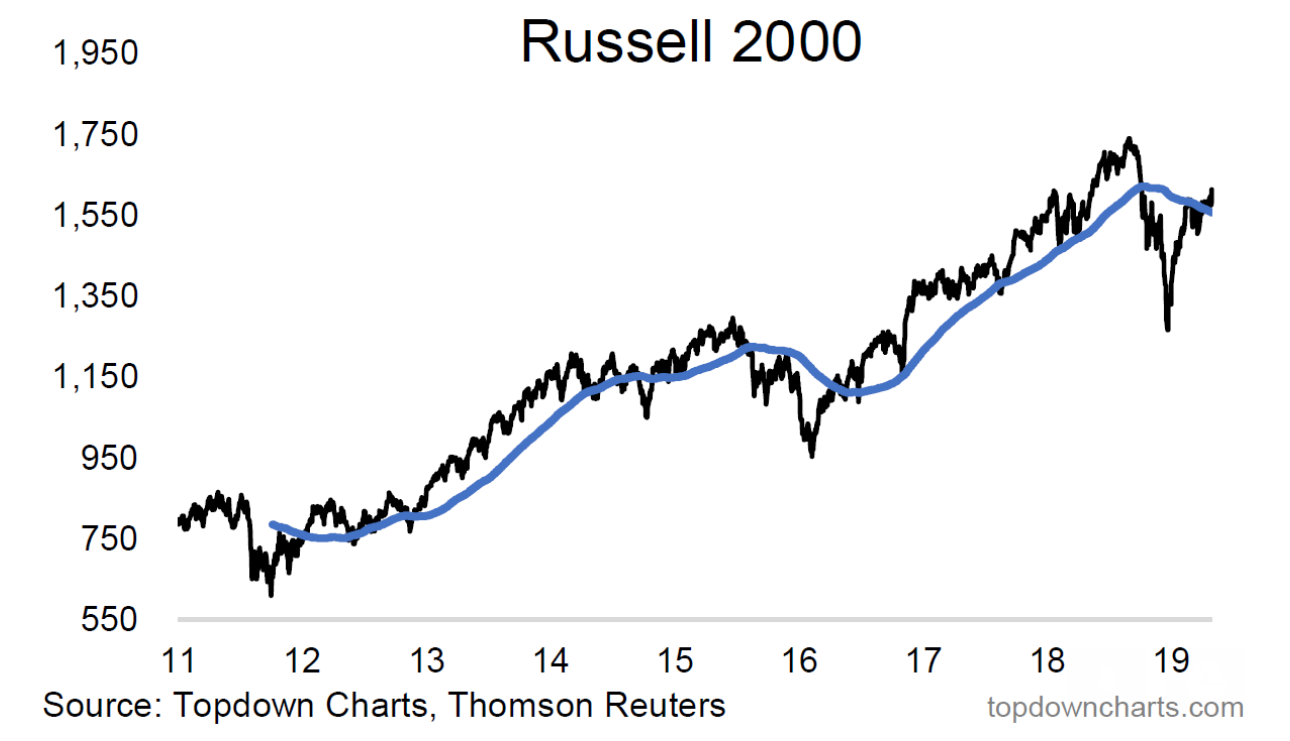
Chart Source: Global Cross Asset Market Monitor
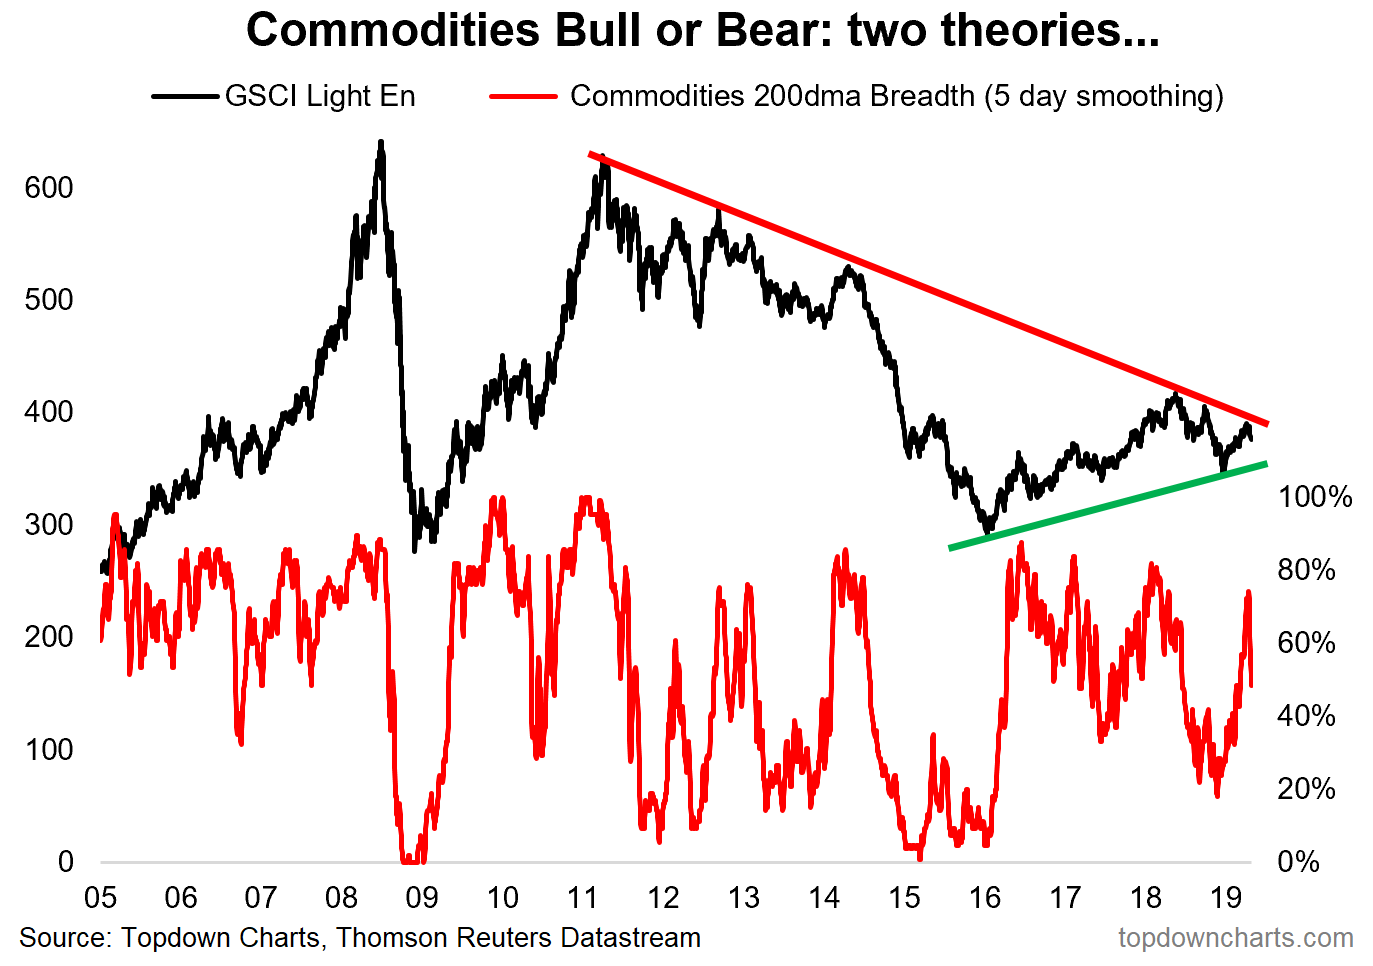
5. Commodities – Bull or Bear?Last chart for this week looks at two competing trend lines and two competing theories for the medium term outlook on Commodities. Basically the bulls will say the green line shows how a new bull market is underway and an upside breakout of that downtrend line is just a matter of time.
The bears will say that commodities are still in the process of a prolonged bear market as demonstrated by the down trend line, and that a break of the nascent up trend line is just a matter of time.
The argument here will no doubt be settled by the price, and probably soon – and the direction it breaks will probably set the tone for commodities for the coming months and years, so it’s a key chart to keep an eye on. (source)
Thanks for reading, I appreciate your interest in my work.
This article was originally posted by me on LinkedIn. Be sure to connect with us there too.
Article by Top Down Charts

