
As part of Merk’s in-house research we regularly evaluate a consistent set of charts covering the economy, equities, fixed income, commodities and currencies. The aim is to keep our eyes open and to look through the noise of the headlines, avoiding the distractions of sensationalized click-bait. In sharing this content, we offer a cross-check to your own thinking and aim to add value to your own process.
Q3 hedge fund letters, conference, scoops etc
Today’s topic: the U.S. Business Cycle
There are increasing predictions from commentators that the U.S. economy is headed for imminent recession, or already in a recession.
- However…
We invite you to download a copy of the chart book (PDF).
U.S. Business Cycle Chart Book
Why is the Business Cycle Important?
S&P 500 (log scale) and official National Bureau of Economic Research (NBER) U.S. Recessions
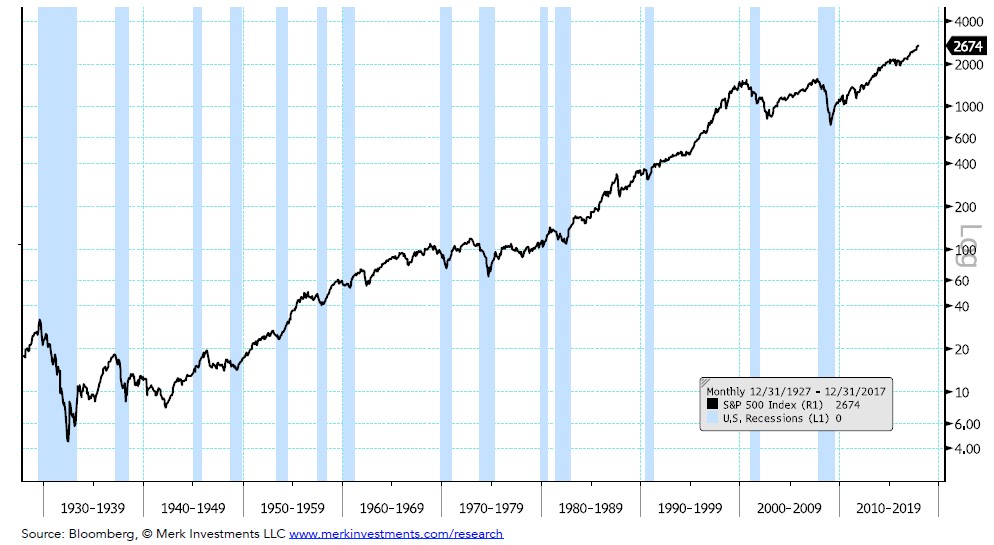
Analysis: Over the 90 years between 1927 and 2017, the average S&P 500 monthly return during expansions was +0.89% (889 months), compared to an average S&P 500 monthly return during recessions of -0.71% (191 months). In terms of proportions of time: expansion months account for about 80% and recession months about 20%. The business cycle also has important implications for Fed policy. *Note that recessions are not announced by the NBER until well after their start dates*
Leading Economic Indicators (LEIs) Index
YoY rate of change of the Conference Board’s LEI Index
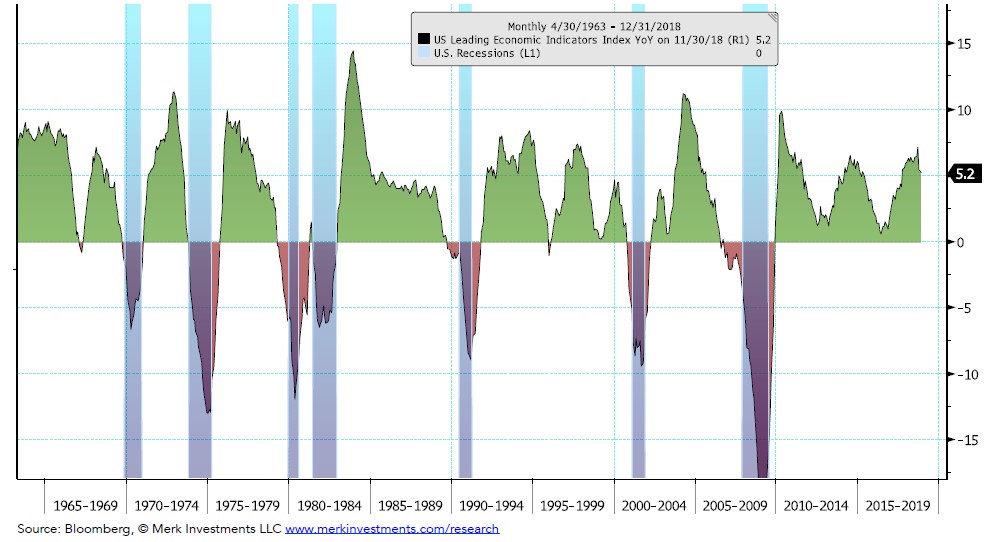
Analysis: Since last month’s report the LEI YoY rate of change decreased: from +5.9 to +5.2. The momentum has slowed somewhat, but given that the YoY rate of change remains positive, history suggests a recession is unlikely to start within the next six months. Chart Framework: I’d get incrementally negative on the business cycle outlook if the LEI YoY went negative.
U.S. Yield Curve Steepness
(10yr yield – 3yr yield)
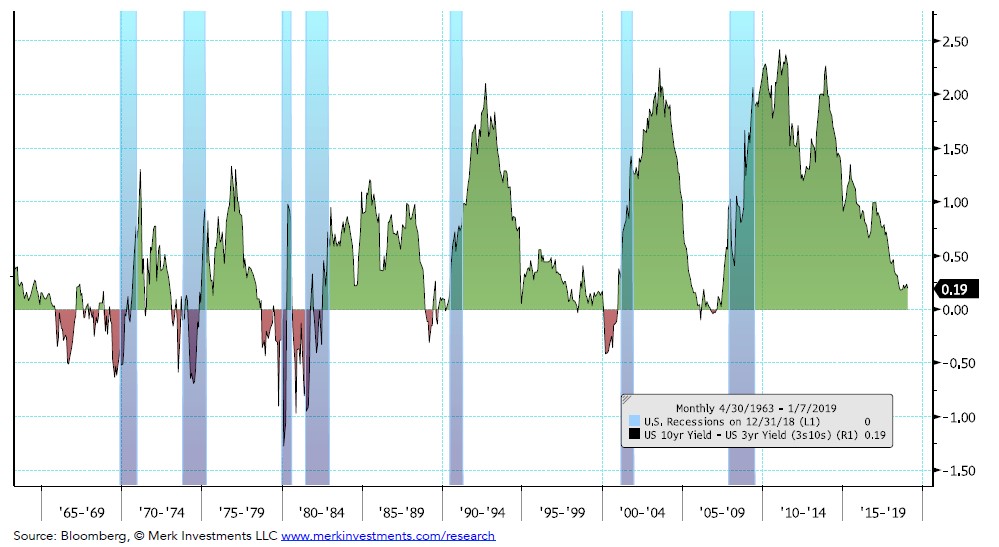
Analysis: The yield curve is still positively sloped, meaning the 10yr yield is higher than the 3yr yield.
The yield curve has steepened somewhat since last month’s report, but in general the flattening trend continues and the curve may invert in the coming months. Chart Framework: I’d get incrementally negative on the medium term business cycle outlook if the yield curve inverted (i.e., 3yr yield > 10yr yield).
U.S. PMIs
Manufacturing and Non-manufacturing (aka Services) PMIs (Purchasing Managers Index)
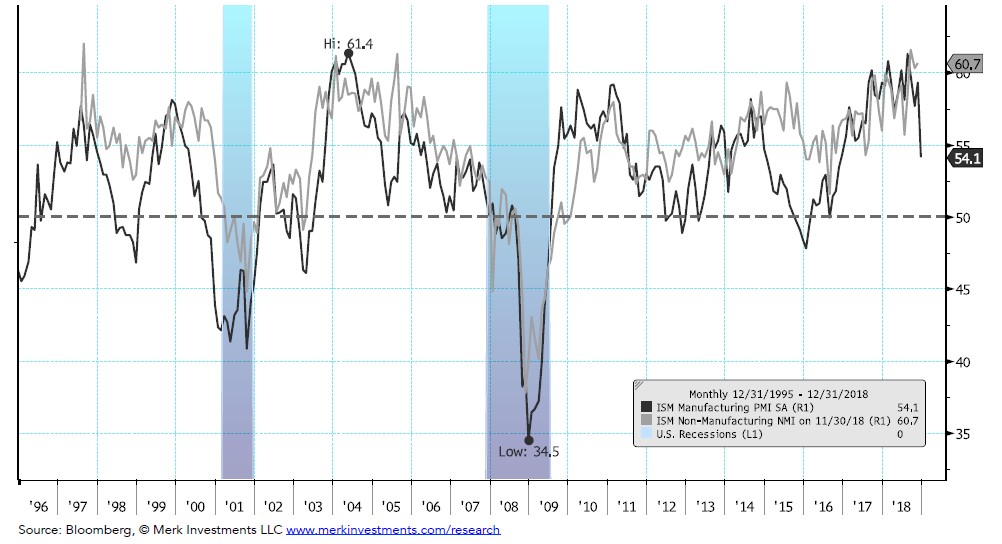
Analysis: Since last month’s report manufacturing PMI ticked down, from 59.3 to 54.1, but is generally still at a level consistent with a strong economy. Chart Framework: I’d get incrementally negative on the business cycle outlook if manufacturing PMIs fell below 50.
Global PMIs
Largest global economies’ Manufacturing PMIs (Purchasing Managers Index)
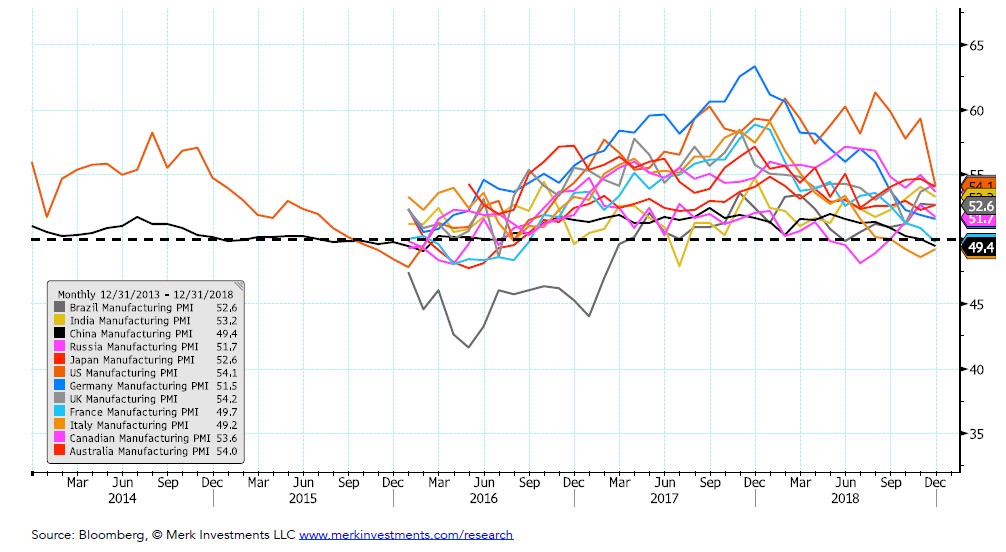
Analysis: Global economic momentum was mostly weaker over the past month. Italy’s Manufacturing PMI remains below 50. More importantly, China’s PMI has fallen below 50, which warrants attention. Given my framework I’m incrementally negative on this picture. Chart Framework: I’d get incrementally negative on the business cycle outlook if China, India, Germany, or Japan manufacturing PMIs fell below 50. To get positive all would have to be above 50.
U.S. Unemployment Momentum
U-3 Rate and U-3 12 month Moving Average
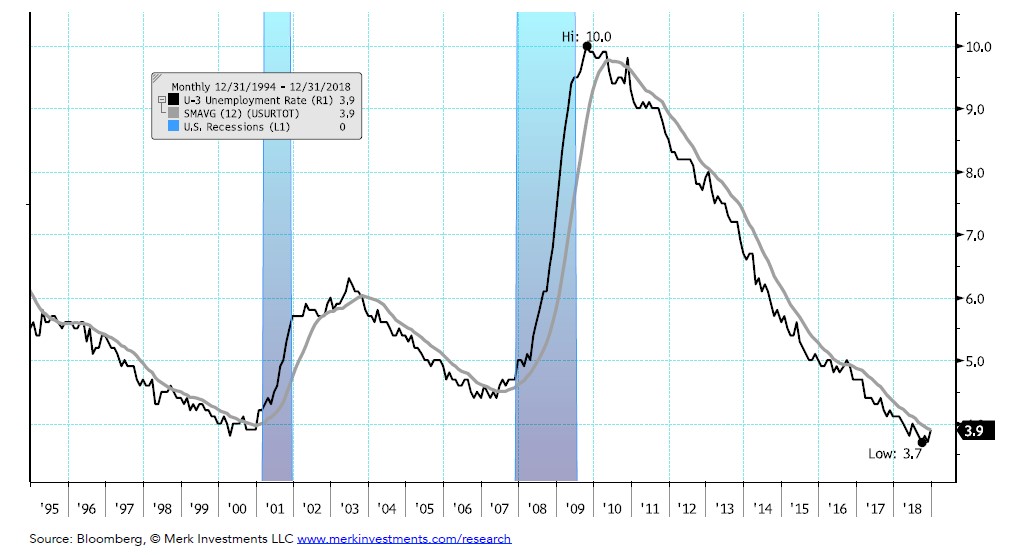
Analysis: The unemployment rate ticked up from 3.7% to 3.9%, which is right at the 12-month moving average (however the labor force participation rate ticked higher as well – not shown). Chart Framework: I’d get incrementally negative on the business cycle outlook if the unemployment rate moved above its 12m MA while the labor force participation rate trended lower.
See the full slides below.
Please also view our Premium Charts:

When you become a permium subscriber, the remainder of the month is free with full access to all premium reports that also include select premium chart books and other benefits; then, the price is only $10 a month.You can cancel any time.
The investing audience should view this content in the context of their individual investment process, time-horizon, and goals.
| Publication Date | Chart Book Category | Video | Additional | |
| January 9, 2019 | U.S. Business Cycle | |||
| December 20, 2018 | U.S. Equity Market | |||
| December 19, 2018 | Fed Chart Book | |||
| December 12, 2018 | Business Cycle | |||
| November 14, 2018 | U.S. Equity Market | |||
| November 08, 2018 | Fed Chart Book | |||
| November 07, 2018 | Business Cycle | |||
| October 17, 2018 | U.S. Equity Market | |||
| October 10, 2018 | Business Cycle | |||
| September 26, 2018 | Fed Chart Book | |||
| September 19, 2018 | U.S. Equity Market | |||
| September 12, 2018 | Business Cycle | |||
| August 29, 2018 | U.S. Interest Rates | |||
| August 22, 2018 | U.S. Inflation | |||
| August 15, 2018 | U.S. Equity Market | |||
| August 08, 2018 | Business Cycle | |||
| August 1, 2018 | Fed Chart Book | |||
| July 18, 2018 | U.S. Equity Market | |||
| July 12, 2018 | Business Cycle | |||
| June 14, 2018 | U.S. Equity Market | |||
| June 13, 2018 | Fed Chart Book | |||
| June 6, 2018 | Business Cycle | |||
| May 23, 2018 | U.S. Inflation | |||
| May 16, 2018 | U.S. Equity Market | |||
| May 9, 2018 | Business Cycle | |||
| May 2, 2018 | Fed Chart Book | |||
| April 19, 2018 | U.S. Equity Market | |||
| April 10, 2018 | Business Cycle | |||
| March 21, 2018 | U.S. Equity Market | |||
| March 14, 2018 | Business Cycle | |||
| February 14, 2018 | U.S. Equity Market | |||
| February 7, 2018 | Business Cycle | |||
| January 17, 2018 | U.S. Equity Market | |||
| January 10, 2018 | Business Cycle | |||
| December 12, 2017 | Business Cycle |
Article by Axel Merk, Merk Investments

