
I thought about doing up all three Singapore bank valuations in a single article but changed my mind.
Q3 hedge fund letters, conference, scoops etc
Although each bank is headquartered in Singapore, they have differing exposures in the region so I am going to run through each one separately and try to break it out for investors.
Bank valuations
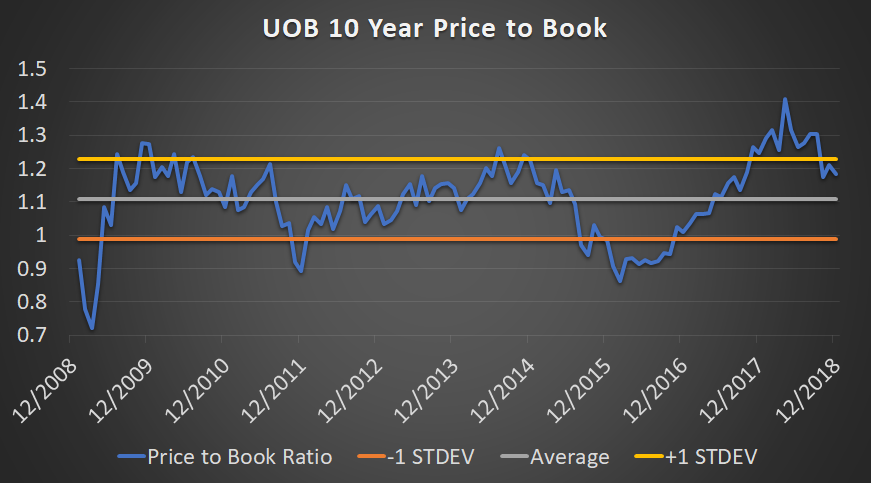
So while UOB has come down from peak valuations, it doesn’t look very cheap by the historical standards of the last ten years.
That being said, I think there’s a pretty strong argument that we shouldn’t be using the valuations of the last few years simply because interest rates were kept at record lows because of Central bank policy.
This had a huge impact on net interest margins and net interest income. If you aren’t sure what these terms mean, check out our earlier article in the Singapore bank series where I break it down in layman terms.
The era of record low interest rates (or even negative interest rates) has ended and the Federal Reserve is increasing interest rates, leading to an increased cost of borrowing generally.
Net interest margins & net interest income is rising
So you have a situation whereby the biggest driver of a bank’s profitability is finally going up as net interest income is increasing (driven by both loan growth and net interest margins rising) – so it stands to reason that new valuations should also reflect that increased profitability.
| Net Interest Margin % | Net Interest Margin % | |||
| 2005 | 1.99 | 1Q 18 | 1.84% | |
| 2006 | 1.99 | 2Q 18 | 1.83% | |
| 2007 | 2.04 | 3Q 18 | 1.81% | |
| 2008 | 2.27 | |||
| 2009 | 2.36 | |||
| 2010 | 2.09 | |||
| 2011 | 1.92 | |||
| 2012 | 1.87 | |||
| 2013 | 1.72 | |||
| 2014 | 1.71 | |||
| 2015 | 1.77 | |||
| 2016 | 1.71 | |||
| 2017 | 1.77 |
Is UOB cheap?
Well.. they certainly aren’t unambiguously cheap like in 2016.
If we take into account an operating situation where interest rates normalize, they are probably trading at pretty average levels and are neither particularly pricey nor cheap i.e. range of reasonableness.
The biggest contrast that banks have with other listed companies on SGX is that I do actually think they have a runway to keep growing.
UOB pays out roughly less than 50% of its profits as dividends, and retains the rest which it can reinvest profitably and keep growing its book value going forward.
That’s something that other businesses have a challenge doing.
So while you are getting a lower dividend yield than lets say Singtel, you are getting a much long runway in terms of growth prospects which in turn will translate to higher business values for UOB itself, and of course higher dividends down the road.
Digging deeper in into business segments / geography
Net Profit Before Tax Breakdown:
| in millions | % | |
| Singapore | $2,491 | 59% |
| Malaysia | $581 | 14% |
| Thailand | $218 | 5% |
| Indonesia | $29 | 1% |
| Greater China | $419 | 10% |
| Others | $469 | 11% |
| Net Profit Before Tax | $4,207 | 100% |
Assets breakdown:
| in millions | % | |
| Singapore | $217,979 | 61% |
| Malaysia | $35,373 | 10% |
| Thailand | $20,988 | 6% |
| Indonesia | $9,105 | 3% |
| Greater China | $46,298 | 13% |
| Others | $24,707 | 7% |
| Unallocated Intangible Assets | $4,142 | 1% |
| Total Assets | $358,592 | 100% |
No surprise here that Singapore makes up the biggest the biggest source of its profits / assets.
The biggest contrast between UOB and OCBC in my mind would be the insurance segment that OCBC has that makes up more than 25% of profits before tax.
OCBC used to lag UOB in terms of Greater China exposure – but that has since changed after its acquisition of Wing Hang bank (now rebranded to OCBC Wing Hang Bank).
Disclosure: The author does not own UOB or OCBC stock at the time of publication. This is not a buy or sell recommendation but merely the written opinion of the author meant for educational purposes.
Article by Jun Hao, The Asia Report

