
Margin debt is a funny indicator, it gets frequently used and abused by both rational cool-headed traders as well as sensationalist fear-mongers. So what’s the deal with margin debt, and what (if anything) is it even telling us?
Q2 hedge fund letters, conference, scoops etc
The first chart is an old favorite of mine, but it is not without its flaws or critics. It shows the annual change in margin debt* against the S&P500. The basic rule is that when it goes into contraction mode it can be a signal of a bear market e.g. 2001 & 2008.
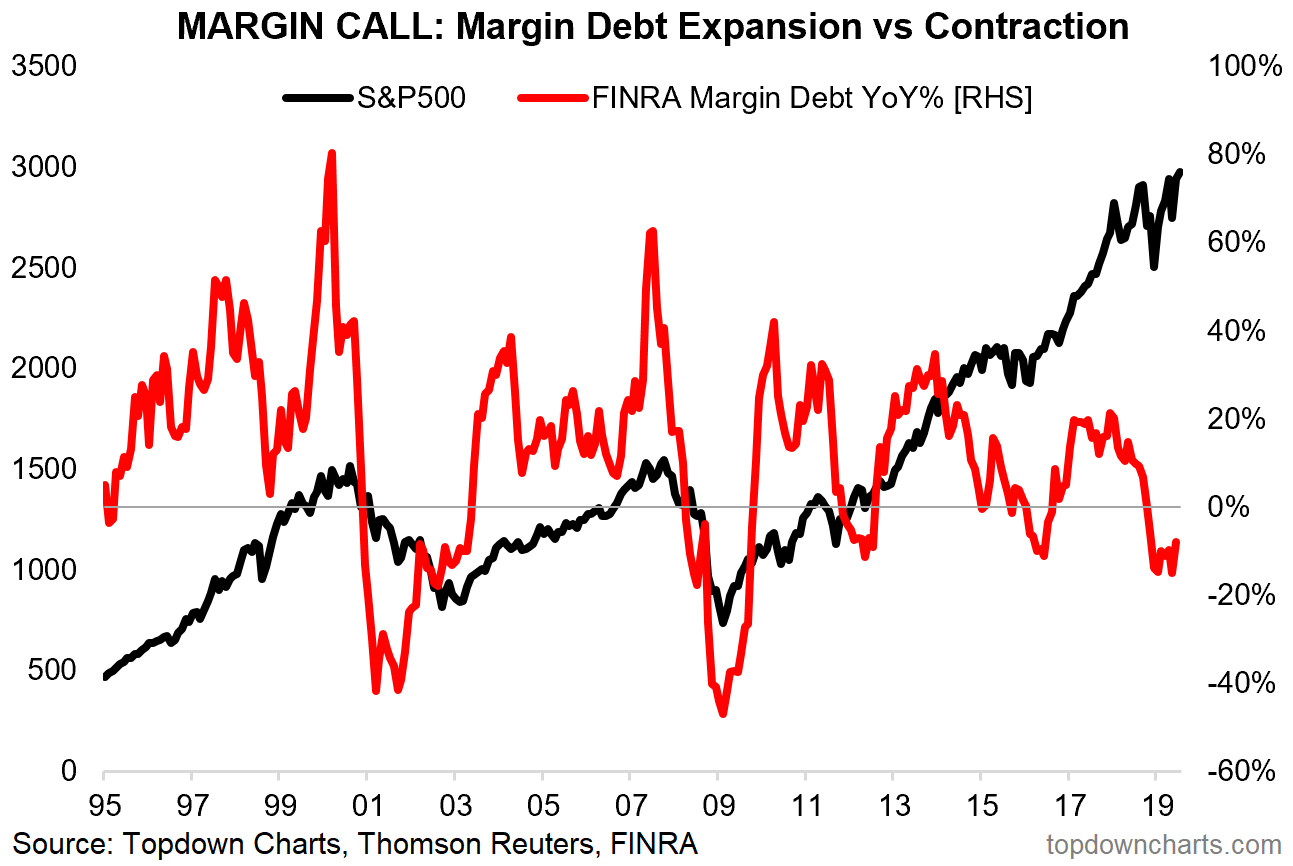
*NOTE: it used to be called NYSE margin debt, but now FINRA aggregates and distributes the data – still basically the same thing by another name. [also, while a full detailing is out of scope, margin debt is what traders use to build up leveraged positions – similar to a mortgage on a house]
The key critiques of that chart, to steal the thunder from those who will comment, are: 1. it’s showing a stationary vs non-stationary series; 2. margin debt is not adjusted for price; 3. it’s only showing a limited time frame; 4. some stupid comment about algos and central banks. (just kidding on that last one, but probably best to include it!)
But even the bear market warning rule of margin debt contracting is not particularly efficacious… it sent false signals on at least 3 occasions in the period covered. I think one nuance to add would be “when margin debt starts contracting on an annual basis *after* sharply accelerating” (which more closely maps to the 2001 and 2008 examples).
But this is just one way of looking at margin debt…
Total margin debt vs S&P500 level: this chart shows the total level of margin debt balances against the S&P500. This is probably one of the least interesting ways of looking at it from a signal standpoint, but by itself can often be simply “interesting”.
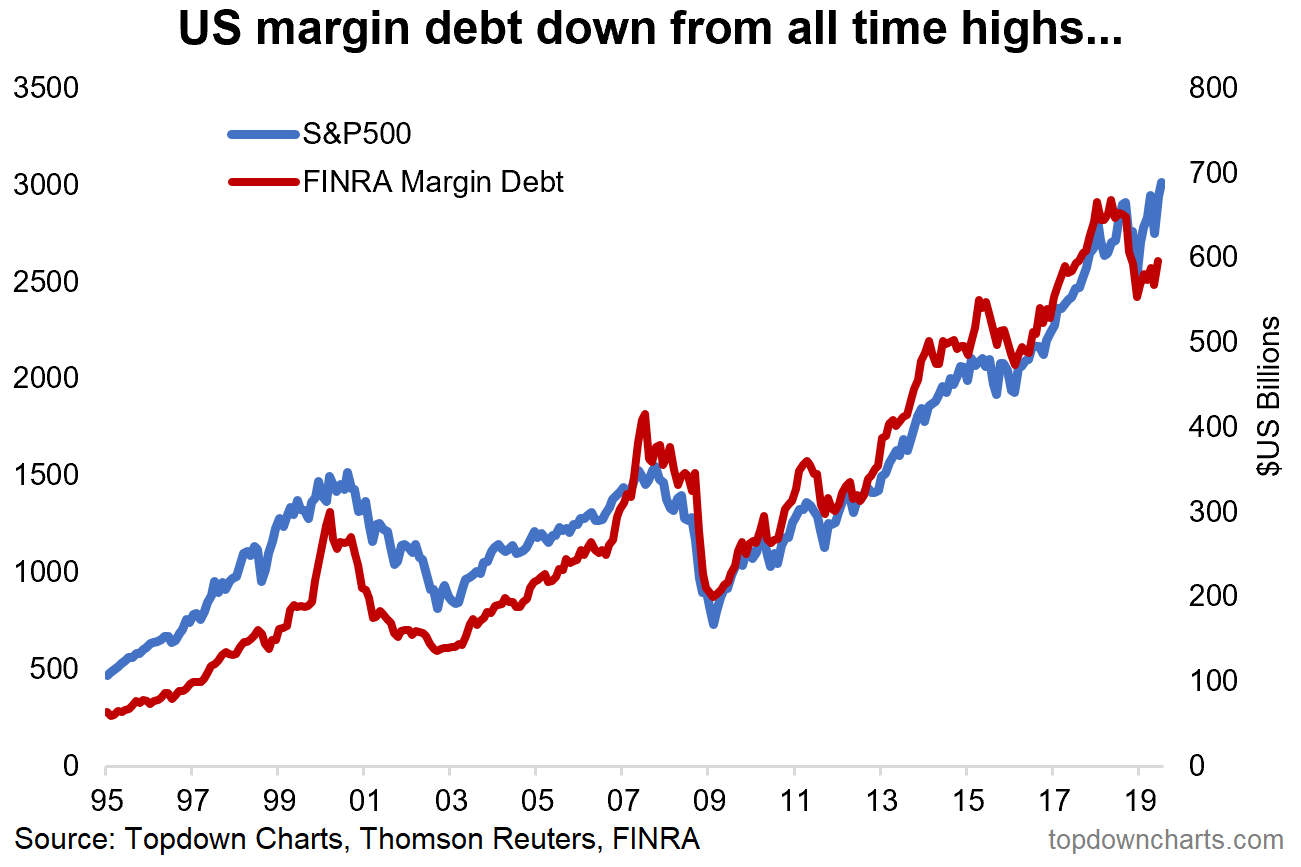
It’s one of those charts that often gets wheeled out by perma-bears whenever it reaches an all time record high. Other than that though, there does appear to be some merit in tracking it, particularly when it rolls over from a climactic high. Which is basically another way of capturing the same information as the previous chart, but in a more stylistic/visual/judgmental manner.
What if you take that first chart and normalize for changes in stock prices? Well the below is what you get. Specifically what it tracks is the spread between the year-on-year change in margin debt vs the year-on-year change in the S&P500. So this in effect is changes in margin debt that can’t be explained by changes in stock prices (i.e. active leveraging/deleveraging).
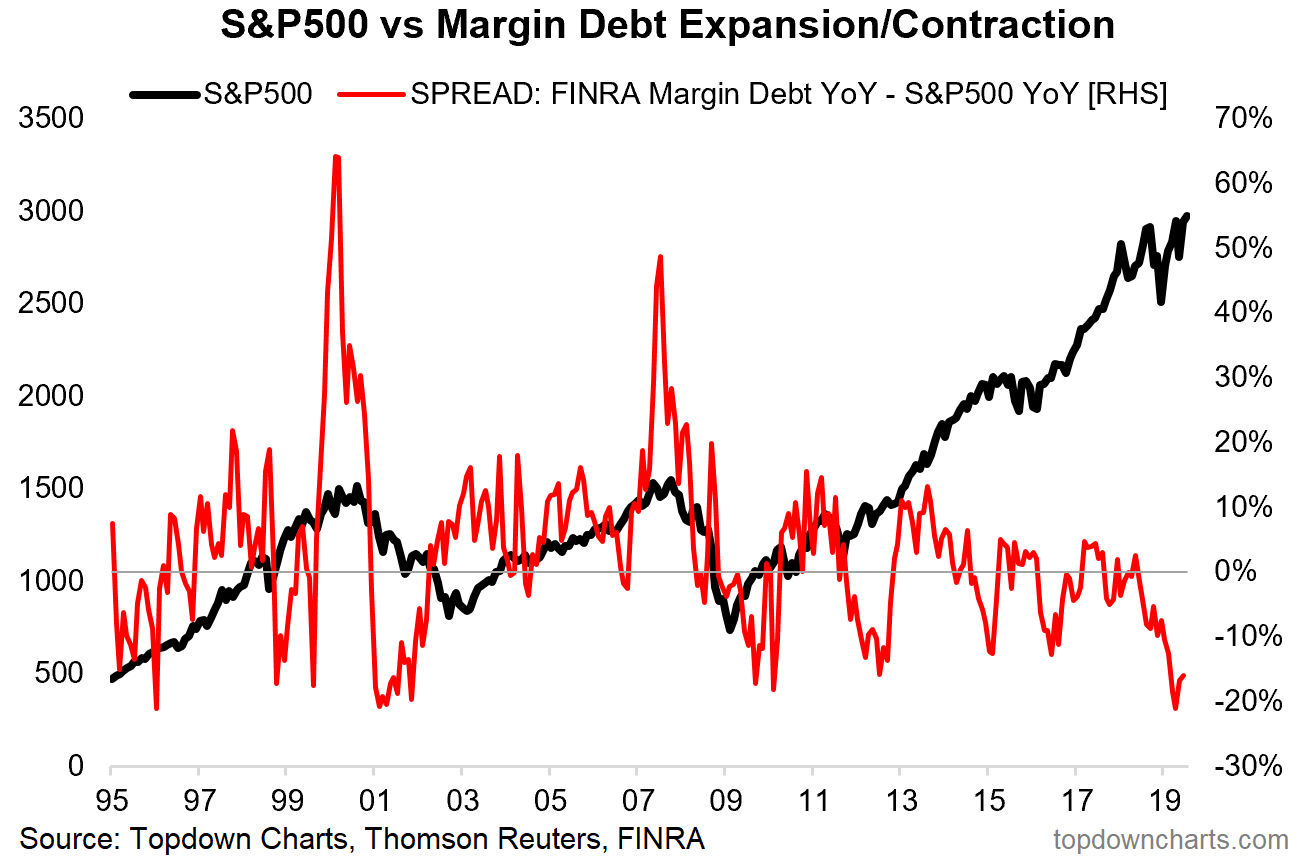
From a signal standpoint it’s a little more messy than the original version, and it’s not entirely clear cut that a negative reading is bearish…
In fact I would say it almost looks like a contrarian indicator. This would probably make some sense in that periods of significant margin debt deleveraging would be times when investors risk appetite is particularly low (from a sentiment standpoint this would typically be a bullish contrarian signal).
So it’s interesting then to note how substantial the deleveraging in margin debt has been on this metric. It’s one of a number of indicators that I’ve seen which document the substantial bearishness that has prevailed in the last 6-9 months (yet paradoxically in an environment which has also featured significant bullishness on other metrics e.g. surveyed sentiment)
What about leveraged ETFs? Margin debt is not the only way to leverage up, there has been a proliferation of ETFs designed to give investors/traders leveraged long/short exposures to all manner of assets.
The chart below documents the rise and fall of assets under management in US equity related leveraged ETFs/ETNs.
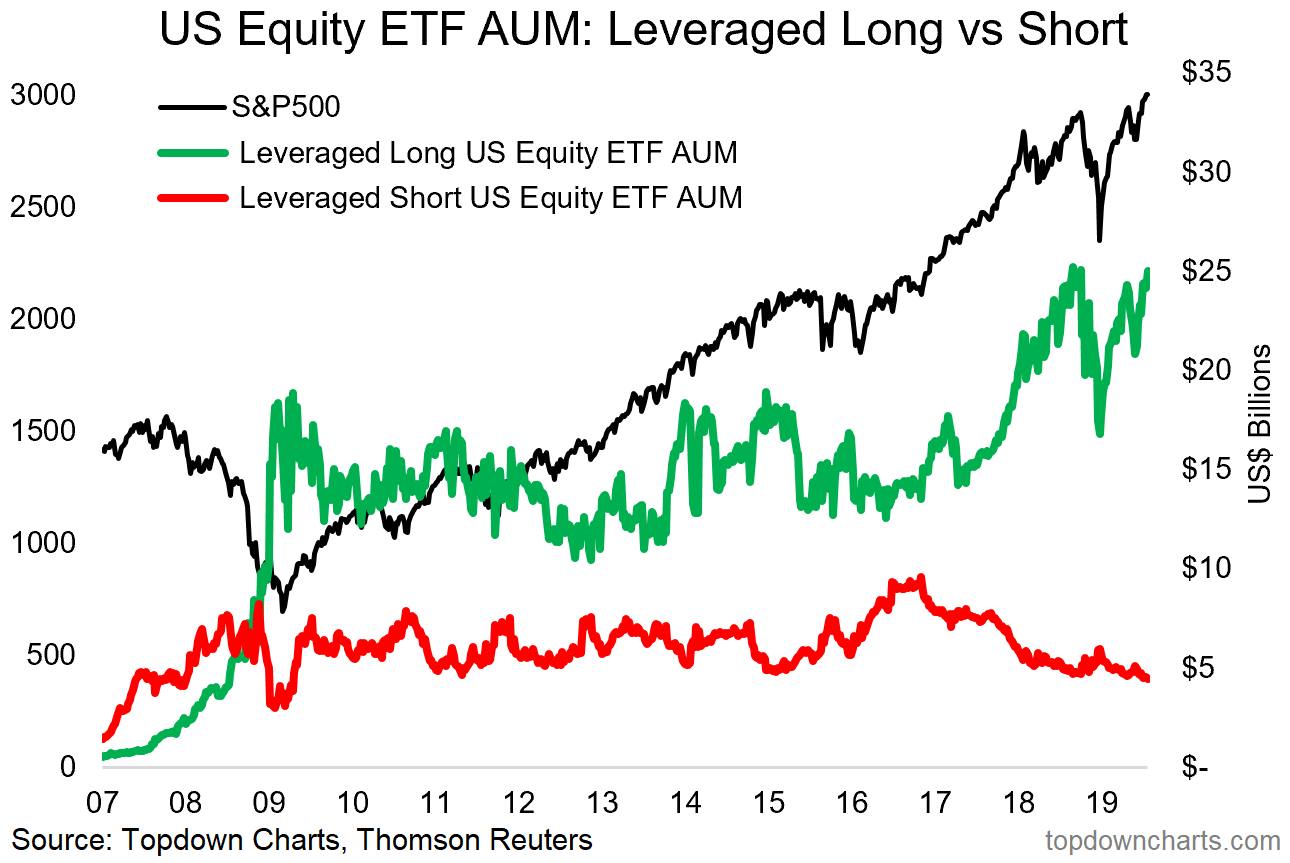
A couple of things are worth highlighting here: first, leveraged short ETF AUM has continued to drift lower, and leveraged long ETF AUM has remained on the high side. This is one piece of evidence which arguably points to at least the cohort of investors using these instruments as running a bullish outlook on equities…
What about futures? Again, there are many ways to get leveraged, and here’s another way: futures.
This chart shows the aggregated normalized (against open interest) net-speculative futures positioning for US equities.
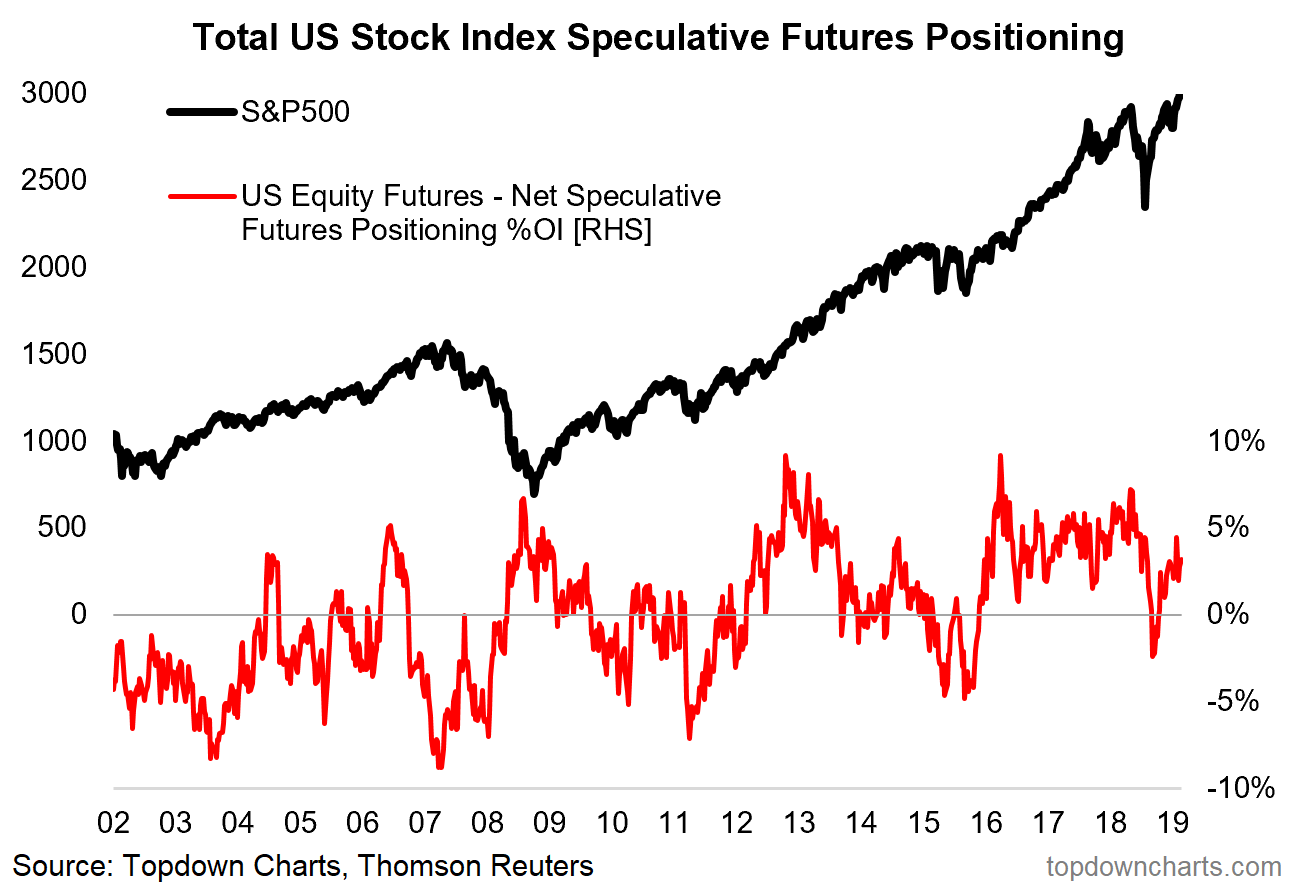
At present it’s on the bullish (net-long) side, but is more or less tracking around the average of the last few years. So it’s a case of: these guys are bullish but not with the same extreme bullishness we’ve seen at other times…
What about the aggregate picture? The next chart takes the dollar value of net margin debt, net leverage ETF AUM, and net speculative futures positioning.
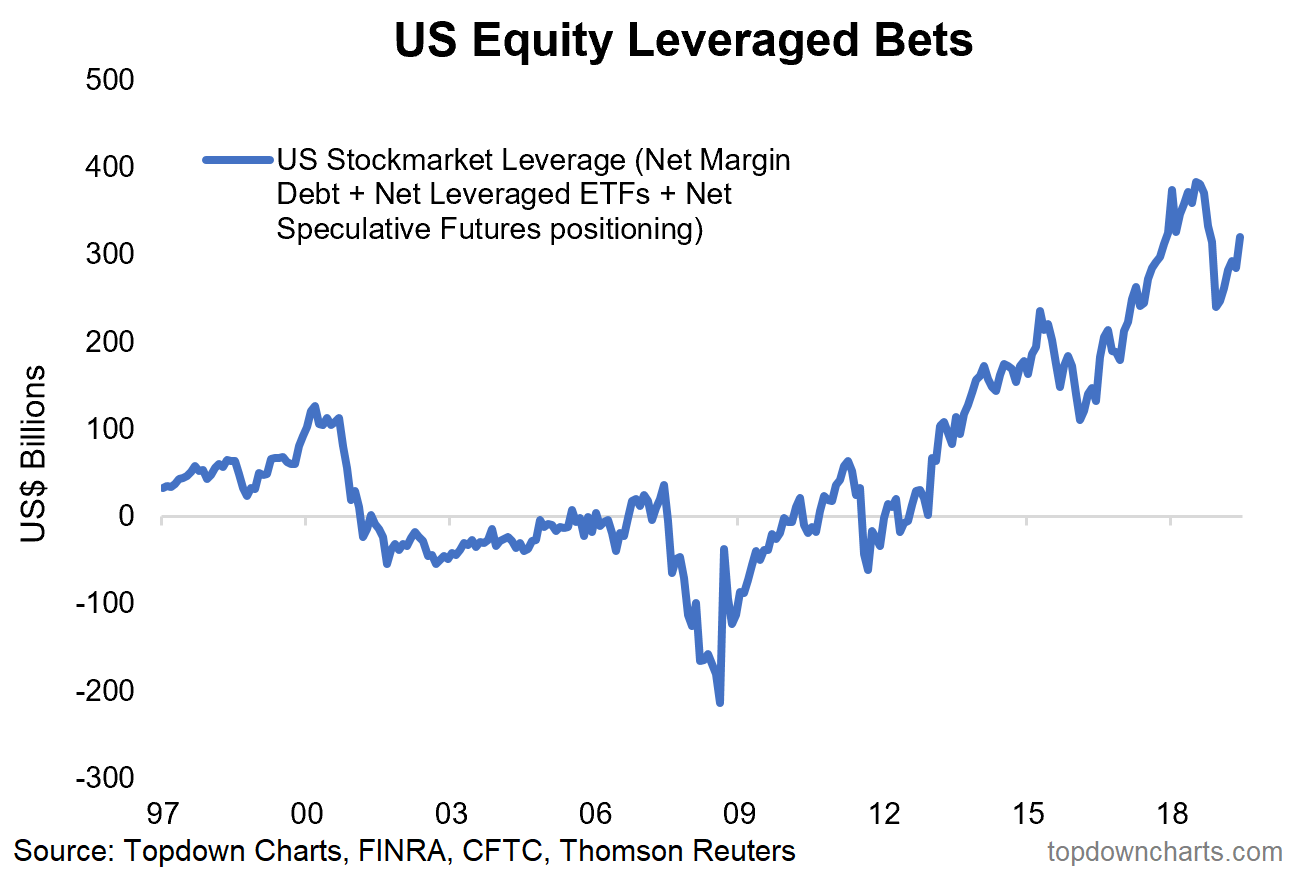
It shows one way of looking at the aggregate amount of leveraged equity bets in the system (though I will admit there are things it isn’t capturing e.g. credit card debt deployed in the markets, CFDs, options, OTC derivatives, and probably some other instruments/structures/arrangements that I haven’t even thought of!).
Again, being a level it’s more of an “interesting” chart, but it is interesting in that respect to note how there is over $300B in these leveraged equity bets.
And for those who will ask, here it is standardized against S&P500 market cap. In this lens, you can see there has been *some* deleveraging, but at the same time, it remains near the upper end of the range.
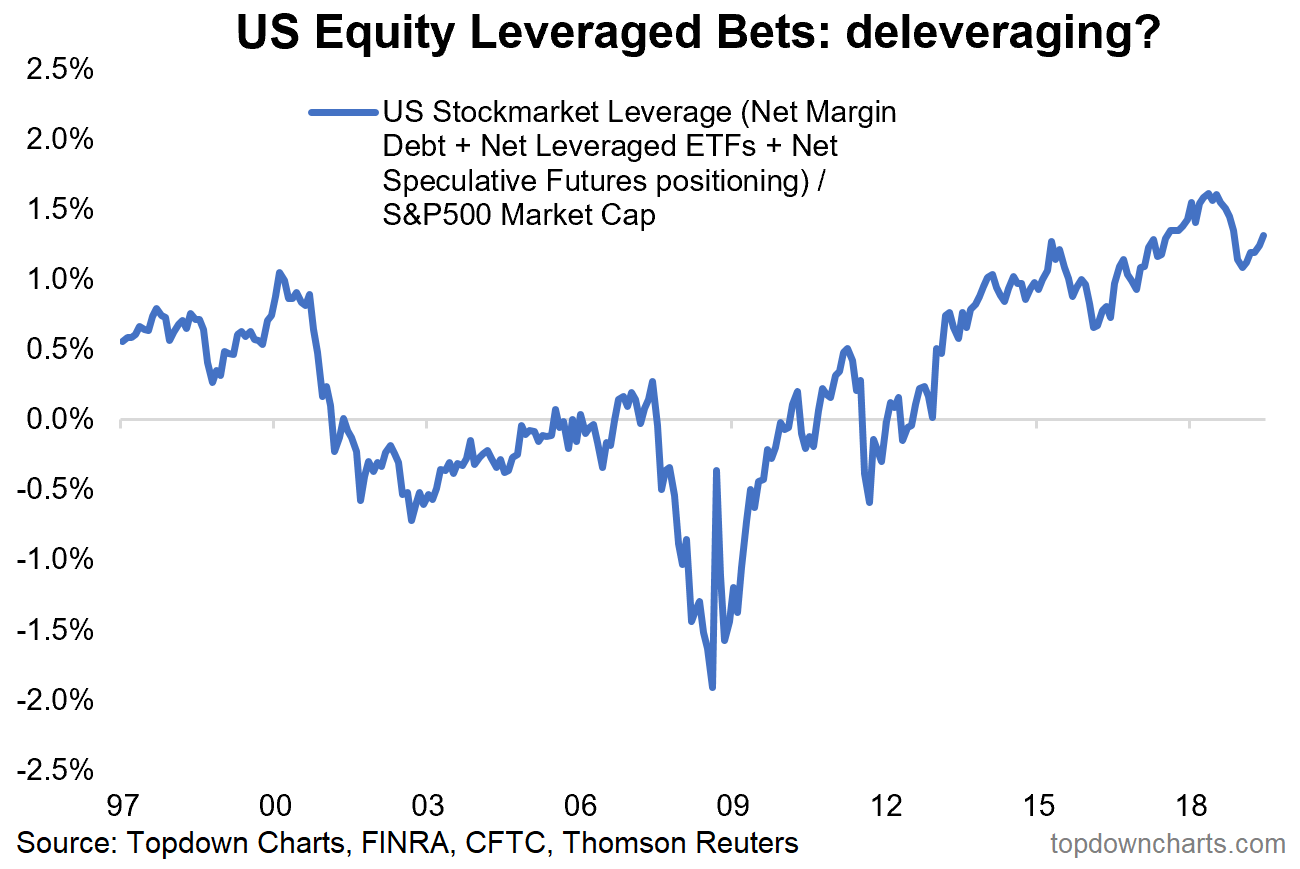
Notably, it bottomed out in January (around the broader global stock market bottom). So you can see how there is a bit of a sentiment signal playing out here.
Overall, I would say it’s something that’s definitely worth keeping track of both from a direct actionable signal standpoint as well as more of a contextual/informational and “interesting” standpoint.
At the moment it’s exhibiting many of the hallmarks of a market cycle that is long in the tooth, yet the clear deleveraging and only measured re-deployment of leverage adds to the (albeit somewhat mixed) picture of bearishness/cautiousness. So I would say there’s a decent chance that the first chart’s “bear market warning indicator” is flashing a false signal.
Of course, this is only one angle on an issue that has many facets, and as you know my preference is to take the wider/full picture into account; namely bringing in information from valuations, monetary policy and liquidity, earnings/economic cycles, positioning/flows/sentiment, and of course technicals.
Any comments/questions on this just get in touch direct or by social media.
The main chart in this article came from the recently launched “Top 5 Charts Of The Week” report – which is our entry-level subscription service. >> Subscribe now and you’ll get a 1-month free look at our core institutional service.
Thanks,
Callum Thomas
Head of Research at Topdown Charts

