
Introducing HOLT Economic Profit
Q1 hedge fund letters, conference, scoops etc, Also read Lear Capital: Financial Products You Should Avoid?
Executive Summary
The usual approach to valuing a firm is to calculate the present value (PV) of its future free cash flows. An alternative approach is to calculate the PV of its economic profits (EP). This report introduces the new HOLT Economic Profit framework and will serve as a chapter in an upcoming textbook on advances in the HOLT CFROI® framework.
Economic Profit represents the economic earnings of the firm. EP is proportional to the spread between a company’s return on capital and cost of capital. If a firm earns its cost of capital, EP is zero. Growth based on investments that are below their cost of capital destroys shareholder value, and these projects should be rejected. Investment into positive spread projects creates shareholder value and should be encouraged.
This report demonstrates how EP is calculated and can be used. This approach applies all the advantages of the HOLT framework to the measurement of economic profit: asset mix, project life, inflation and accounting distortions are handled identically, making HOLT EP a superior economic measure.
By splitting EP into operating and acquisition goodwill components, absolute value creation can be assessed. Insights can be gained from analyzing change in EP, which can be decomposed into three parts: change in economic spread, growth and change in goodwill. Amazon is an excellent example of a firm whose increase in EP due to growth has more than compensated the loss in EP due to decreasing CFROI. Amazon is employed as an example throughout the report. Corporate boards and investors should insist on positive change in EP. A brief case study on Danaher illustrates how EP and change in EP can be used to analyze an acquisitive company.
The introduction is rigorous. If you wish to get straight to the point, you can begin with the Danaher case study. Links are available in the report to jump to sections of most interest.
Introduction
The usual approach to valuing a firm is to calculate the present value of its future free cash flows to the firm’s capital providers (FCFF). A highly informative alternative is to calculate the present value of the firm’s economic profits.
Although technically correct, the FCFF method has nothing to say about the quality of the cash flow. Is a high level of free cash flow a good or bad thing? The answer depends on whether the company is forsaking value creating opportunities to report higher cash flow.
A company should invest its capital and available cash flow in projects that exceed their cost of capital. If value creating opportunities are unavailable, the firm should maximize cash flow and return it to shareholders via dividends or share buybacks.1F2 As a general rule of thumb, free cash flow will be negative when asset growth is greater than the return on capital.
Cash flow rules: if g > CFROI then FCFF < 0
Value-destroying firms often make the mistake of expanding their operations to report earnings growth. They think Wall Street wants earnings growth at all cost. This misunderstanding can lead to expensive corporate mistakes. Earnings is an accounting value and cash flow is an economic one. These profitability measures are frequently conflated. It is the quality of earnings that should inform a firm’s growth strategy.
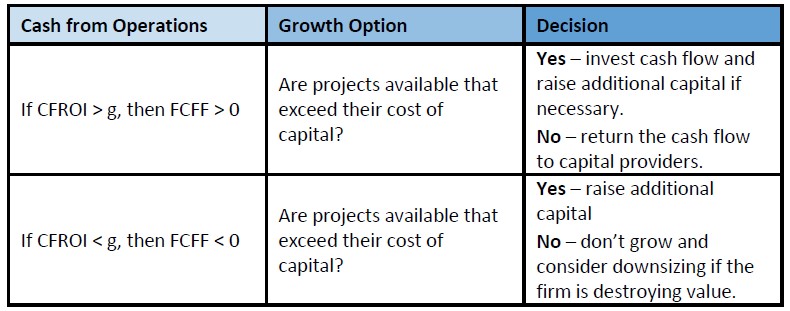
The quickest way to generate cash flow is to stop growing. The decision table indicates that this is sub-optimal if a firm has projects available which exceed the cost of capital. This choke-growth turnaround rule is only warranted for value destroyers, whose return on capital isn’t meeting the cost of capital. For them, it is wise to remember humorist Will Rogers’ adage on the first law of holes: if you find yourself in a hole, stop digging.
On the flipside, potential value creation is squandered when CFOs don’t do their job of investing available cash flow and raising capital to finance projects expected to beat their cost of capital. Negative cash flow is acceptable as long as project returns are expected to exceed their cost of capital and generate positive Net Present Value (NPV) for the firm. To do otherwise is to leave money on the table. Rational shareholders prefer more value to less and the aim of the firm is to create the greatest possible NPV from its portfolio of present and future investments.2F3 Accounting earnings should never be confused with economic value.
Can the concept of value creation be communicated more comprehensively? All capital providers expect compensation. There is a charge on debt which appears on the income statement as interest expense. Operating profit has to cover interest charges and debt-equivalent charges such as operating lease expenses. If not, net income will be negative.
But what about equity? There is no charge for equity on the income statement, so it appears to have no cost to the untrained eye. Economists know that there is an opportunity cost for providing equity, which should reflect the investment’s riskiness. A residual income would subtract a charge on the equity at the opportunity cost of equity from net income. The residual income is an economic profit, which differs profoundly in concept and absolute value from accounting profit. The equity charge is simply the cost of equity multiplied by the equity. The more equity required to support earnings, the greater the economic charge and lower the residual income.
When analyzing the operating performance and value of industrial and service companies, it is beneficial to separate the firm’s operating and financing decisions, and to value the firm with respect to all capital providers. Financial structure is a secondary consideration in the capital budgeting process. Of primary concern is the intelligent allocation of capital and resources with the aim that all of the capital provided will create positive NPV. As Weingartner notes,
“Capital budgeting represents in some respects the central problem of the firm. The complexity of the problem derives from the fact that any set of actions taken today has consequences at later times, and the opportunities available at later dates are related to decisions being implemented currently.”3F4
The opportunity cost for the firm’s capital, which is a weighted-average of its cost of equity and debt, is the cost of capital. Value creation can be communicated by calculating economic profit (EP) and discounting future economic profits to their present value. Valuations from the FCFF and EP methods should yield equivalent results for an identical forecast.
Valuation of Classic Companies
Executive Summary
This report highlights insights that can be gained from a quick study of a firm’s track record of economic performance displayed as our Relative Wealth charts and interpreted from the vantage point of the competitive life-cycle framework. We use the Relative Wealth charts of companies whose track records or portions thereof are particularly revealing of one or more “classic” performance/valuation issues.
Our examples and brief descriptions will show that Relative Wealth charts are extraordinarily useful displays of competitive life-cycle variables significant for gauging a firm’s economic wealth creation and market valuation. Accounting and inflation adjustments incorporated in the data provide users with directly comparable CFROIs,
discount rates, and asset growth rates across companies with different asset structures, across national borders, and across time.
Situations and patterns evident in Relative Wealth charts of example companies include:
- the full life-cycle, including successful restructuring (IBM)
- different outcomes with high reinvestment rates (FedEx, Paychex, Wal-Mart)
- the high-CFROI® or high-growth tradeoff (Abbott Labs, Emerson Electric)
- ROIs on incremental investments much lower than CFROIs on existing assets (Toys R Us)
- importance of asset contraction by large companies seeking to improve “low” CFROIs (Dow Chemical, International Paper)
- different strategies to improve CFROIs (Safeway, Inc., IBM)
- radical improvement in business processes (Porsche)
- acquisitive companies demand a high level of managerial skill to achieve high performance (Danaher Corp., Hanson Plc)
- capitalizing R&D is important for measuring economic performance (Chiron Corp.)
- brand names do not reward shareholders in the absence of economic performance (Eastman Kodak, Adolph Coors)
- growth companies with limited internal reinvestment opportunities at high CFROIs (Campbell Soup Company, Danone Group)
Introduction
This report focuses on insights that can be gained from a quick study of a firm’s track record of economic performance displayed as our Relative Wealth (RW) charts and interpreted from the vantage point of the competitive life-cycle framework. (If you are not familiar with our framework, please see the appendix “Basic Concepts Summarized” for background on our model and an introductory explanation of how to interpret the RW chart.) For the purpose of this report, we use the RW charts of companies whose track records, or portions thereof, are particularly revealing of one or more “classic” performance/ valuation issues. For short, we call these “classic companies”.
Only broadly do we address in this report the valuation aspect of the performance patterns described. How a stock performs versus the market during any span is a function of expectations at the beginning of the period versus subsequent actual performance and associated changes in market expectations. At a point in time, a user of RW charts can make helpful inferences of plausible market expectations based on the track records of specific firms available at that particular point in time. Sometimes firms delivering stellar CFROIs and reinvestment rates fall short of earlier, even higher investor expectations and thus underperform the market. Similarly, below-cost-of-capital firms maintaining subpar CFROIs might nonetheless surpass earlier, even more pessimistic expectations and thereby reward shareholders with positive excess returns over the relevant period.
Our examples and brief descriptions will show that RW charts are extraordinarily useful displays of competitive life-cycle variables significant for gauging a firm’s economic wealth creation and market valuation. Accounting and inflation adjustments incorporated in the data provide users with directly comparable CFROIs, discount rates, and asset growth rates across companies with different asset structures, across national borders, and across time.
Users of RW charts can get visual readouts answering the following important valuation questions:
a. What have been the levels of and trends in economic returns (CFROIs) in relation to those of the investors’ discount rate?
b. What have been the levels of and trends in actual growth rates, or reinvestment rates, and have those been above or below the firm’s sustainable growth rates?
c. Are trends in excess (positive or negative) shareholder returns understandable in terms of the firm’s track records of CFROIs and growth rates?
I haven’t had a chance to read the above, but a reader shared them. Let me know if useful.

