
Innovation can be a major competitive advantage for any developed economy.
Q3 hedge fund letters, conference, scoops etc
However, achieving a sustainable rate of innovation isn’t necessarily a straightforward exercise. The reality is that innovation is a complex and difficult outcome to measure, and there are many different variables that factor into it at a national level.
Research and development (R&D) expenditure is certainly one of these factors – and while it doesn’t always directly correlate with innovation outcomes, it does represent time, capital, and effort being put into researching and designing the products of the future.
Measuring R&D Spend
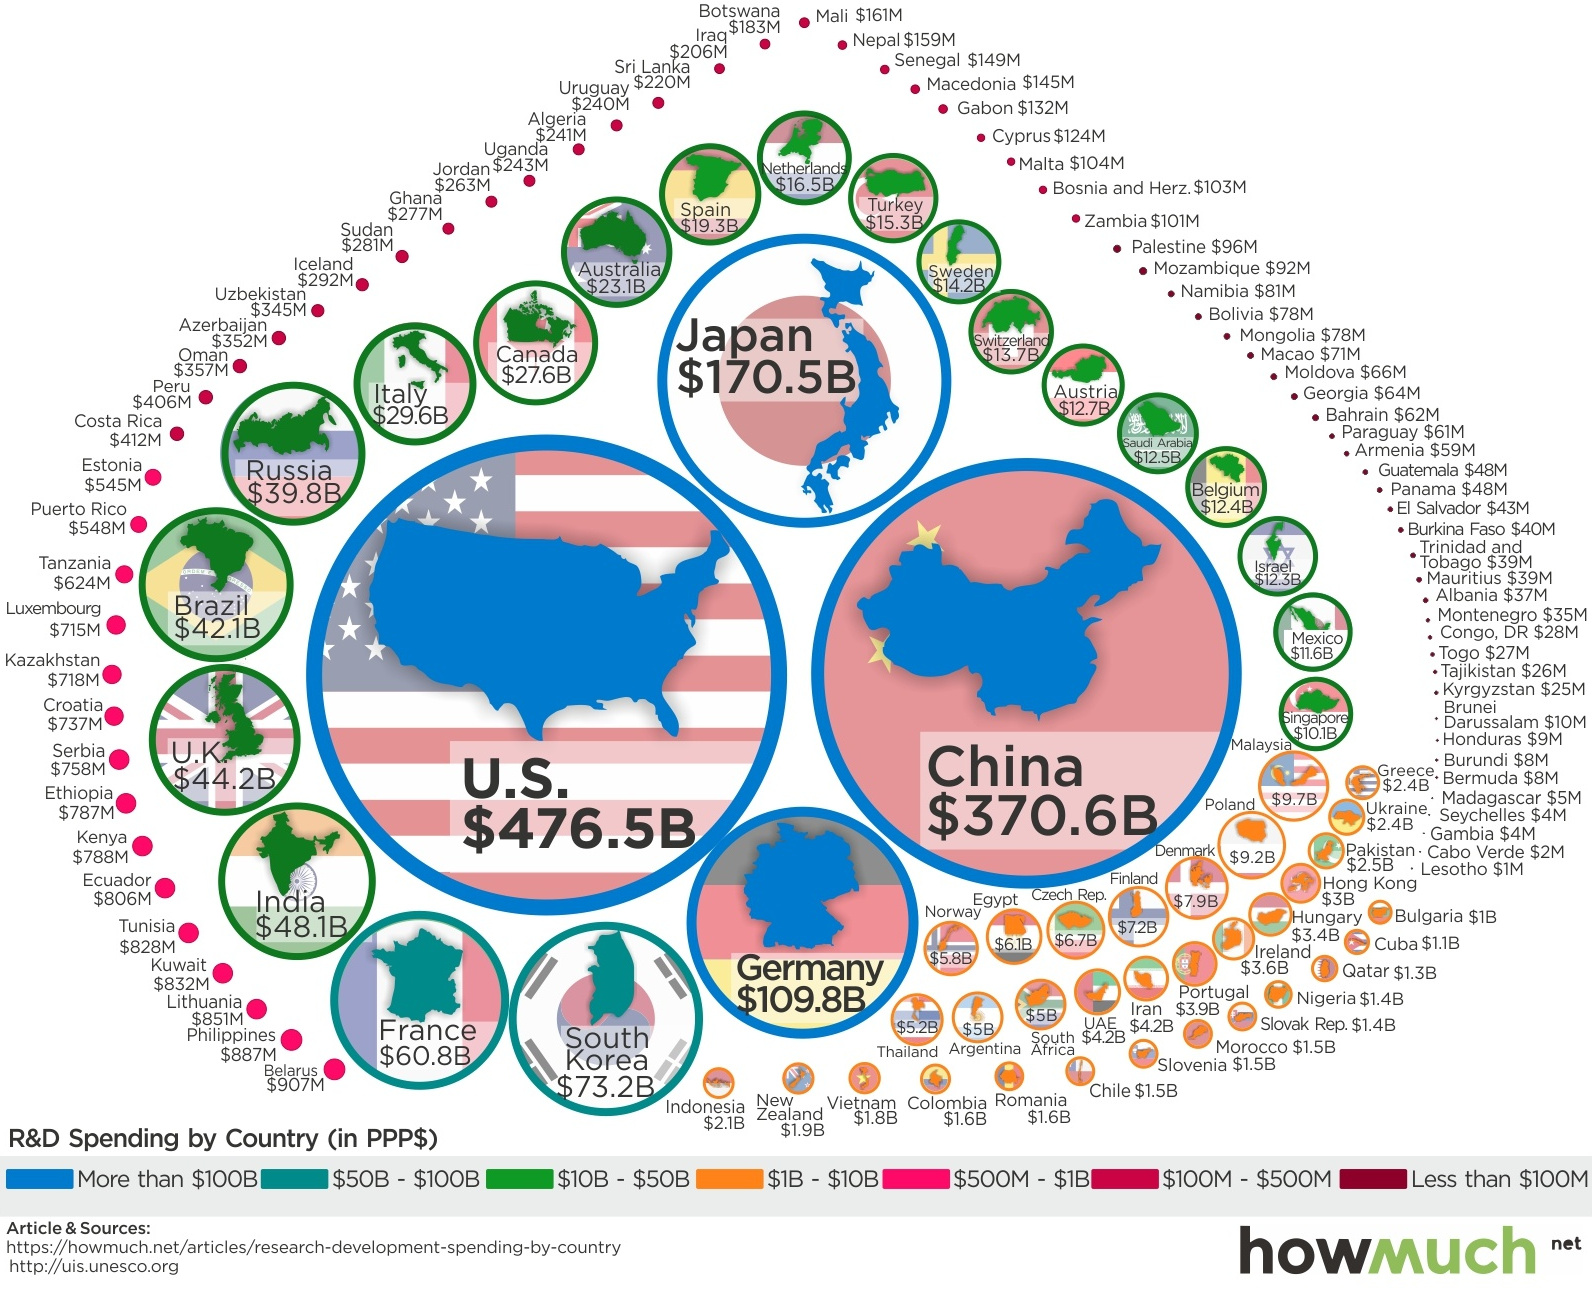
Today’s infographic comes to us from HowMuch.net, and it compares R&D numbers for nearly every country in the world. It uses data from the UNESCO Institute for Statistics adjusted for purchasing-power parity (PPP).
As you can see, R&D expenditures are heavily concentrated at the top of the food chain:
| Rank | Country | R&D Spending (PPP) | Global share (%) |
| All other countries | $249.8 billion | 13.9% | |
| #1 | United States | $476.5 billion | 26.4% |
| #2 | China | $370.6 billion | 20.6% |
| #3 | Japan | $170.5 billion | 9.5% |
| #4 | Germany | $109.8 billion | 6.1% |
| #5 | South Korea | $73.2 billion | 4.1% |
| #6 | France | $60.8 billion | 3.4% |
| #7 | India | $48.1 billion | 2.7% |
| #8 | United Kingdom | $44.2 billion | 2.5% |
| #9 | Brazil | $42.1 billion | 2.3% |
| #10 | Russia | $39.8 billion | 2.2% |
| #11 | Italy | $29.6 billion | 1.6% |
| #12 | Canada | $27.6 billion | 1.5% |
| #13 | Australia | $23.1 billion | 1.3% |
| #14 | Spain | $19.3 billion | 1.1% |
| #15 | Netherlands | $16.5 billion | 0.9% |
Put together the numbers for the U.S. ($476.5 billion) and China ($370.6 billion), and it amounts to 47.0% of total global R&D expenditures. Add in Japan and Germany, and the total goes to 62.5%.
At same time, the countries left off the above list don’t even combine for 15% of the world’s total R&D expenditures.
As a Percentage of GDP
Measuring R&D in absolute terms shows where most of the world’s research happens, but it fails to capture the countries that are spending more in relative terms.
Which countries allocate the highest percentage of their economy to research and development?
| Rank | Country | R&D (as a % of GDP) |
| #1 | South Korea | 4.3% |
| #2 | Israel | 4.2% |
| #3 | Japan | 3.4% |
| #4 | Switzerland | 3.2% |
| #5 | Finland | 3.2% |
| #6 | Austria | 3.1% |
| #7 | Sweden | 3.1% |
| #8 | Denmark | 2.9% |
| #9 | Germany | 2.9% |
| #10 | United States | 2.7% |
As you can see, countries like South Korea and Japan allocate the highest portion of their economies to R&D, which is part of the reason they rank so highly on the list in absolute terms as well.
Meanwhile, there are some smaller economies – namely Israel (4.2%) – that spend a far higher portion than normal on research.
Article by Visual Capital

