
SUMMARY
- Higher volatility & dispersion imply higher stock market risks
- The relationship between correlation and risk is not linear
- However, these market technicals do not behave consistently across time
[klarman]
Q2 hedge fund letters, conference, scoops etc
INTRODUCTION
Financial reporters frequently comment on stock market technicals like volatility and correlation, although most investors struggle to process this information adequately. The VIX jumping by 20% sounds concerning until compared to the historical volatility of the index, where increases or decreases of similar magnitude were frequent. In recent years, higher stock market volatility was typically associated with falling stock prices and a potential harbinger of a stock market crash. However, in the years leading up to 2000, volatility was high and stock prices were increasing. The implications of changes in stock market technicals on returns and risks are complicated. In this short research note we will investigate volatility, dispersion and correlation of the US stock market.
METHODOLOGY
We focus on volatility, dispersion and correlation of the US stock market for the period from 1988 to 2018. Volatility is measured by realized returns of the stock market with a one-month lookback. Dispersion is calculated as the absolute differences between stock prices and the market average on a daily basis, which is then averaged over a one-month period. Correlation is derived from the pairwise correlations of all stocks in the universe measured over a three-month lookback.
VOLATILITY, DISPERSION & CORRELATION IN THE US
The chart below highlights the volatility, annualised dispersion and correlation of the US stock market from 1988 to 2018. Bull markets can broadly be categorized by exhibiting low volatility and dispersion. Stock correlations appear to have structurally increased since the 2000s, perhaps reflecting more integrated capital markets. Some investors are concerned that ETFs lead to higher stock correlations, but 2017 and 2018, where passive investments reached a new record in terms of market share, exhibited exceptionally low levels of correlation.
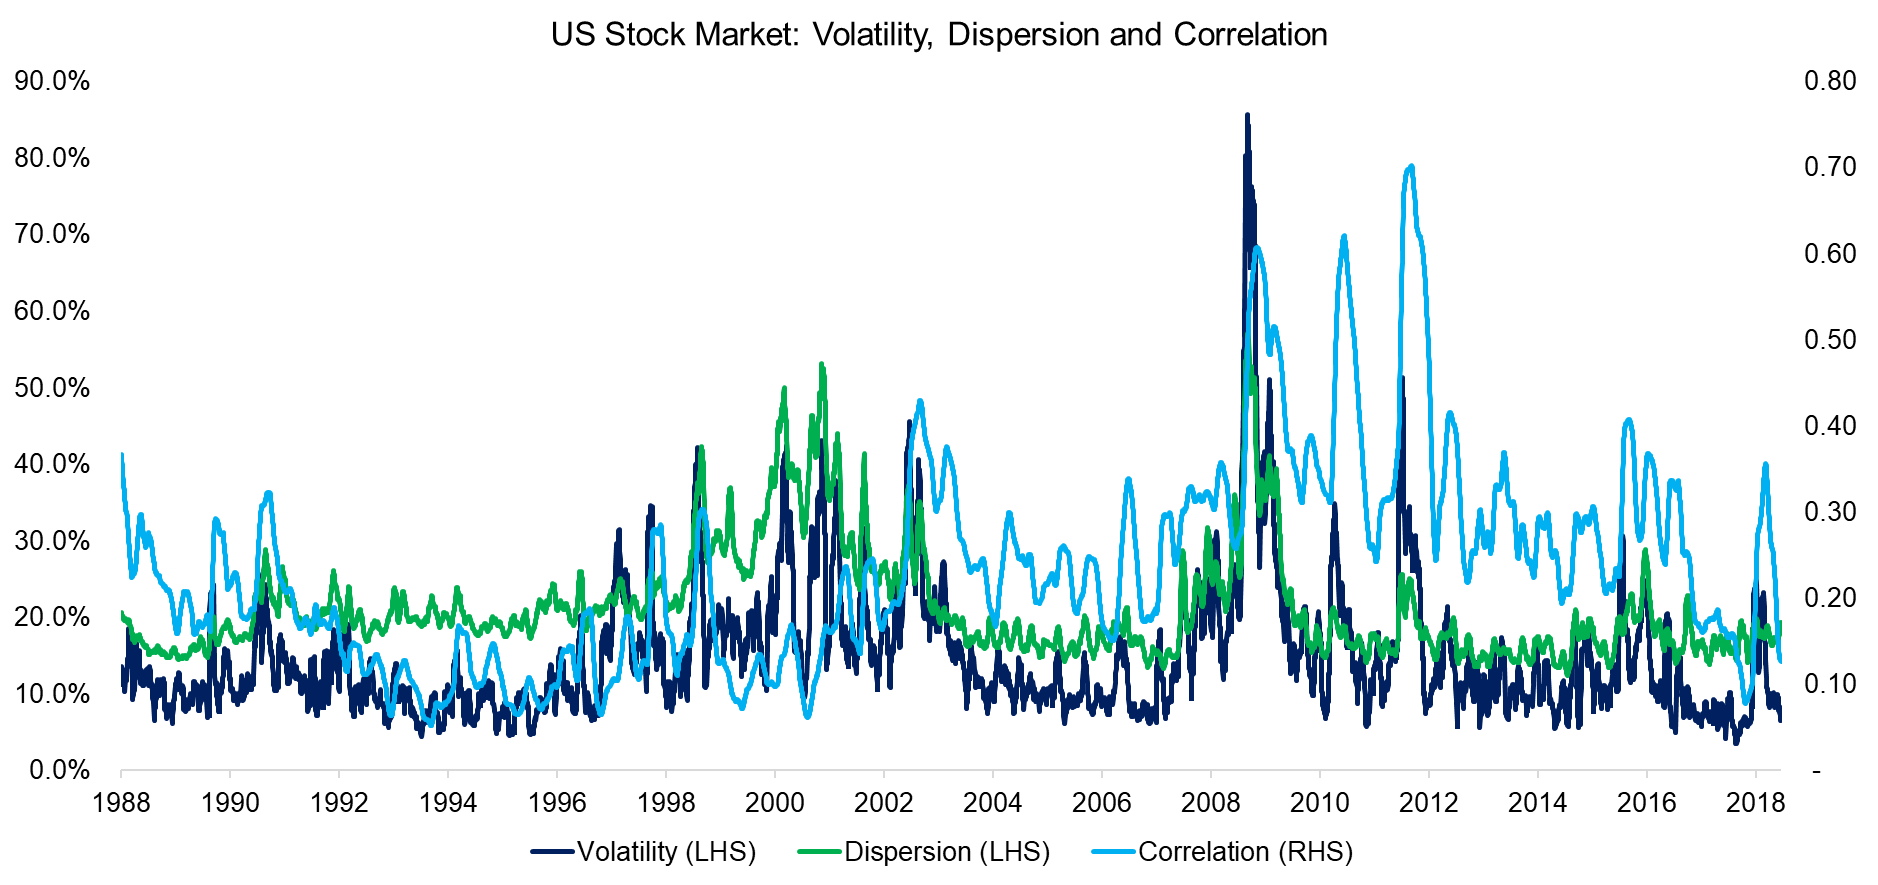
Source: FactorResearch
VOLATILITY & STOCK MARKET DRAWDOWNS
We analyse the relationship between stock market volatility and risk by measuring subsequent drawdowns, which investors are typically concerned about. The chart below highlights the probability of a 10% or larger drawdown in the next three months at various levels of volatility, which is an almost linear relationship as expected. The analysis also shows that there are few days with extreme levels of volatility.
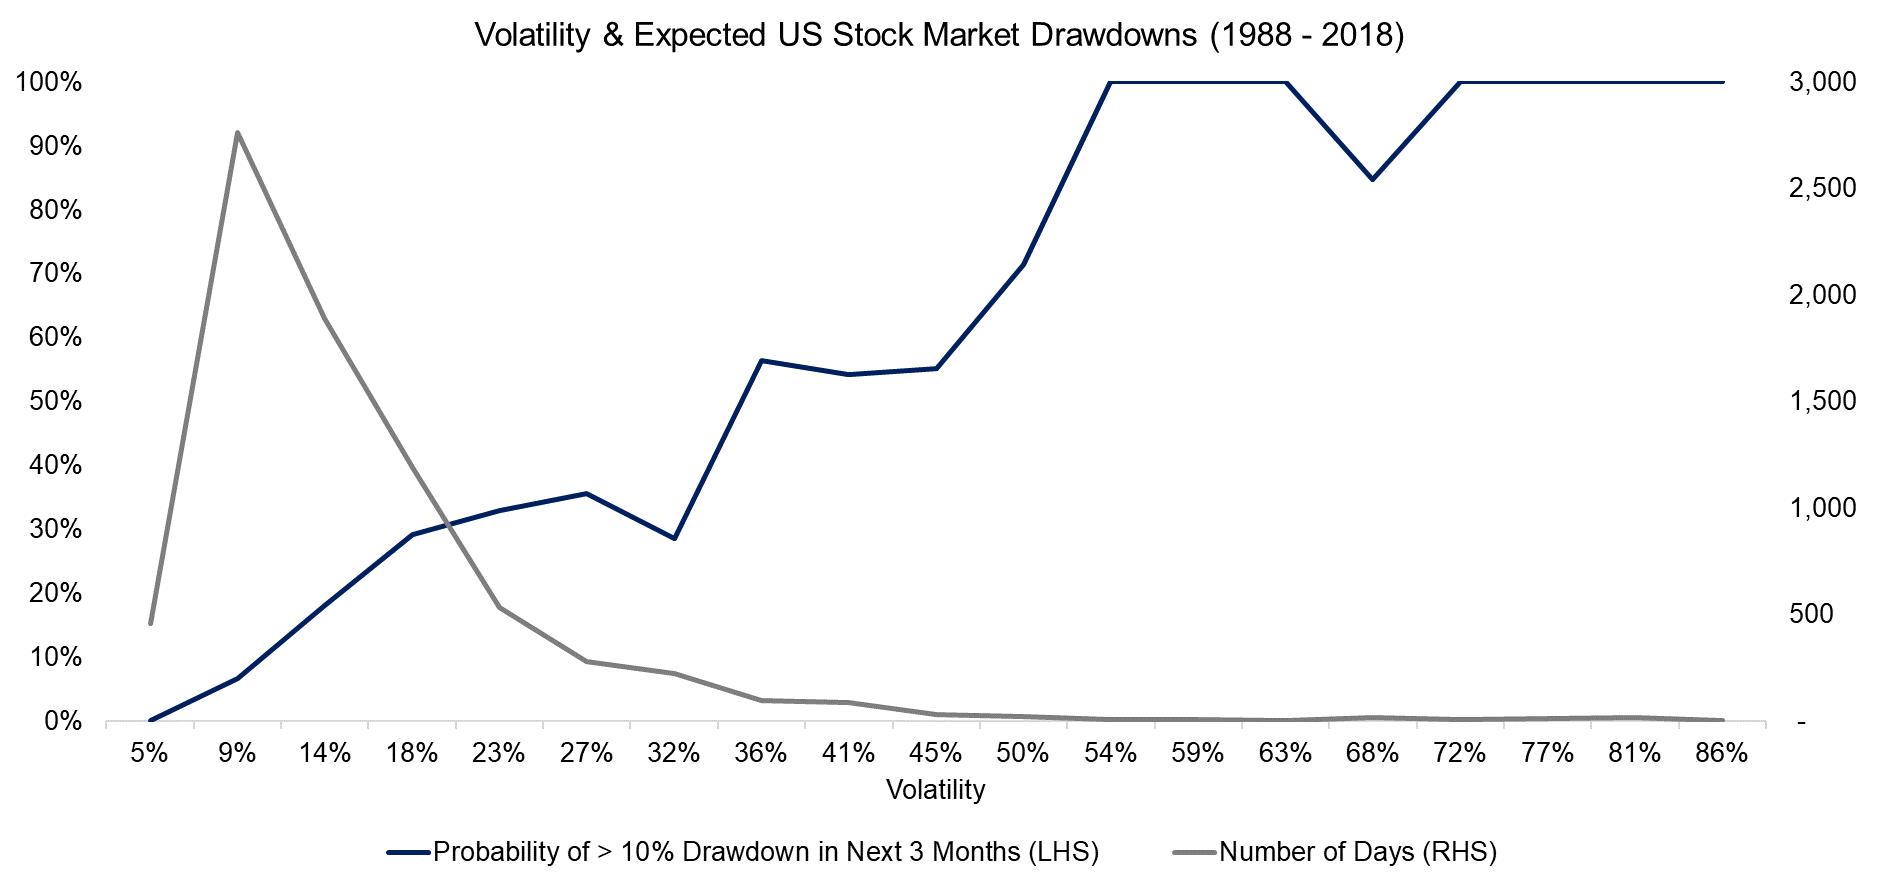
Source: FactorResearch
DISPERSION & STOCK MARKET DRAWDOWNS
Stock dispersion is similar to volatility, but not the same. There are periods when stocks exhibit high dispersion, but not necessarily high volatility, e.g. when companies report earnings. Inversely, there are periods when dispersion is low, but volatility is high, e.g. during a market sell-off. However, most often dispersion and volatility are correlated. Daily dispersion, similar to volatility, exhibits a strong positive relationship to the probability of drawdowns.
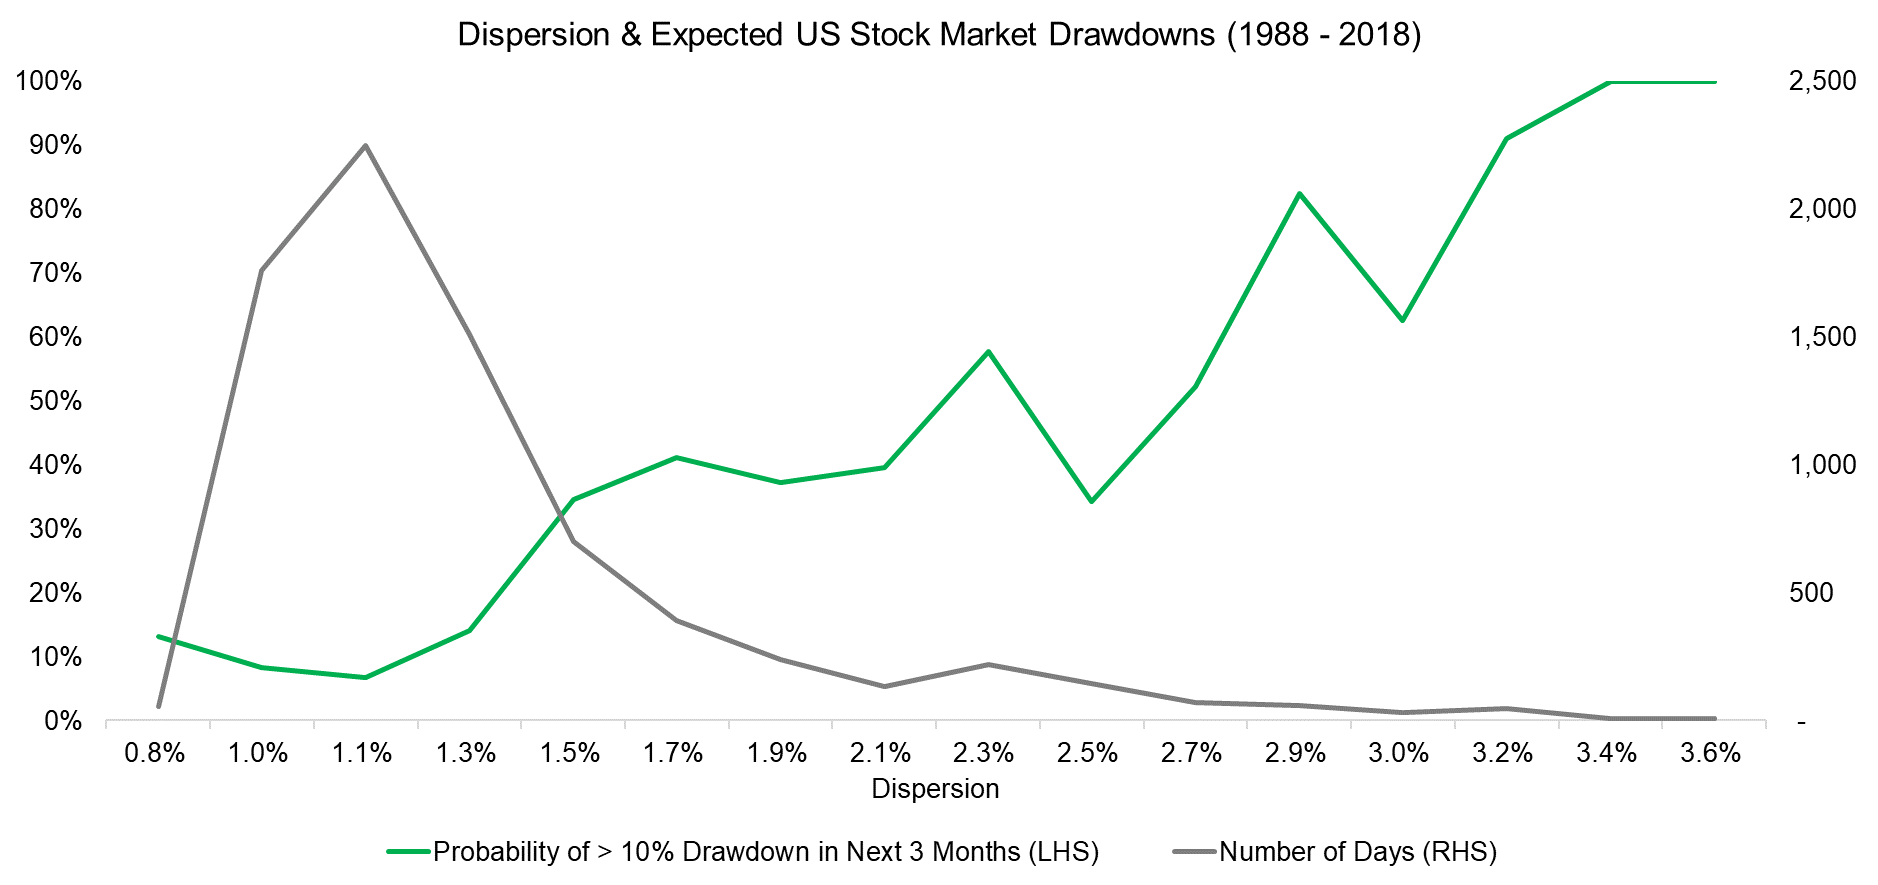
Source: FactorResearch
CORRELATION & STOCK MARKET DRAWDOWNS
Investors might expect that stock correlations increase when markets crash as investors tend to sell-off indiscriminately. Although this was the case in the Global Financial Crisis in 2008 and 2009, the correlations were relatively low during the implosion of the Tech bubble from 2000 to 2002. During the latter sell-off, there was much greater sector differentiation than in the former. The chart below highlights that the relationship between correlation and the probability of drawdowns is not consistent.
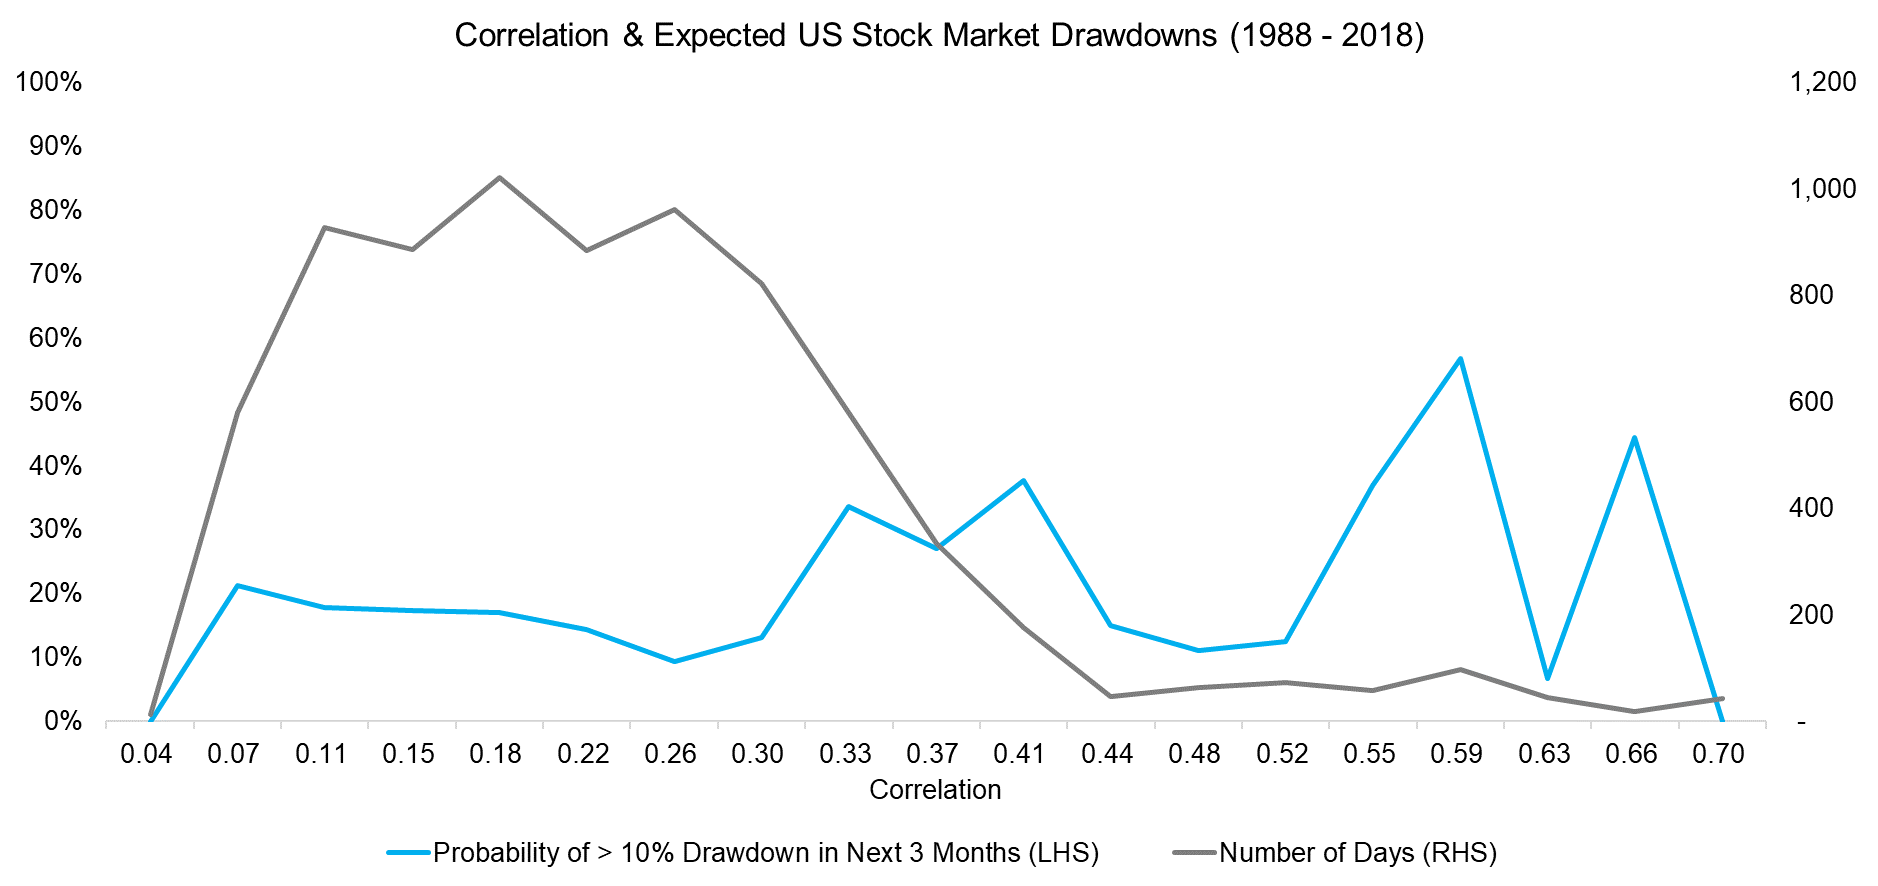
Source: FactorResearch
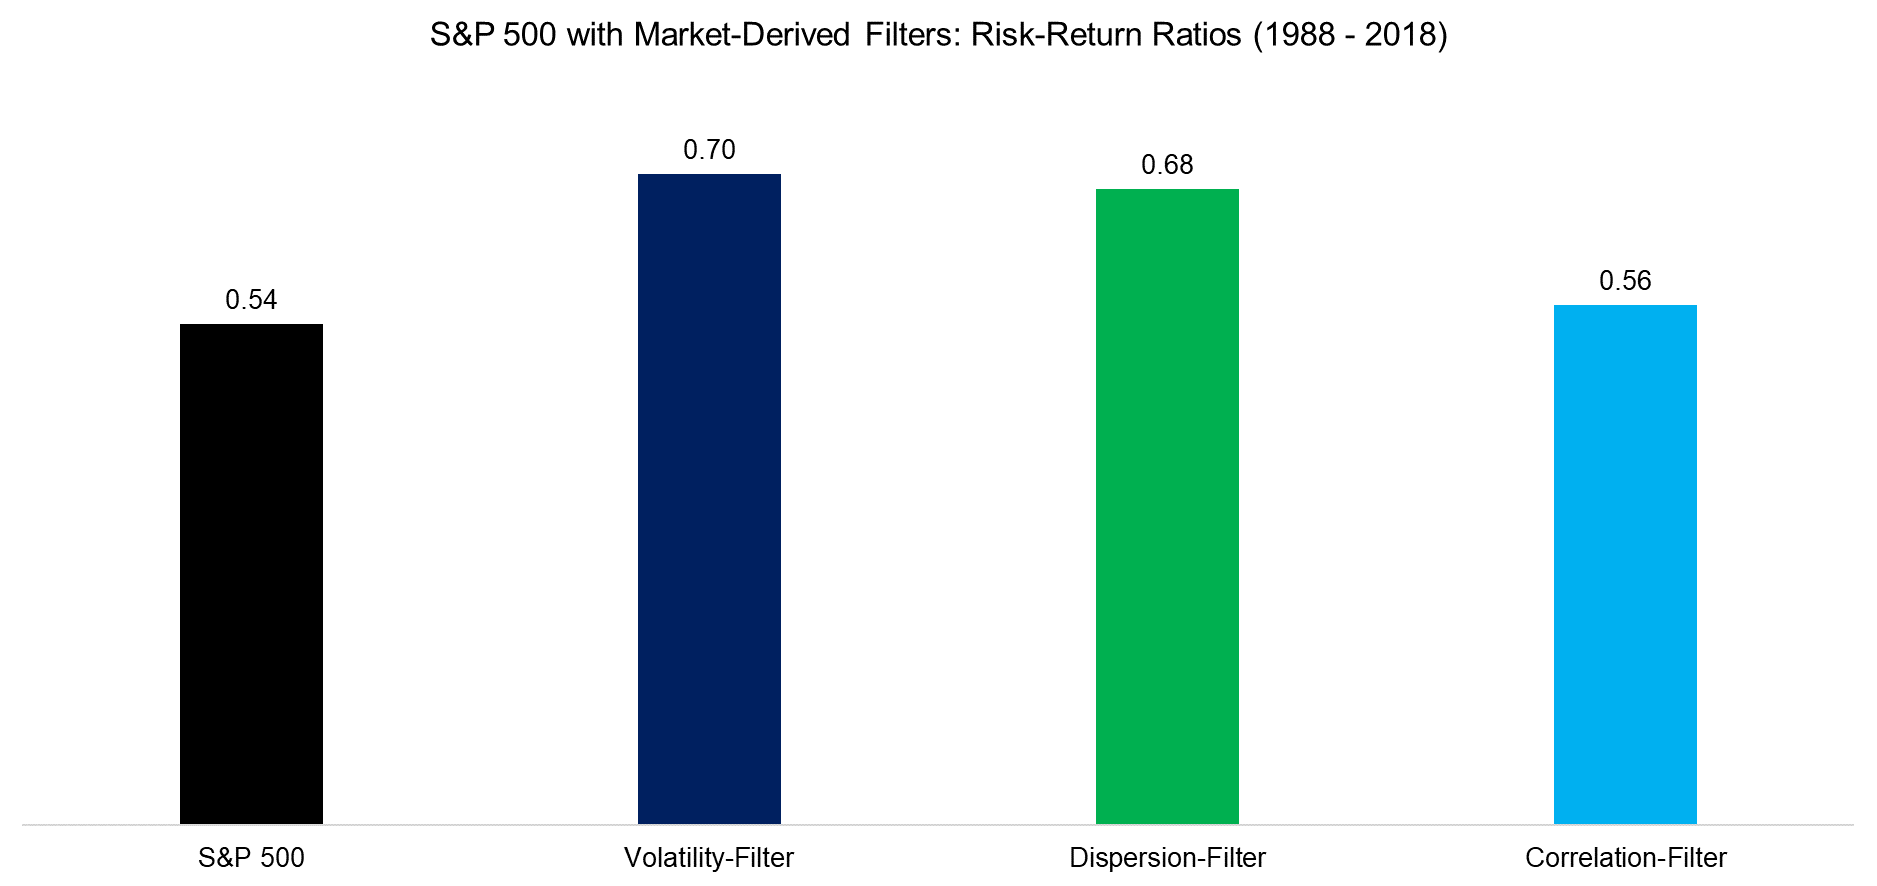
USING MARKET TECHNICALS FOR RISK MANAGEMENT OVERLAYS
Given the almost linear relationships between volatility and dispersion and subsequent drawdowns, investors may consider using these as signals for a risk management overlay for an equity portfolio. The analysis below compares a buy-and-hold versus risk-managed strategies for a portfolio consisting of the S&P 500. The equity exposure is reduced to 0% when the market technicals are in the fourth quartile, measured on a rolling-forward basis and with a time-delayed signal. We observe that the risk-return ratios improve by exiting the market when market technicals are extreme.
Source: FactorResearch
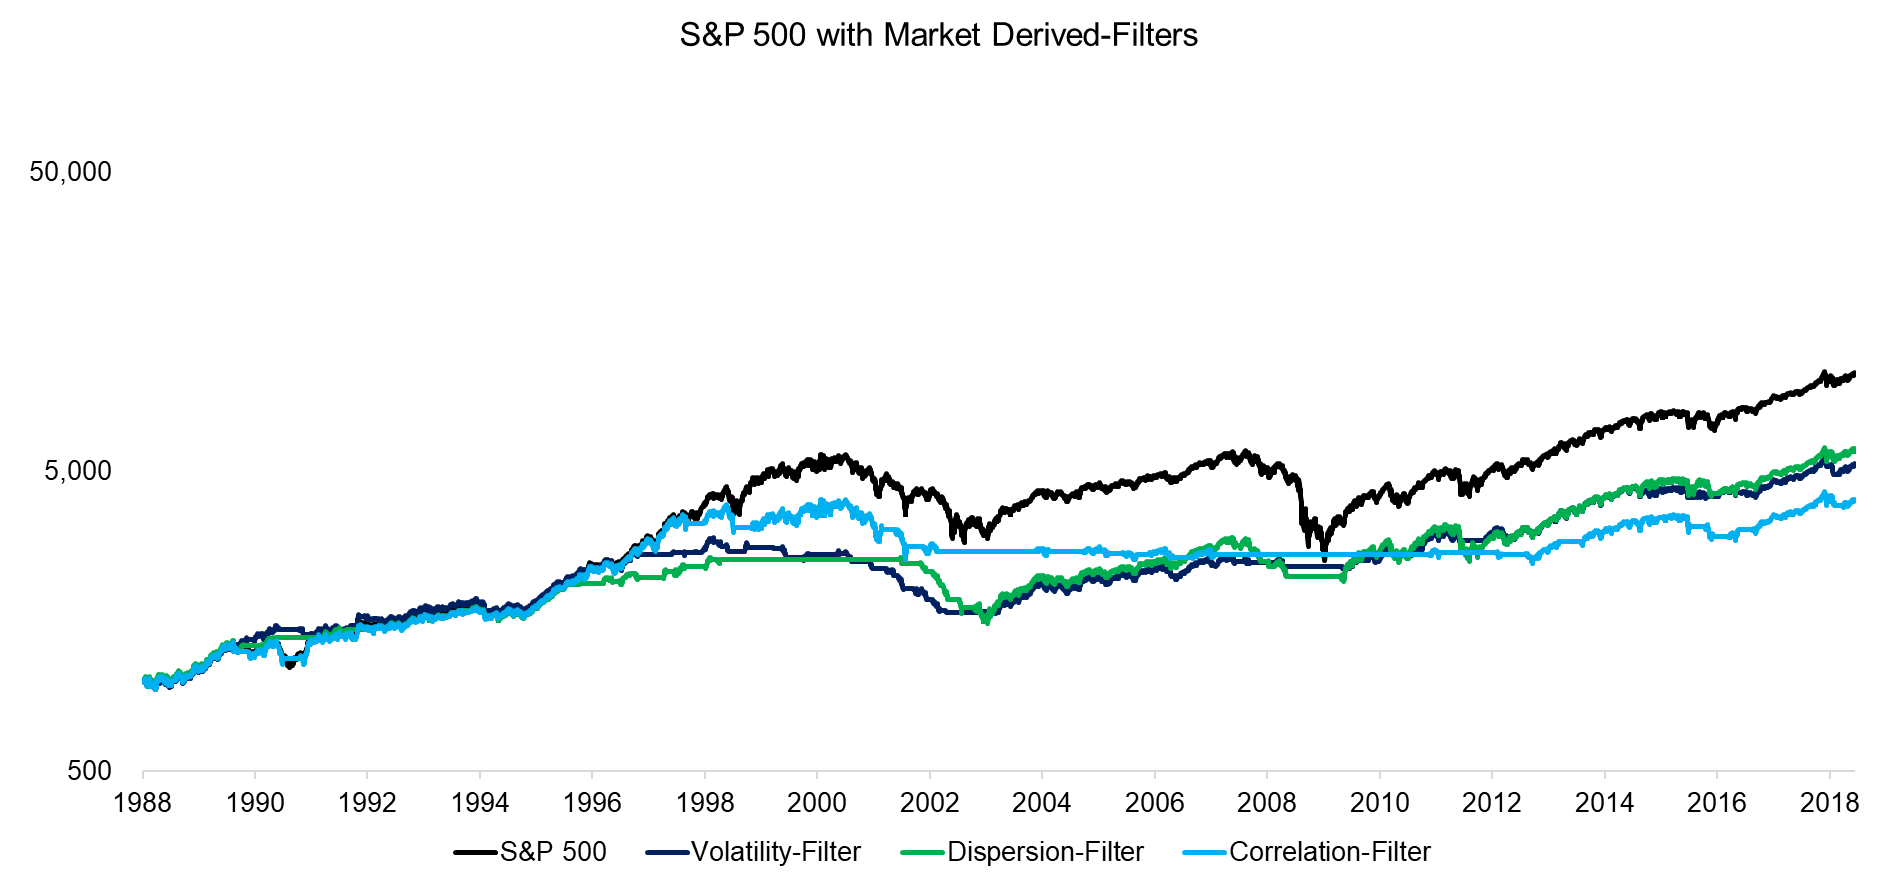
In addition to analysing the risk-return ratios, we compare the performance of the buy-and-hold versus risk-managed strategies, which exhibit lower total returns. The risk management overlays significantly reduced the drawdowns during the Global Financial Crisis in 2008 and 2009, but not during the implosion of the Tech bubble. The results reflect that the behaviour of the market technicals is not consistent across time.
Source: FactorResearch
FURTHER THOUGHTS
This short research note highlights that market technicals, which are frequently commented on by financial media, do not behave consistently in bull and bear markets across time. Investors should therefore be cautious about using these on a stand-alone basis, although they might be more effective when combining them. Even more attractive is likely a combination with less related signals, e.g. trend following.
RELATED RESEARCH
Market Timing with Multiples, Momentum & Volatility
Market Timing versus Risk Management
ABOUT THE AUTHOR
Nicolas Rabener is the Managing Director of FactorResearch, which provides quantitative solutions for factor investing. Previously he founded Jackdaw Capital, an award-winning quantitative investment manager focused on equity market neutral strategies. Before that Nicolas worked at GIC (Government of Singapore Investment Corporation) in London focused on real estate investments across the capital structure. He started his career working in investment banking at Citigroup in London and New York. Nicolas holds a Master of Finance from HHL Leipzig Graduate School of Management, is a CAIA charter holder, and enjoys endurance sports (100km Ultramarathon, Mont Blanc, Mount Kilimanjaro).
Article by Factor Research

