
Recently, I had a consultation with an entrepreneur who highlighted the problem of not knowing the principles of leveraged ETNs (Exchange Traded Notes). Piotrek, a successful entrepreneur, intended to invest most of his capital in shares of small gold mining companies. Due to his extensive experience, volatility that accompanies GDXJ was not a problem for him. The long-term prospects and profit paid for huge volatility in the portfolio counted. Piotrek suggested for a moment that instead of GDXJ it might be better to put capital in JNUG (3 times leveraged GDXJ), then I was touched. I realized that probably him and most of the readers do not fully understand how leveraged ETNs work and how their results diverge in the long run with expectations or information from the issuer’s prospectus.
Q3 2019 hedge fund letters, conferences and more
What we think vs. reality
I begin by showing you the GDXJ and JNUG chart. In theory, JNUG should change in price 3 times stronger than GDXJ. In the short term it works. See, however, what happens in the long run.
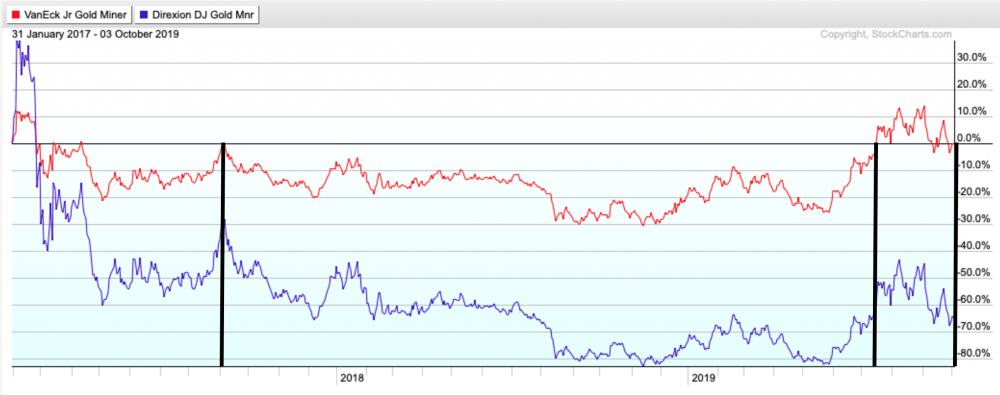
source: stockcharts.com
I marked GDXJ as red and JNUG as blue. The black line signals the moments when GDXJ price returned to the starting point. What happened with JNUG? After 6 months it incurred 30% loss, after 2.5 years the loss exceeded 50%. After less than 3 years, JNUG lost almost 70% even though the price of GDXJ was at the starting point, so as many people imagine JNUG should also go to zero. Why didn’t this happen?
Well, both leveraged and inverse ETNs work on the principle of daily rebalancing. They work great in the short term or when the price goes one way. However, the stronger the price change in both directions, the stronger the price divergence. I describe below how it exactly works. Instead of continuing the GDXJ and JNUG thread, I used materials from the 4th volume of the book “The Intelligent Investor of the 21st Century” which I should finish within a few weeks. I explained the specifics of leveraged and inverse ETNs on the example of ETF QQQ (giving exposure to technology companies). I did it for two reasons. First of all, I didn’t want to write about it again with something “ready” at hand. Secondly – the most important. GDXJ has huge volatility. VNQ or ETF on REITs has very low volatility. In order not to use extreme examples, I chose QQQ, which is characterized by average volatility, which in my opinion better reflects reality.
Here is an excerpt from the book.
What is daily rebalancing?
When accessing websites concerning leveraged or inverse ETFs, you may find that “for more than one day, the ETF may not have a perfect correlation with the underlying assets.”
Why? Everything thanks to the so-called daily rebalancing. Without going into details, I will explain everything on the example. To this end, I will use ETF QQQ investing in major technology companies and PSQ (short on technology companies). Theoretically, we should have a perfectly inverse correlation.
Let’s assume that both ETFs are 100 at the beginning.
On the first day, QQQ gains 20%. Of course, PSQ behaves the other way around and decreases by 20%.
After the first day, QQQ is 120 and PSQ is 80.
On the second day, QQQ decreases by 10% and PSQ increases by 10%.
This means that the QQQ value drops to 108, and the PSQ rates rise to 88.
Summary after 2 days:
- QQQ gained 8% (increased from 100 to 108),
- PSQ lost 12% (down from 100 to 88).
As you can see, due to compounding interest, the results can differ significantly. The turnout is bigger the greater the volatility. Example above is quite extreme, but this way I wanted to emphasize the importance of calculating the result for inverse ETFs (mentioned daily rebalancing).
The irony is that by investing in PSQ, we can lose, even if we predict the price change in the long term (i.e. QQQ decreases). It is enough that our investment lasts longer than a few days and will be accompanied by considerable volatility. This is perfectly illustrated by the graphics from the ETN PSQ prospectus.
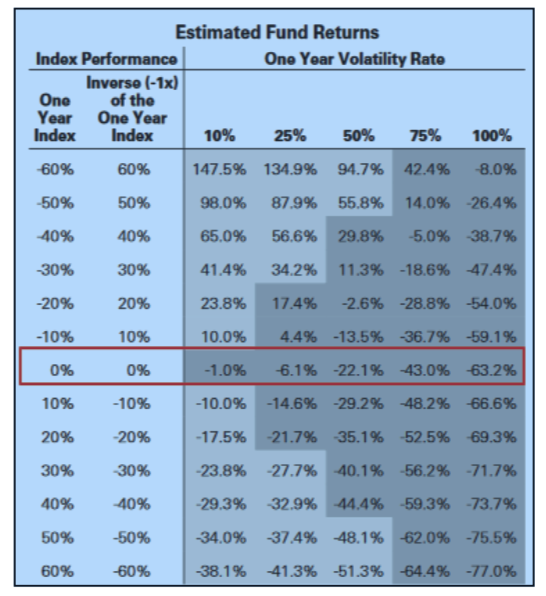
source: ETN PSQ prospectus
The table contains various scenarios for QQQ results (first column). The second column presents the result that theoretically should achieve PSQ. The next columns show the actual PSQ results depending on the volatility over the year.
Note the middle example, when QQQ earns 0% during the year. If volatility is very low, then PSQ will bring us a loss of 1% after a year. If volatility is gigantic, then PSQ could lose over 60%!
To sum up, for inverse ETFs timing is crucial. If we open the position too quickly and the entire investment is stalling, then our chances for a good result will decrease.
In addition to inverse ETFs, this issue also applies to leveraged ETNs (both regular and leveraged inverse ETFs). Here, I will also use examples to help you understand the situation.
Let’s recognize that our underlying assets are still ETF QQQ, mapping the movements of the Nasdaq 100 index. To ensure leveraged exposure, we can use ETN TQQQ. It is assumed to move in the same way as QQQ, but 3 times stronger. Case analogous to the previously mentioned GDXJ and JNUG.
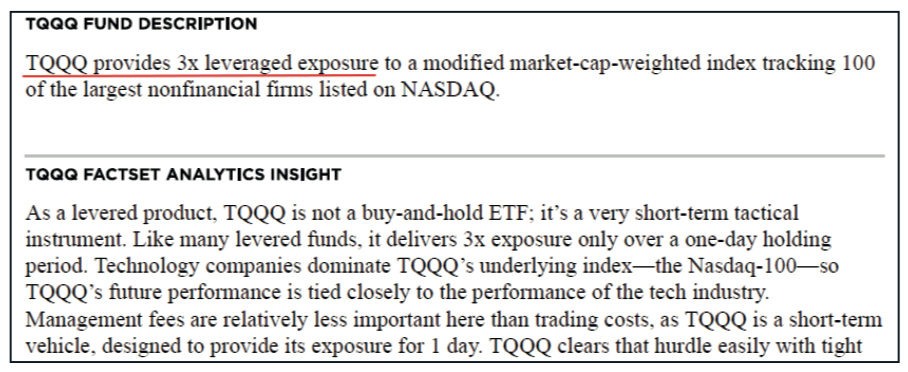
source: ETF TQQQ prospectus
In theory, if QQQ increases by 2%, then TQQQ should increase by 6%.
We will also take another 3-time leveraged ETN for analysis, but this time Inverse with the SQQQ ticker. In this case, if QQQ increases by 2%, then SQQQ should lose 6%.
Both in the case of TQQQ and SQQQ, issuers emphasize that their funds actually provide a 3x leverage, but within one day. In the long run, the results may diverge. Again, everything depends on volatility. For example – time.
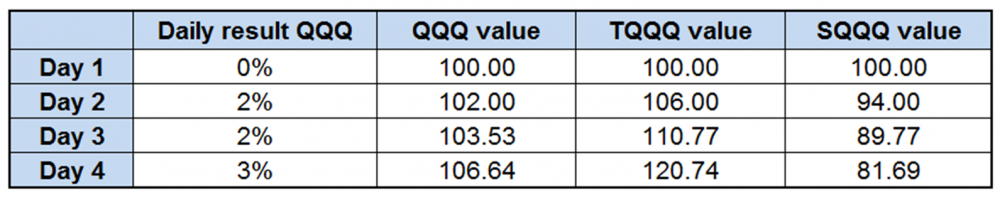
Let’s assume that on the first day all ETFs (QQQ, TQQQ and SQQQ) are 100. In the following days QQQ increases by 3%, then decreases by 2%, then increases by 4% and finally decreases by 2% again. What would the results of individual funds look like?
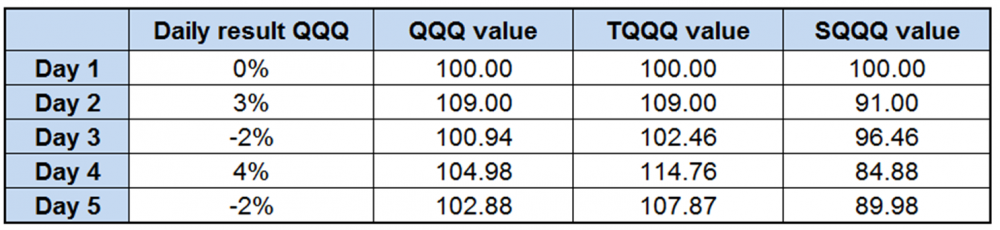
source: own elaboration
As you can see, after these few days, QQQ scored a cumulative increase of 2.88%. If the other ETNs simply replicated this result with a 3x leverage, then TQQQ should increase by 8.64%, while SQQQ should decrease by 8.64%.
What was the actual outcome? TQQQ increased by 7.87%, while SQQQ fell by 10.02%. Therefore, both leveraged ETNs performed worse due to daily rebalancing and high volatility on the stock exchange.
source: own elaboration
For the sake of clarity, let’s also check the example where the stock market goes in a specific direction, there is no volatility, and QQQ is still gaining.
In this scenario, QQQ strengthened by 7.7%, so TQQQ and SQQQ should rise and fall by 23.1% respectively.
In fact, TQQQ rose 24.36% and SQQQ fell 20.76%. Both leveraged ETFs fared better than they should theoretically.
So you can see that the lack of volatility is conducive to:
- inverse ETFs
- leveraged ETFs,
- leveraged inverse ETFs.
Let’s remember, however, that the stock market nevertheless brings mood swings more often than uninterrupted increases or decreases. Therefore, inverse ETFs should be used when we have a strong foundation and treat them more as a short-term solution. In turn, leveraged ETFs should be avoided. They work perfectly if everything goes our way, e.g. on the gold market in the first half of 2016 when GDXJ went up by 200%, JUNG 1300%. These types of increases attract attention and turn off common sense. Let’s remember this because in the case of ETNs, especially those leveraged or based on highly variable assets, the results may and in the long run will be very different from expectations. Finally, as a caution, take a look at the long-term result of GDXJ and JUNG.
Article by Independent Trader

