
Global equities rallied in week 5 on the back of a dovish Federal Reserve — with Asia, Latam, and EM all rising 4%+. Technology and real estate were notable standouts, while financials lagged following a move lower in global rates.
Q4 hedge fund letters, conference, scoops etc
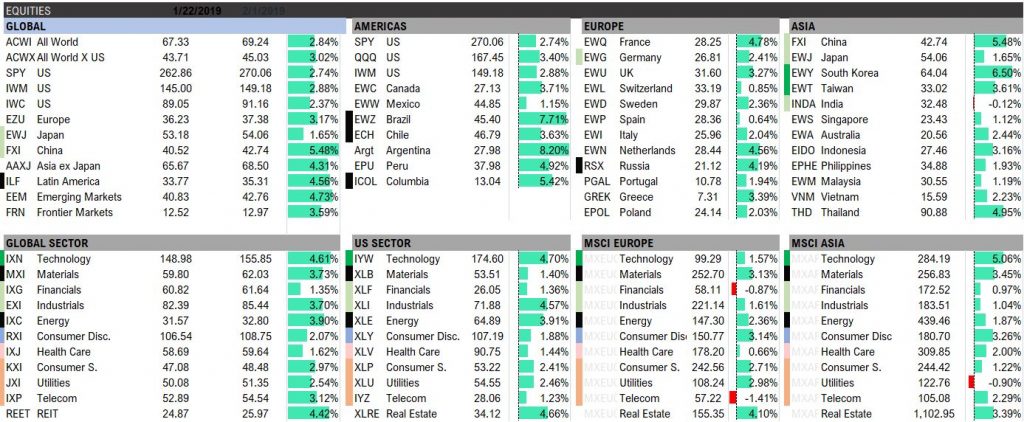
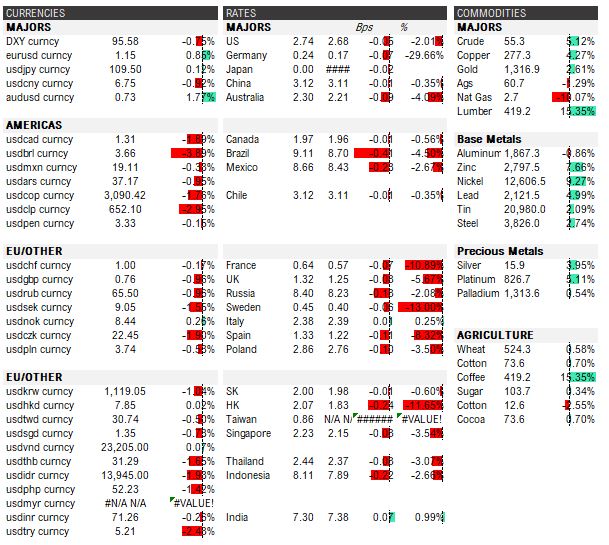
The dollar was down 75bps, with significant weakness against Latam, as well as AUDUSD. Crude, copper and gold all had a very strong week, while lumber followed through with a +15.3% move. Base metals were also notably higher, with nickel leading the way (+9.2%). Rates were lower across the board, with most of the weakness concentrated in Europe.
There have been a few mixed signals over the past couple weeks, as equities and commodities have moved decisively higher, yet cyclicals in Asia and Europe have remained weak, along with rates in Australia and Europe. It seems the markets are trying to figure out if global growth is bottoming out or beginning its next leg lower. Commodities would imply global growth is picking up, but rates are implying the opposite.
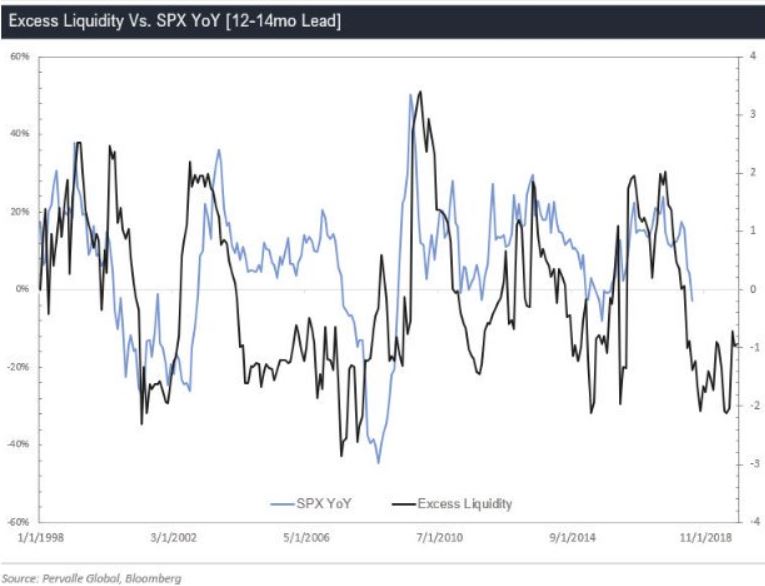
We sit in the latter camp, as nearly all of our leading indicators and liquidity models have not picked up. For example, excess liquidity will not put in a bottom until late summer/early fall of this year, as shown below.
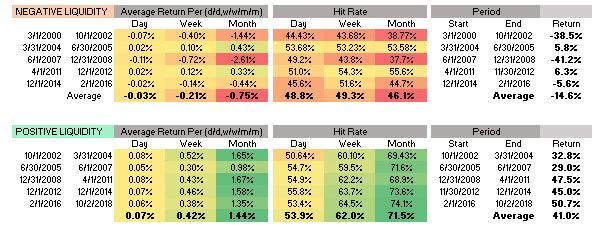
Historical backtests indicate you want to be cautious until then, with only 46.1% of rolling monthly returns positive during deteriorating liquidity environments, while improving excess liquidity sees that jump to over 71.5%. The return profiles are also quite compelling, with an average 41% gain for positive environments and -14.6% for negative.
On the fundamental side, we saw new home sales beat expectations, printing 657k on an estimate of 570k, but sales declined 7% from the prior year. This looks like it will continue trend given the historical lead of home buying conditions.
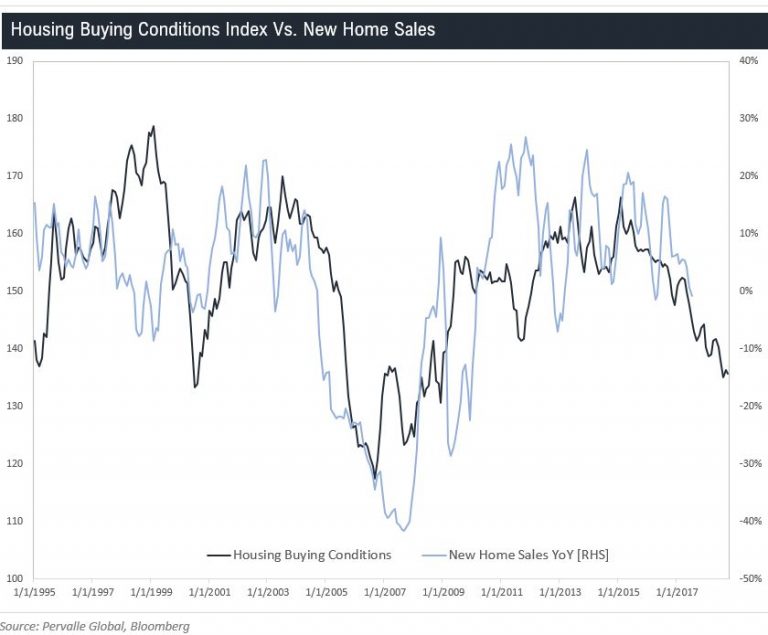
Pending home sales was also ugly, down 9.5% YoY.

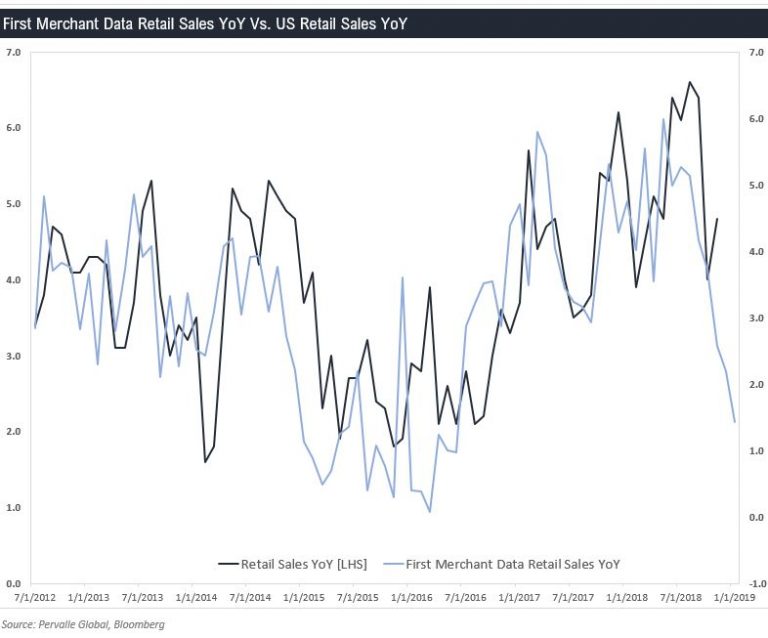
And there is a good chance that retail sales miss estimates given that the credit card data has rolled over.
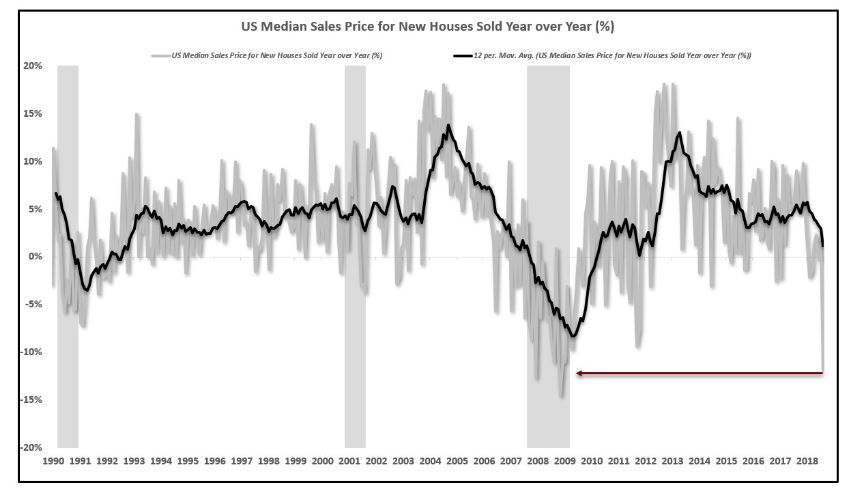
The wealth effect may be starting to play into the data as well, shown below by the large drop in median home prices from EBP Research.
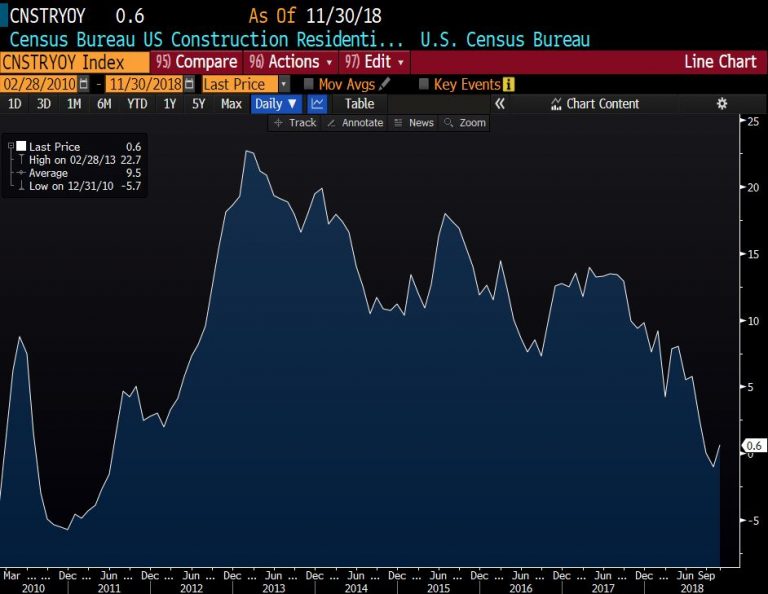
New residential construction spending is also declining, which has historically led the broader economic data.
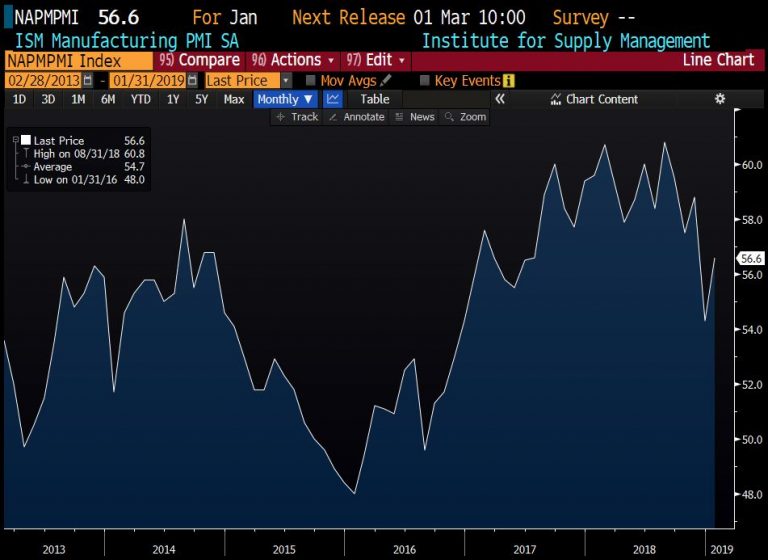
Though on the positive side, the ISM bounced, but it is still trending lower and should follow regional surveys along with prices paid.
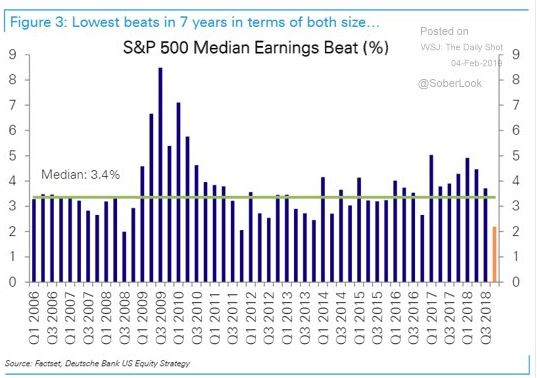
Earnings season is almost half way done, with 46% of SPX companies reporting so far. 70% have beat EPS expectations, slightly below the 5 year average of 71%. 62% of companies have beat sales expectations, which is above the 5 year average of 60%. While headline numbers are showing near average beats/misses, Deutsche Bank points out that median earnings beats are significantly below historical averages. Given our leading indicators, we see EPS continuing to come in until the end of 2019 – which will also keep the Fed on hold as we outlined in Bonds and Chill.
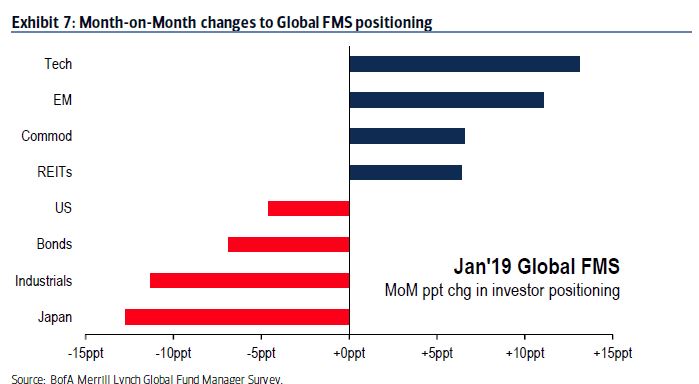
With the Fed on hold and possibly cutting, emerging markets and dollar sensitive assets have done well, leading to a sharp rise in EM positioning.
The consensus view seems to be China’s stimulating efforts, anywhere from 3-7% of GDP, should lead to a pickup in economic growth. Breaking down the numbers, this is likely not enough to move the needle as the decline in the rate of credit creation YoY is 7.7% of GDP. Therefore, an increase of 3-7% of GDP would lead to flat credit growth YoY.
The Chinese have thrown the kitchen sink at increasing credit creation, yet we still have not seen an uptick, which leads us to believe the deleveraging unwind is outweighing any potential stimulus efforts. In order for us to be positive on global economic growth, we will need to see Chinese M1 turn higher, which we will get a hint of in the following weeks.
This leads us to the dollar, which is at an interesting juncture. The recent moves from the Federal Reserve, positive relative performance of the rest of the world, current positioning, and increasing deficits would suggest the dollar heads lower; however, the scenario outlined above with continued weakness in China would suggest the dollar would head higher.
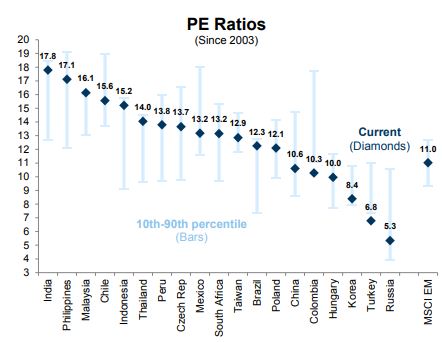
This is something to watch over the coming weeks/months and will likely drive the EM trade, which is now becoming a consensus long among managers. Given our view on China, Brazil looks interesting on the short side, as China represents roughly 32% of Brazil’s exports. Returns over the past 30-70 days are in the 97th percentile and managers are shown above are quite overweight. The market is not that cheap either, near its highest multiple since 2003.
Industrial production is also rolling over with the rest of the global macro data, while price makes 52 week highs.

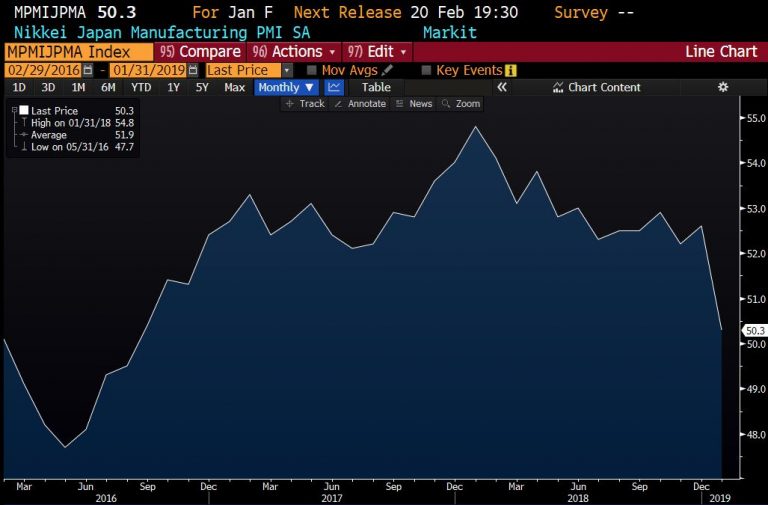
Turning to Asia, we see the same type of deterioration, as Japan’s PMI took a sharp move lower.
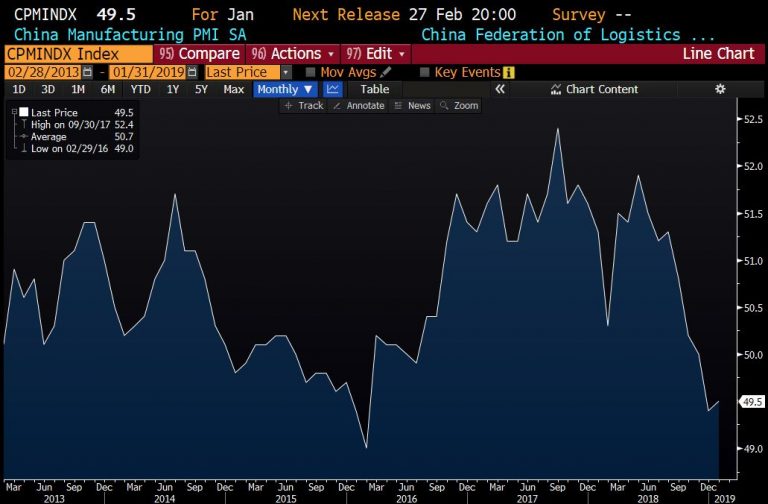
Which brings us back to China, the driver of global growth, with its PMI still in contraction territory.
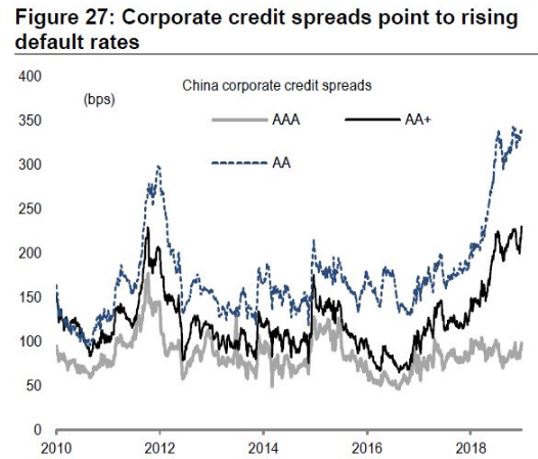
The credit markets are saying this is not good given the continued spread widening. To be positive on global growth prospects, we would likely need to see a 50% retrace in Chinese spreads.
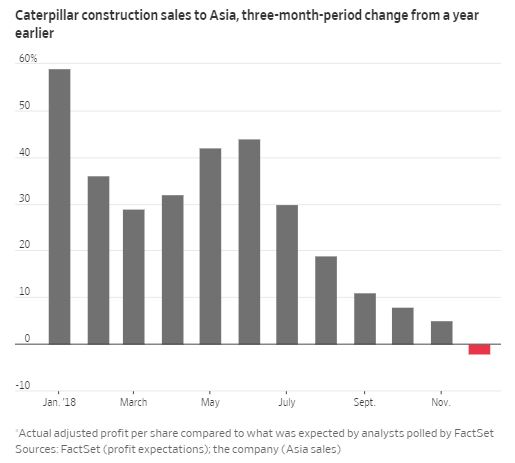
There has also been a significant amount of comments on weakness in China from the C suite, which we can also see below from CAT’s 3mo construction sales.
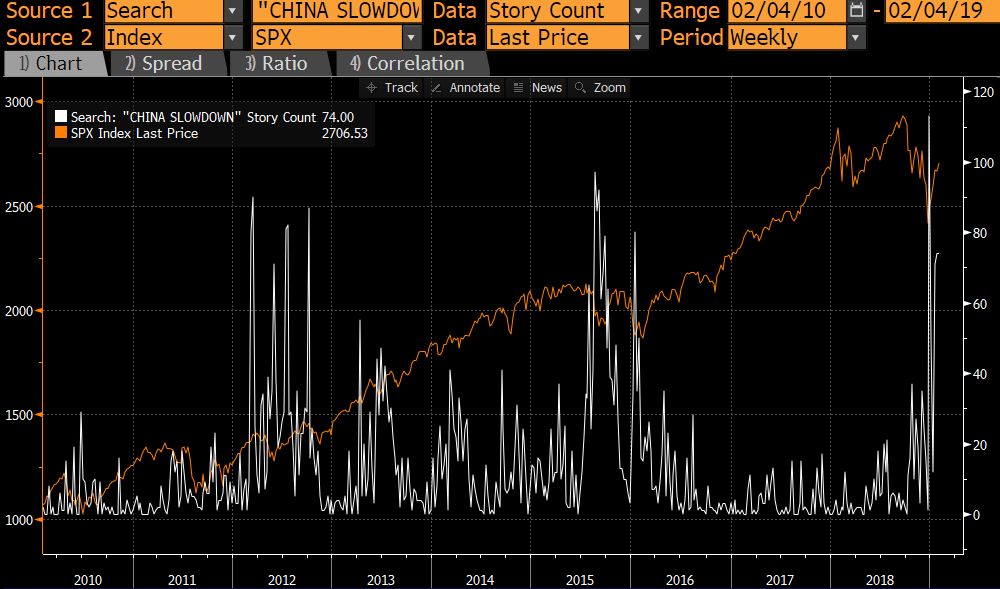
Again, we think that the consensus is China is slowing and stimulus will lead to a global growth pickup, but we are still in the camp that China is not out of the woods until we see M1 start to reverse higher. Given the story count on China slowing, as well as China stimulus, we think participants believe that China’s efforts will yield similar results as they have in the past. We think you fade that, as there are no signs in the data.
Have a good week.
Article by Teddy Vallee, Pervalle

