
Global markets were bid in week two rising 2.4%, led by the Americas (IWM +4.73%, ILF +3%) and Asia Ex Japan (2.9%).
Q3 hedge fund letters, conference, scoops etc
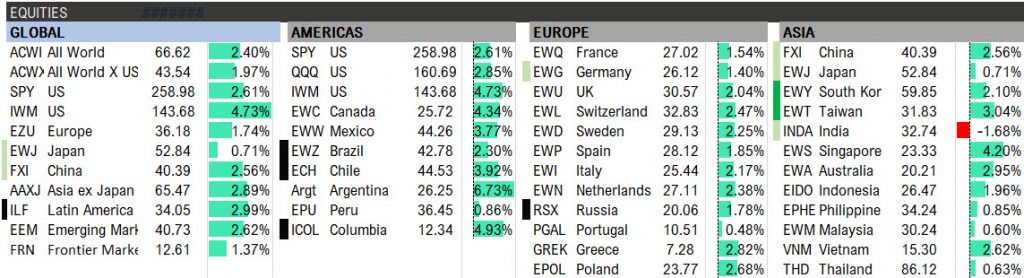
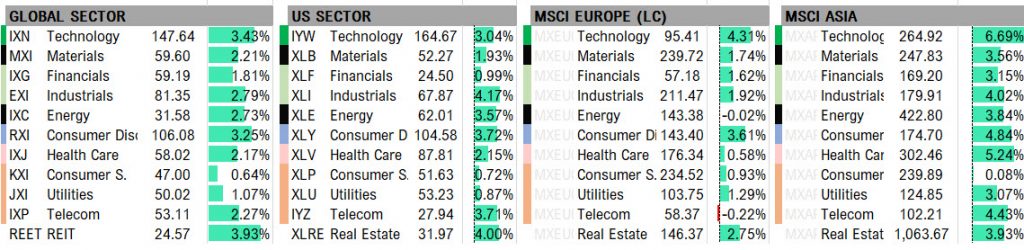
Sectorally, technology was strong across the board, with Asia tech +6.7% w/w. Energy was bid on the back of crude’s 7.6% gain, and industrials were notably higher.
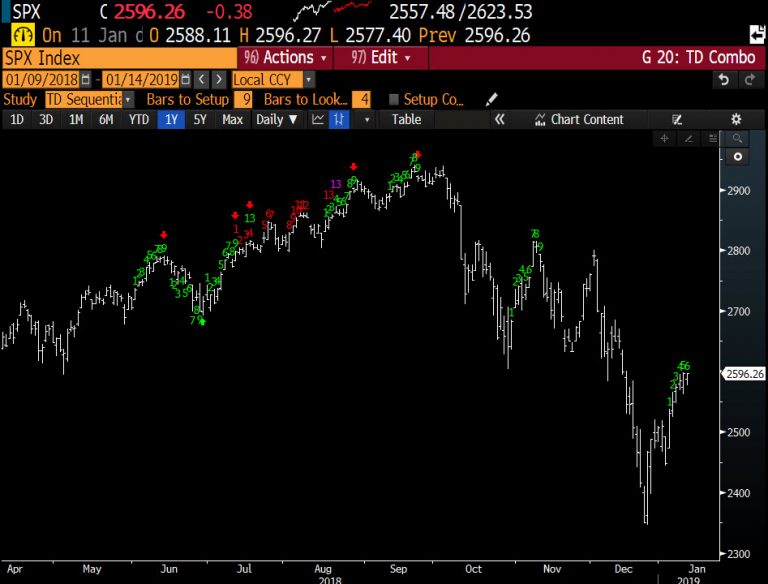
While markets have started off the year strong, we are beginning to see some upside exhaustions, with the S&P, NDX, and Russell all on 6 / 9s.
Euro Stoxx 600 on 9 / 9

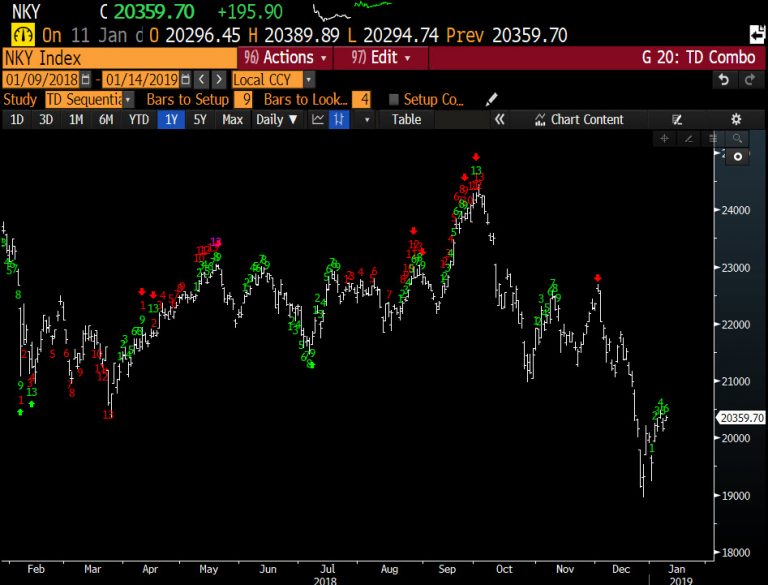
Japan on 6 / 9 (EWJ 9/9)
And China on 6 / 9 as well.
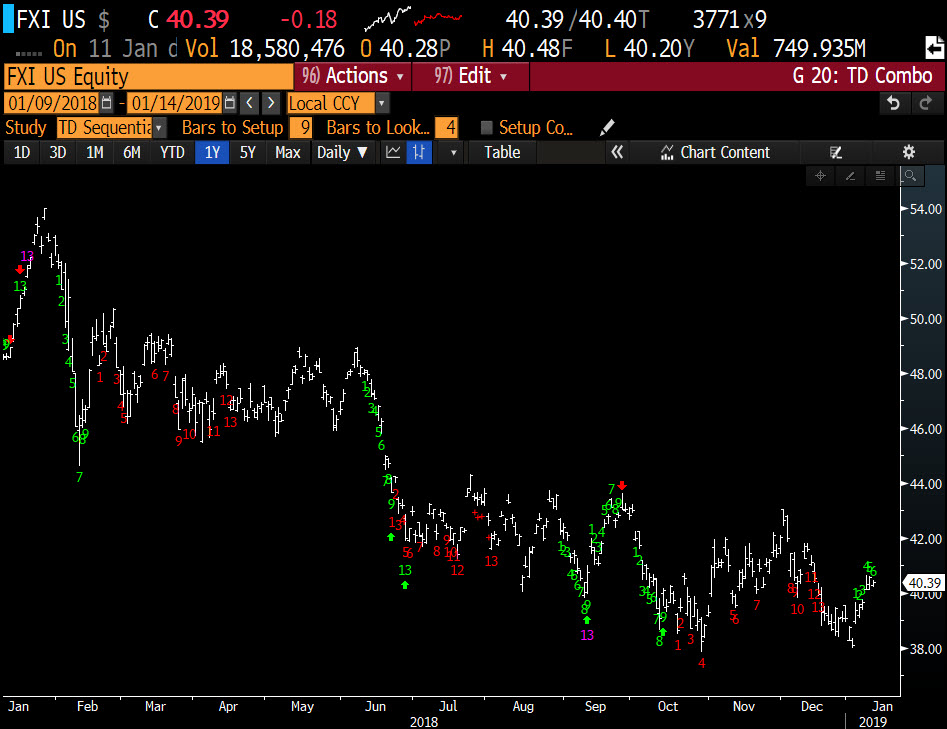
Market optimism may be a result of China throwing the kitchen sink to support the economy with a few initiatives:
- China to cut small co’s taxes by 200B Yuan annual for 3 years
- China reported to increase target budget deficit this year to 2.8% from 2.6%
- China approves $125B of rail projects in fiscal stimulus
- China cuts RRR by 1%
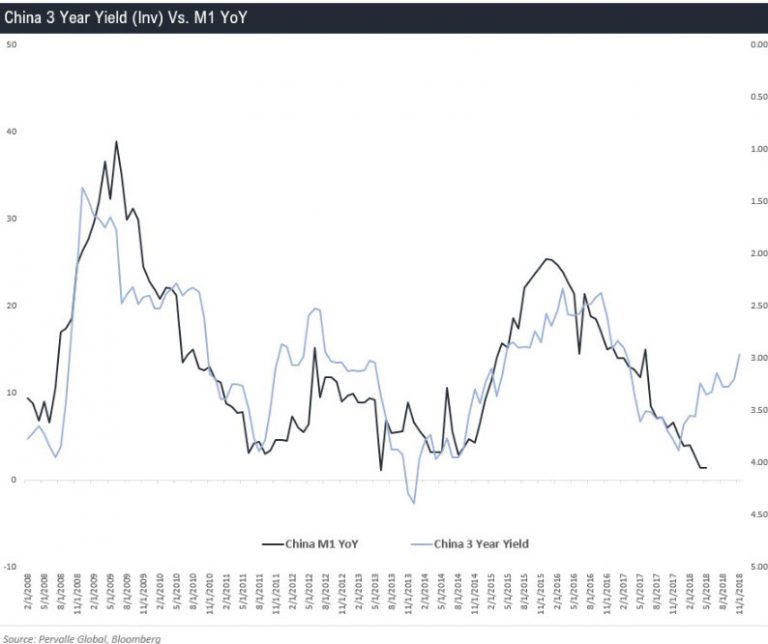
But as we outlined in Bonds and Chill, the next leg of global growth will be a driven by China’s ability to expand M1, which based on RRR cuts and falling 3 year yields seems probable.
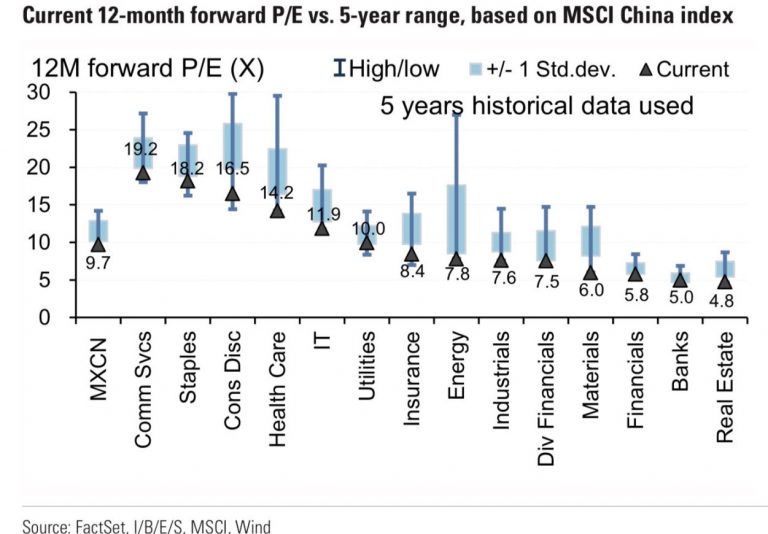
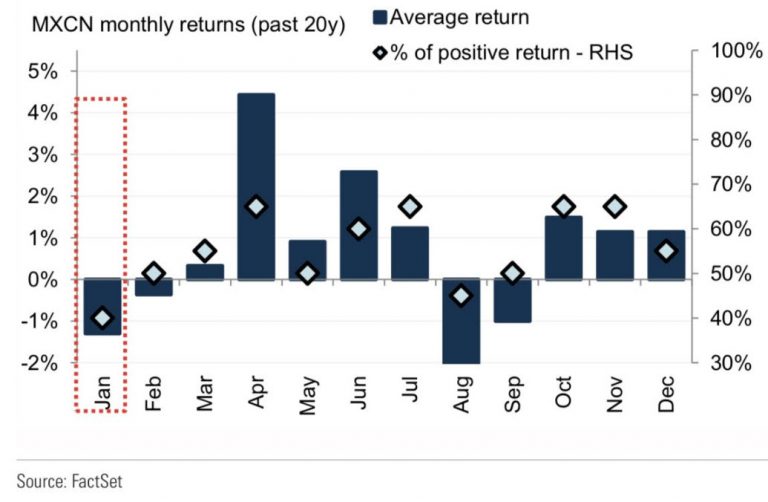
And under the assumption that this turns higher, Chinese equities look interesting from a valuation perspective.
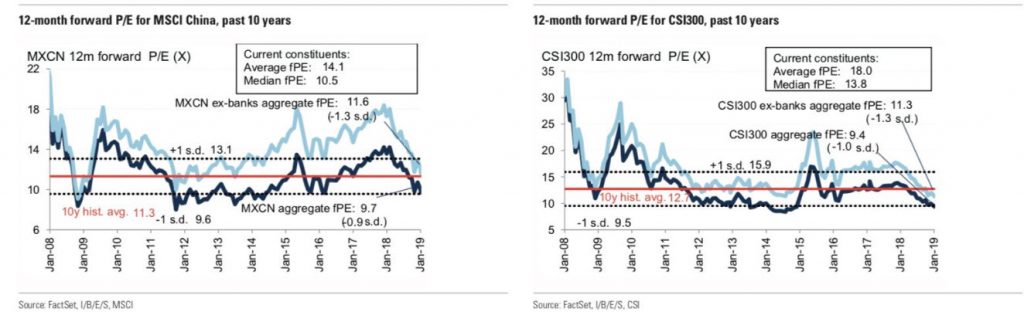
Across nearly every sector.
Specially from March to June given historical seasonals.
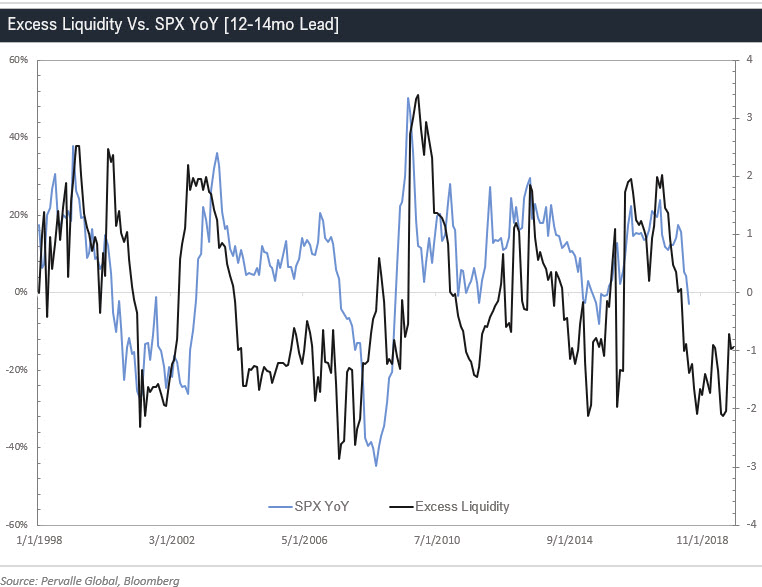
But global liquidity still remains a concern into the summer.
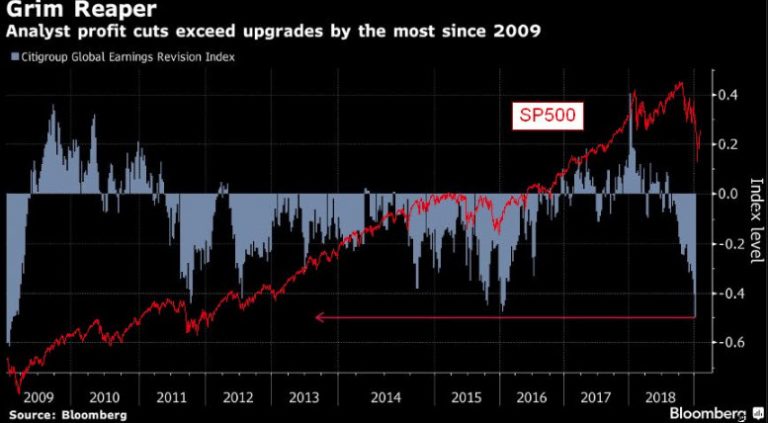
And spreads are saying Spoos might need another date.

As EPS estimates come in materially.
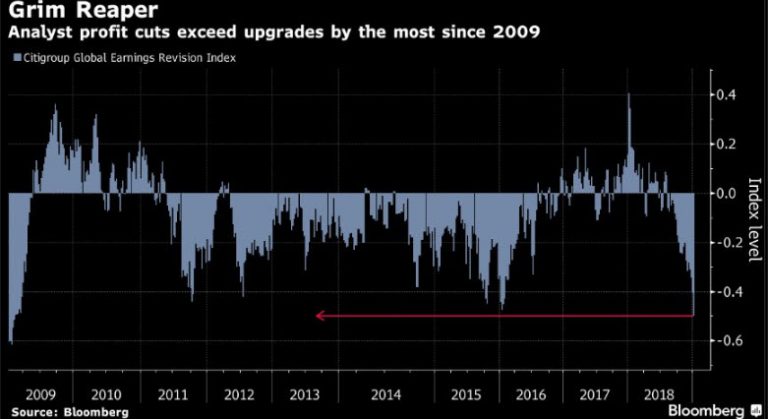
Though @McClellanOsc indicated this might be a contra indicator.
And we could potentially see the market grind higher, as capital chases price following record outflows.
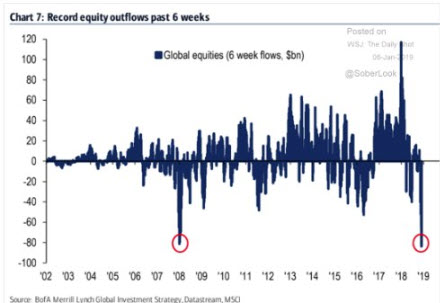
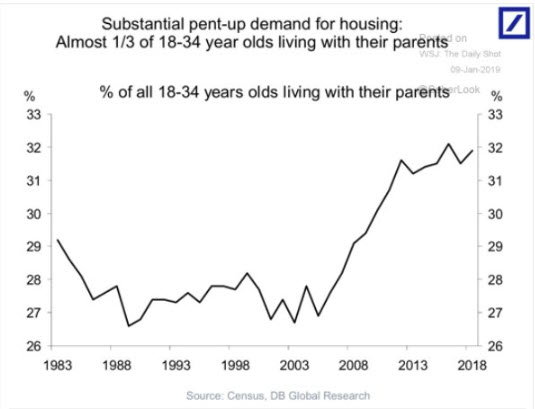
Maybe that will finally force the kids out of the basement.
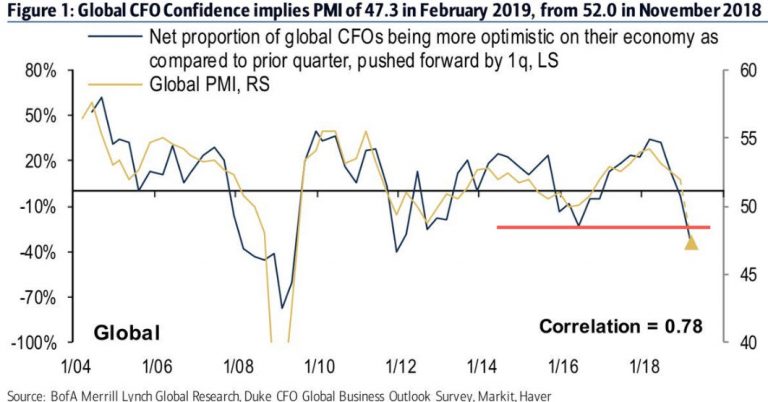
And improve confidence.
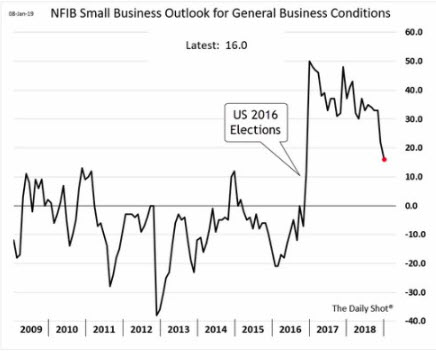
Especially among CEOs. (H/t @stockboardasset)
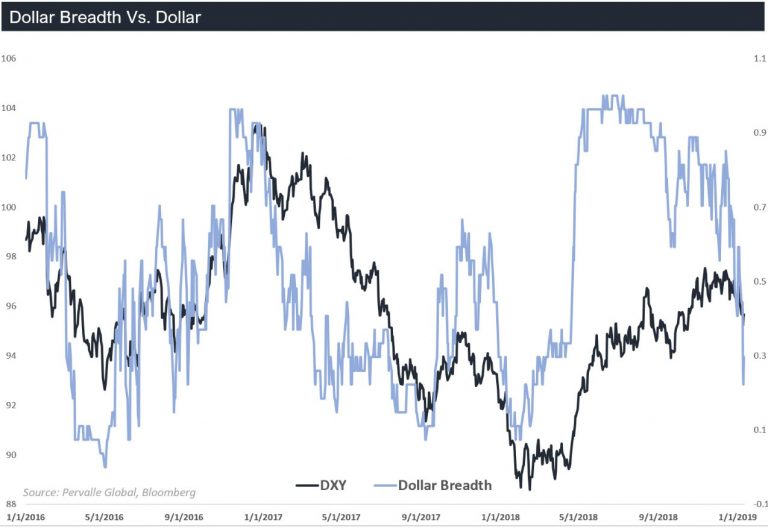
If not, we will likely see the dollar turn lower, which there is technical evidence of as well.
And falling rates won’t help.
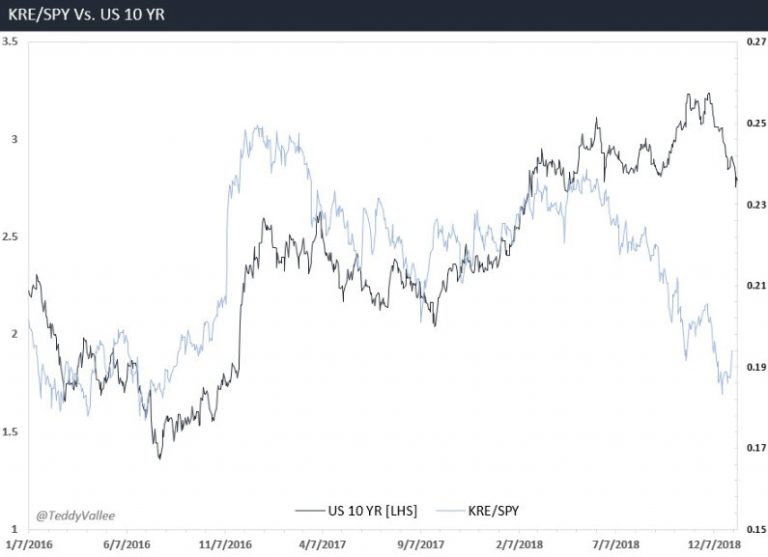
Which will weigh on the S&P, as Fins make up 25% of EPS growth.

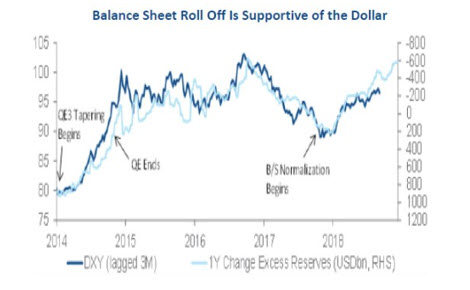
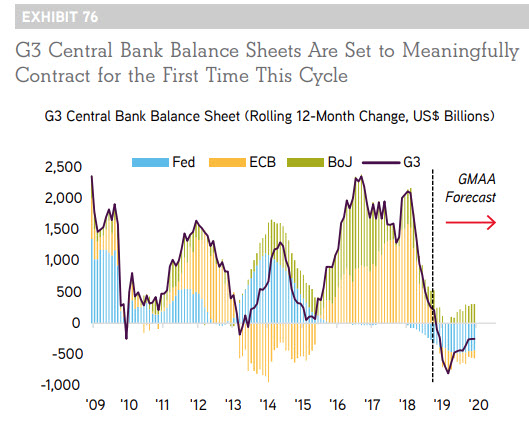
Though if the Fed keeps rolling off the balance sheet, we may see the dollar move higher which will further weigh on earnings.
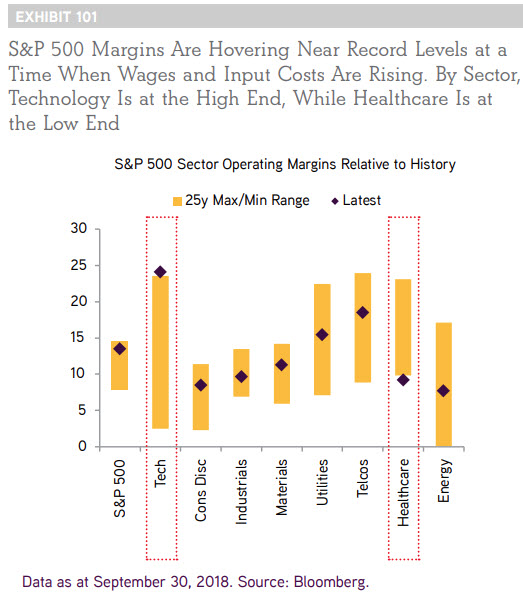
Only tech can save us.
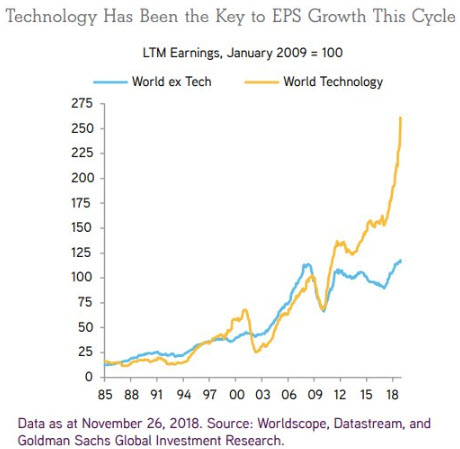
Though not if margins mean revert.
Or maybe the opportunity is in EM.
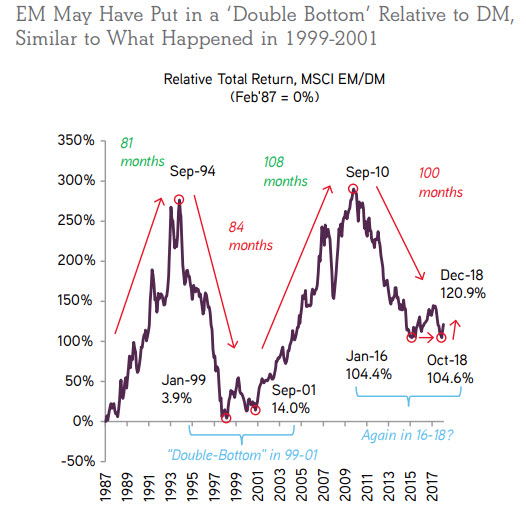
Especially if we can get Central Banks to back off.
Have a good week.
Article by Teddy Vallee, Pervalle

