
Steve Lipper reviews research showing shifts in volatility, style, and cyclicality.
Q3 hedge fund letters, conference, scoops etc
If you’re looking for value stocks, and exclusive access to value-focused hedge fund managers, check out ValueWalk’s exclusive value newsletter, Hidden Value Stocks.
What three research insights caught your attention?
So we recently completed some research into the small-cap market, and it highlighted three things that we think would be interesting for investors as we begin the fourth quarter. Those three things are: volatility, style, and cyclicality, all of which we think are changing. So let’s start with volatility. Many investors will know that recent volatility has been below historic, regardless of how you measure volatility. One way we at Royce find it useful is to consider how many days did the Russell 2000 have a 1% or greater move.
Percentage of Trading Days with Moves of 1% or More in the Russell 2000 through 9/30/18 (%)
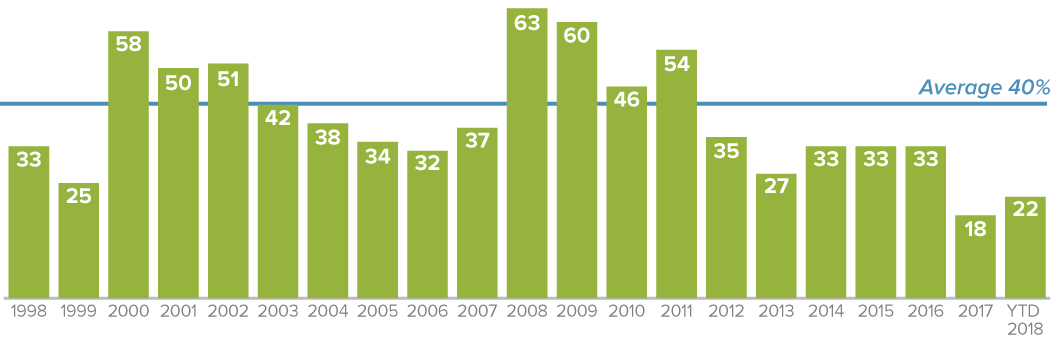
The average percentage does not include YTD data.
If we look over the last 20 years, it’s been actually about 40% of the days that have met that threshold. However, we just looked over the last two years; this year and last year, it’s been about half that; about 20%. Because of that, and for some other reasons, we think that volatility’s likely to increase. Now, we’ve begun to see that already in October, but we think there may be more to come. Why should you care as an investor?
Well, there’s a correlation to active management and small-cap that many investors may not be aware of. So if we look at rolling five-year periods that have low volatility, measured by standard deviation 16% or below, what we find is that active beat passive in those periods only about a quarter of the time.
Percentage Active1 Beat Russell 2000 Within Volatility Levels
Monthly Rolling 5-Year Average Annual Return Periods 12/31/78 through 9/30/18
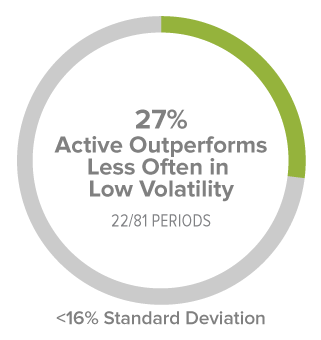
1 “Active” represented by Morningstar’s U.S. Small Blend Fund. There were 539 U.S. Small Blend Funds tracked by Morningstar with at least 5 years of performance history as of 9/30/18.
Standard deviation is a statistical measure within which a fund’s total returns have varied over time. The greater the standard deviation, the greater a fund’s volatility.
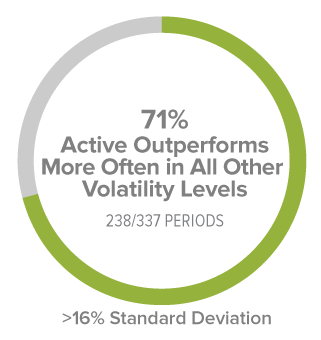
However, if we look at all other volatility regimes; average, above-average, really everything above 16%, what we find is that active has beaten passive over 70% of the time. So if we’re right, and we do see an increase in volatility in the market, it could be a more constructive market for small-cap active managers.
So the second topic that our research has highlighted that we think is particularly interesting now is small-cap growth versus small-cap value. So one of the more powerful forces in investing is reversion to the mean. And it has often been the case that if investors can put their portfolios in a position to benefit from that, that has tended to work out. So how does that play into this? Well, we look at situations where recent returns are either significantly above or significantly below historic returns. And that’s the case with growth versus value today.
Growth’s Latest Returns Much Higher Than History
Latest 5-Year Average Annual Total Returns vs. Average Monthly Rolling Average Annual Total 5-Year Returns through 9/30/18
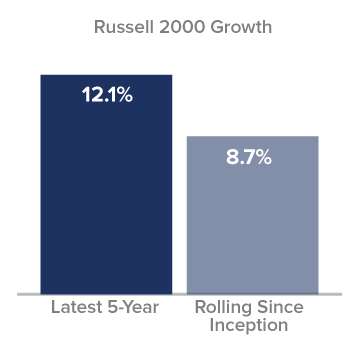
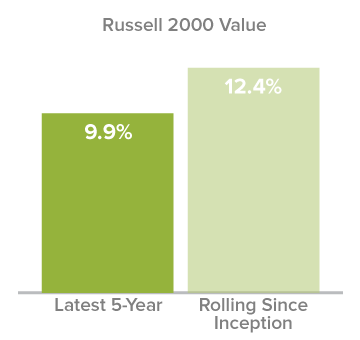
So the recent five-year return on small-cap growth is several percentage points above what the historic five-year has been. That sort of situation makes us a bit uncomfortable. Small-cap value is in the opposite position. A reversion to the mean would benefit small-cap value in that the most recent experience of the five-year trails by several percentage points what the historic is. So we’re putting this all together, the probabilities, and most of our portfolios are seeking to benefit from this reversion to the mean. Small-cap growth may struggle going forward, while small-cap value may have a tailwind.
The third topic that we think is of interest to small-cap investors is cyclicals and their relative attractiveness going forward. Here we think there’s an interesting collection of factors. First let’s start with valuations. Now, cyclical stocks and sectors tend historically to sell at a discount to defensives. They will tend to have more amplitude up and down in their earnings as the economy’s doing better and worse than defensives. But historically that discount is a little over 10%. As of the most recent quarter-end, the discount of cyclicals compared to defensives was about 40%.
Relative Valuations for Cyclicals Look Cheap vs. Defensives
Cyclical vs. Defensive Stocks Within the Russell 2000 Median Relative LTM EV/EBIT¹ Ex. Negative EBIT through 9/30/18
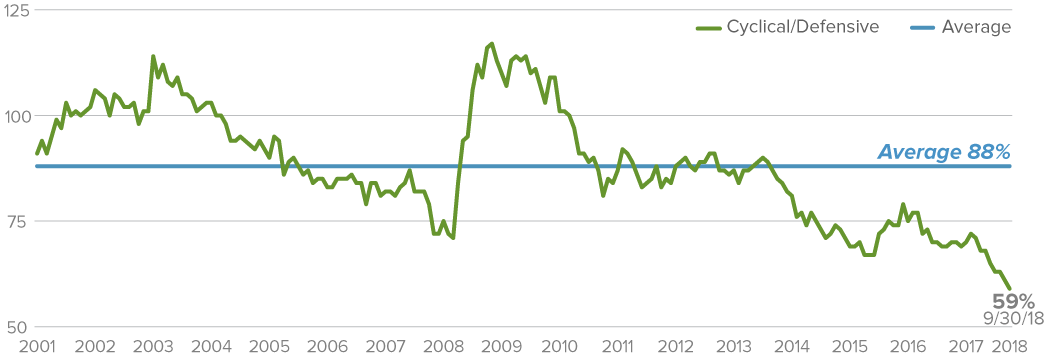
¹ Last Twelve Months Enterprise Value/Earnings Before Interest and Taxes
Source: FactSet
That kind of situation gets us interested. However, when that’s also combined with good fundamentals, we’re even more interested.
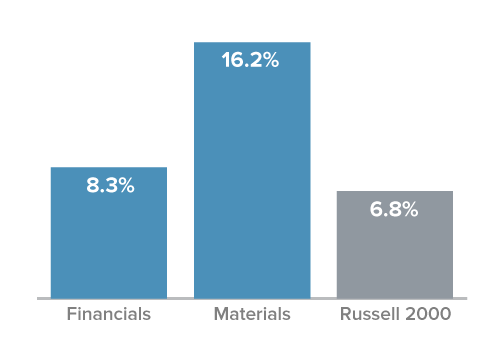
So let’s contrast two of the cyclical sectors, financials and materials, and look at how their profit growth is compared to how their stock prices have done. So we look over the last year, and what we find is that financials and materials have had profit growth which actually has exceeded the overall market, the Russell 2000.
Faster Income Growth
1-Year Trailing Operating Income Growth as of 9/30/18
But if we look at the stock price growth, we see a different picture. Despite faster, profit growth for these two sectors, they’ve actually had lagging stock price growth.
Lagging Stock Price Results
1-Year Return as of 9/30/18
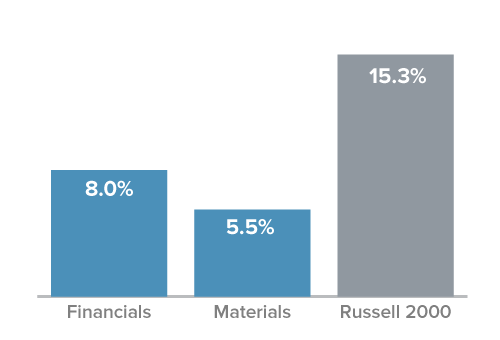
Not only that, is that the operating income growth, the profit growth of these two sectors, has actually been even greater than their stock price growth. So let’s put this all together: we have cyclicals which are selling at a much bigger discount than they have historically, we actually have strong fundamentals, even faster operating income growth than the overall market, and we have stock prices that aren’t showing that. We’re attracted to this area.
Article by The Royce Funds

