
With 28 countries and over €15.8 trillion in 2018 GDP (PPP) to its name, there’s no doubt the European Union (EU) is highly influential in economics and politics. The “superpower” tackles a wide range of issues from climate change and health to external relations, justice, and migration.
Q2 hedge fund letters, conference, scoops etc
Of course, the money required to address these concerns must come from somewhere—and that’s where the EU’s budget comes in. Each member state contributes revenue, but it’s been argued that not everyone is pulling their weight.
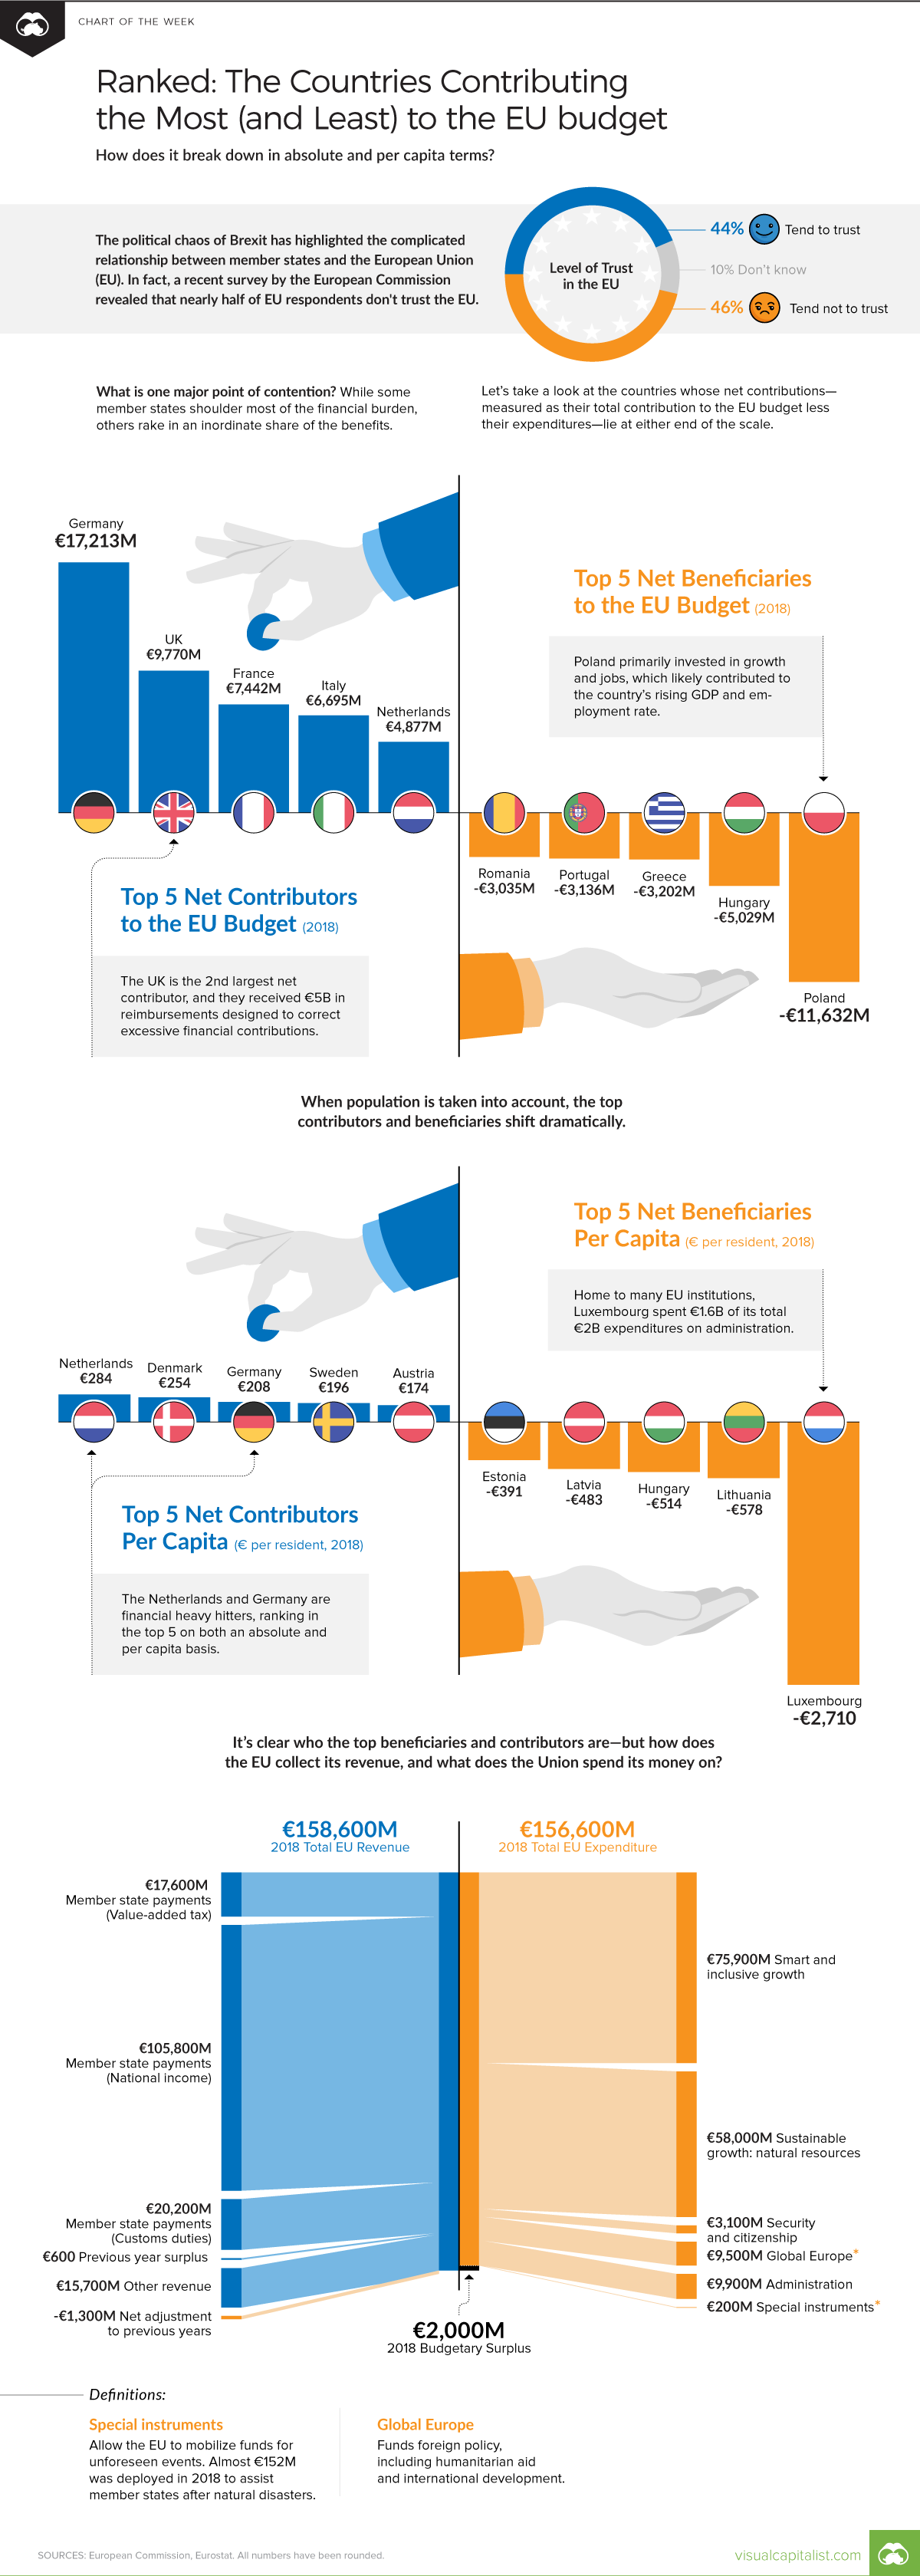
Today’s chart is based on budget data from the European Commission, and ranks the member states who contributed the most, and least, to the 2018 EU budget. Specifically, we’ve charted the net contributions—measured as the country’s total contribution less expenditures—on an absolute and per capita basis. We also break down the EU’s main revenue sources and areas of expenditure for the year.
An Unequal Share
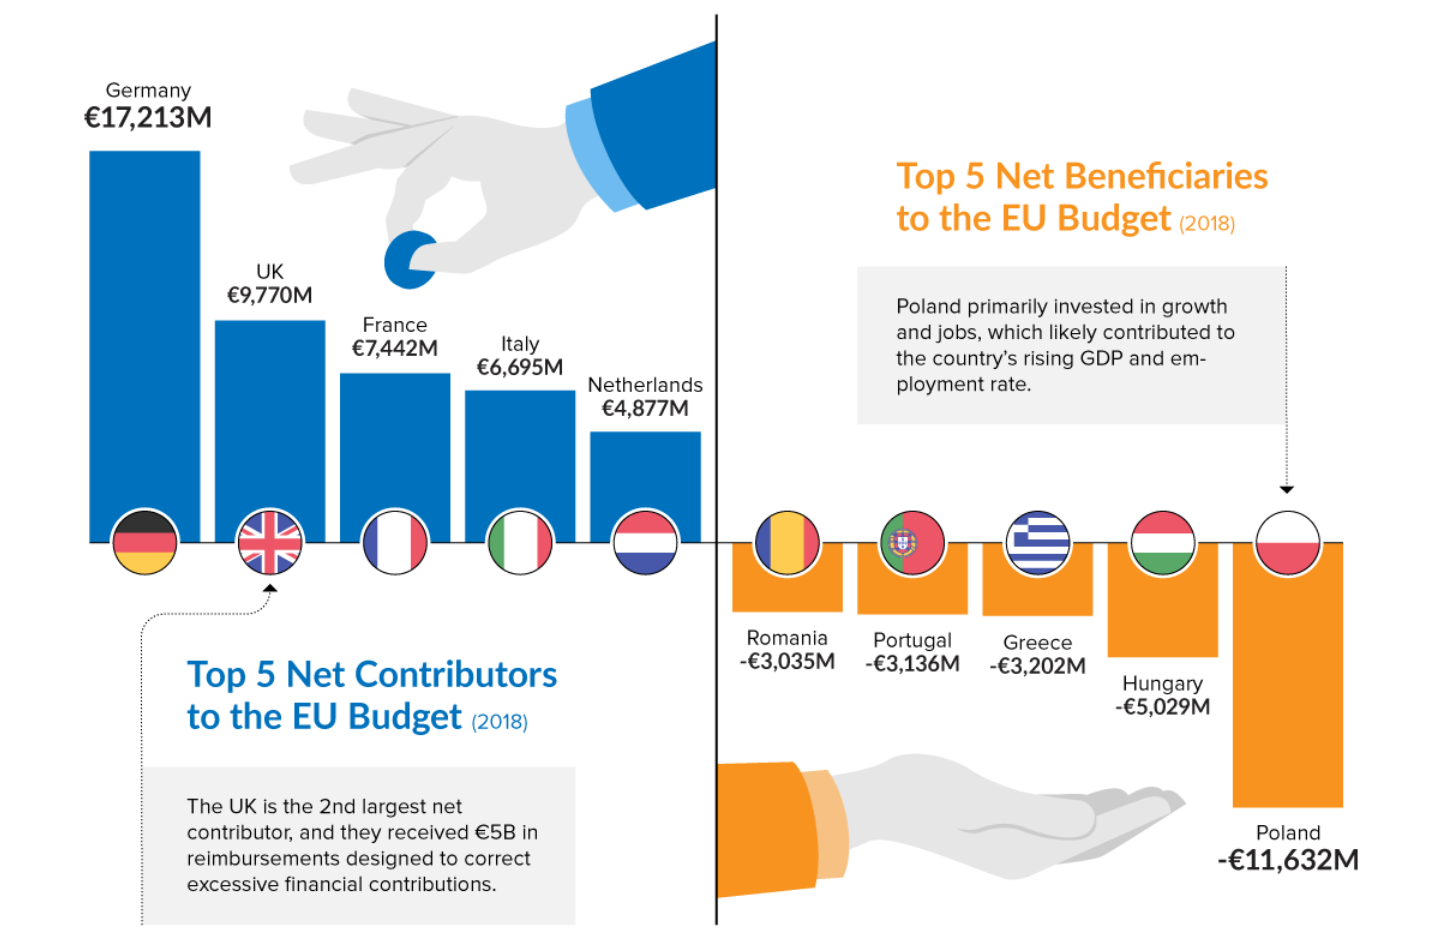
Perhaps not surprisingly, Germany and the UK are the top two net contributors in absolute terms. Combined, these two powerhouses had a GDP (PPP) of over €5 trillion in 2018.
At the other end of the scale, Poland tops the list of net beneficiaries with a deficit of -€11,632 million—more than double that of second-place Hungary. In the wake of the European sovereign debt crisis, Greece and Portugal slide into fourth and fifth place respectively.
When population is taken into account, these rankings shift dramatically. Per capita, the Netherlands tops the list with €284 contributed per resident, whereas Luxembourg lands in last place with a deficit of -€2,710. The small country is home to many EU institutions, resulting in high administrative spending: in 2018, administration amounted to 80% of total expenditures.
Here’s a full ranking of the 28 member states, in both absolute (€M) and per capita (€ per resident) terms:
| Rank | Member State | Absolute net contribution (€M) | Member State | Per capita net contribution (€ per resident) |
| #1 | Germany | €17,213M | Netherlands | €284 |
| #2 | United Kingdom | €9,770M | Denmark | €254 |
| #3 | France | €7,442M | Germany | €208 |
| #4 | Italy | €6,695M | Sweden | €196 |
| #5 | Netherlands | €4,877M | Austria | €174 |
| #6 | Sweden | €1,983M | United Kingdom | €147 |
| #7 | Austria | €1,534M | Finland | €123 |
| #8 | Denmark | €1,468M | Ireland | €112 |
| #9 | Finland | €679M | France | €111 |
| #10 | Ireland | €542M | Italy | €111 |
It’s easy to see what the net beneficiaries might gain from the EU—but what about the top net contributors? Beyond straight budgetary allocations, member states have access to a single open market, and benefit from the political clout of 28 united countries, among other perks.
Following the Money
So, how does the EU collect its revenue, and what does it spend its money on? Revenue is broken down into four main categories:
- Value Added Tax (VAT)-Based Own Resource (2018 total: €17,600M)
Member states pay based on how much they receive in VAT. The VAT “base” is capped at 50% of a country’s Gross National Income (GNI), and a standard levy of 0.3% applies. Germany, the Netherlands and Sweden benefit from a reduced rate of 0.15% in an effort to re-balance their excessive contributions. - Gross National Income (GNI)-Based Own Resource (2018 total: €105,800M)
Calculated as the difference between total expenditure and the sum of all other revenue, this revenue stream is the amount needed to balance the EU budget. The EU applies a standard percentage across member states, with Denmark, the Netherlands, and Sweden receiving a lump sum reduction in 2018. - Traditional Own Resources (2018 total: €20,200M)
Member states collect customs duties and sugar levies, which goes directly towards the EU budget after the country deducts a 20% collection cost. - Other Revenue (2018 total: €15,700M)
This consists of various items including taxes on EU workers’ salaries, interest on late payments and fines, and contributions from non-EU countries to research programs.
Revenue might also include a budget surplus from the previous year, or net adjustments made to previous years’ financials. On the other side of the budget, the EU has a wide variety of expenditures, broken down into six main categories:
- Smart and Inclusive Growth (2018 total: €75,900M)
This category focuses on boosting growth, creating jobs, and fostering economic and social cohesion through training, education, research, and social policy. - Sustainable Growth: Natural Resources (2018 total: €58,000M)
The EU allocates funding for the sustainable growth of agriculture, rural development, and fisheries. It also finances programs dedicated to climate action. - Security and Citizenship (2018 total: €3,100M)
Focused on the safety and rights of its citizens, this budget line item encompasses everything from migration and border protection to food safety and consumer protection. - Global Europe (2018 total: €9,500M)
This covers all foreign policy, including international development and humanitarian aid. - Administration (2018 total: €9,900M)
The expenditures of all EU institutions are captured under this heading, including staff salaries, building rent, information technology and training. - Special Instruments (2018 total: €200M)
This area enables the EU to mobilize funds for unforeseen events, such as natural disasters and major world trade patterns that displace workers.
The 2018 budget resulted in a surplus of two billion Euros, but will it be balanced in future years?
The 2020 Budget and Beyond
The EU’s current budgetary framework ends in 2020. A proposal for the 2021–2027 budget has already been set forth, and council meetings are ongoing.
With Brexit’s twice-postponed deadline looming, the UK’s departure will leave a “sizable gap” in the EU budget. This could leave member states scrambling to find additional revenue sources and ways to reduce expenditures.
Article by Visual Capitalist

