
Introduction
To me, fair value, as it relates to common stock investments, is manifest when the current earnings yield provided by the company’s profits compensates me for the risk I am taking by providing both a realistic and acceptable return on my invested capital. Most importantly, as will be explained later, current earnings yield and its relevance to fair value is independent and/or separate from future growth.
Q2 hedge fund letters, conference, scoops etc
The Importance of Current Earnings Yield
When referencing my definition of fair value, it’s important to focus on the concept “current earnings yield.” There a couple reasons why I feel this is both rational and important. First, the current earnings of a given business are typically accurate within reason (reported earnings). Therefore, the calculation of the return that the current earnings are offering me can be more accurately calculated than if you were using future estimated earnings. To clarify a little farther, after years of extensive research and experience, I have determined (or at least satisfied myself) that a P/E ratio of 15 represents fair valuation for most (but not all) companies based on realistically achievable growth rates.
The 15 P/E Ratio Reflects Fair Value Under Real-World Circumstances
After examining thousands of companies over several decades, through the lens of the FAST Graphs (Fundamentals Analyzer Software Tool), I have observed that a 15 P/E ratio represents historical fair value for earnings growth up to 15% per annum. Although there are exceptions to every rule, it is no accident that a 15 P/E ratio is so ubiquitous. There are logical factors and real-world evidence that support a 15 P/E as a rational fair valuation for most, but not all companies.
First, I believe that it is not a coincidence that the more than 200-year average P/E ratio of the S&P 500 has been between 14 to 16. Second, this is a real-world occurrence because I believe it also represents, and is consistent with, the long-term average return of 6% to 8% that common stocks have traditionally delivered to investors.
This fact is further supported by the reality that a 15 P/E ratio represents an earnings yield (E/P) of 6.67%, or approximately 6% to 7%. My point being, that this is a rational and realistically achievable rate of return commonly found in the real world of stock investing. But I believe the most important point regarding this 15 P/E concept rests on the notion of soundness, not rate of return as I presented in part 1 found here. When the current earnings yield is between 6% and 7%, the investment is currently prudent whether (or not) the business grows, and almost regardless of the company’s rate of growth (up to a point – 15%).
But perhaps most importantly, future earnings growth is uncertain. Consequently, it may or may not come out as forecast. Therefore, it makes more sense to focus more on current time than it does future time. Nevertheless, as presented in part 1, the 15 P/E ratio represents a reasonable assessment of fair value for most companies because this valuation threshold has applied to most companies in the real world. In part 1, I presented 3 examples with different growth rates that clearly illustrated a back test supporting the veracity of the 15 P/E ratio.
Fair Valuation Is A Measurement of Soundness and Prudence
I understand that it would seem logical to assume that a faster growing company would be worth more than a slower growing company. In other words, command a higher P/E ratio. However, that would only be true if the P/E ratio was a determinant of return. As I’ve been pointing out, it is not. Instead it is simply a measurement of soundness. The future growth of the business will be the primary determinant of return assuming the business was purchased at a sound valuation (the 15 P/E ratio or 6 ½ to 7% earnings yield for most companies) in the first place.
Moreover, I will further offer and contend that there is a logical reason why the growth rates on what I am calling the average company are represented with a rather broad range. That range is from 0% earnings growth up to 15% earnings growth. This notion is built on the reality that any future stream of income, whether it grows or not, is worth a reasonable multiple. To be as clear as possible, I am suggesting, based on years of experience, that the fair value multiple will often equate to a P/E of 15 (earnings yield 6%-7%) with regards to publicly traded common stocks, and private businesses for that matter. Therefore, a 15 P/E ratio represents a prudent benchmark of soundness, not a perfect benchmark in all cases, but a rational and sensible valuation level.
The Key: A Win-Win for Both Buyer and Seller
The key to understanding this is to think of it from both the perspective of the buyer and/or a seller. Starting with the seller, it is only rational to sell your business if you can generate enough funds to earn an acceptable return on your proceeds. Allow me to offer the following allegory in order to establish the veracity of this claim.
Let’s assume that you owned a business that was generating you $100,000 per year of net net net income. Furthermore, let’s assume that the $100,000 per year was both fixed and guaranteed. But let’s further assume that it was now time for you to retire and sell your business. The seminal question is, what price would you be willing to accept from me, if I were a potential buyer?
If I offered you $100,000 (P/E = 1), you would (or at least should) without hesitation turn me down because you would know that in one year’s time you would be broke. However, if I offered you $1,500,000 (a P/E of 15) you might consider selling. Since I am attempting to introduce a principal here, we will assume that there are no taxes or costs associated with the transaction. As a result, if you invested the $1,500,000 proceed and received a 6.67% return (the earnings yield from a P/E of 15) your income would be $100,500 per year, or approximately what the business was earning you.
Nevertheless, and, even assuming there were taxes, this transaction might still be rational. Therefore, let’s assume you paid 20% in taxes, brings your proceeds down to $1,200,000. If you invest this money at 6.67% you would be earning $80,040. Although this is less than the $100,000 the business was generating, you had to work to earn it. If you invest the proceeds passively, you no longer need to work in order to get the income, even though it is slightly less. In simple terms, the best transactions represent a win-win for both parties. Moreover, the best transactions are rational for both parties as well. The opportunity for both the seller and the buyer to win is the essence of why a P/E of 15 is both rational, normal and most importantly, sound.
Although the above allegory assumes a business with no growth, it is important that the reader recognize that growth will have an impact on what future return the buyer of the business would earn. However, the principle of soundness is based on the idea that both buyer and seller are receiving an acceptable and realistic return of 6%-7% even with no future growth.
As previously suggested, a key point to consider here is that present time or current valuation is more reliable than future time valuation. In other words, when either a buyer or seller is evaluating a business, they can logically assume that the company’s current earnings are the most reliable earnings with which to make their calculations of fair value upon. The most recent actual reported earnings are a certainty, while there is always significant uncertainty regarding future earnings. Consequently, potential future earnings growth is essentially significantly discounted in favor of actual current earnings. Remember that current valuation is a measurement of soundness and prudence.
Additionally, it should also be recognized that there are significantly different levels of risk in achieving a given level of growth. The higher the expected growth, typically the riskier it would be to achieve it. On the other hand, once again, the soundness of the transaction on the seller’s behalf is somewhat predicated on the notion that one in the hand is worth more than two in the bush. Therefore, the 15 P/E properly compensates both the buyer and seller of the business on a current earnings yield basis, regardless of future growth.
Finally, consideration can also be given to what the buyer might be able to accomplish with the business and what rate of return the seller might be realistically able to invest the proceeds. The new owner of the business might believe they can grow the business faster than the previous owner. Additionally, the seller of the business might believe they can earn more than 6 ½% on the proceeds. For example, if the seller can earn 8.5% on their $1,200,000 after taxes, their income would be $102,000 or slightly more than they were making working hard running the business.
The P/E Ratio – Definitions:
The P/E Ratio can be defined in several ways, with each definition adding insight to its significance. The simplest definition is simply the price of the common stock divided by its earnings per share. This is a basic mathematical definition expressed as follows: PRICE/Earnings = P/E Ratio.
A second commonly used definition is: The P/E Ratio is the price you pay to buy $1.00 worth of a company’s earnings or profits. For example, if a company’s stock has a P/E Ratio of 10, then you must pay $10 for every dollar’s worth of that company’s earnings or profits you buy. If its P/E Ratio is 20, then you pay $20 for every dollar’s worth of that company’s earnings or profits, and so on. Therefore, a given P/E ratio illustrates how expensive a company’s earnings are to purchase. The higher the P/E ratio, the more expensive it is to buy a given company’s profits.
It is important to note, however, that a higher P/E Ratio does not necessarily mean that the company has a higher valuation or that it is more expensive than a company with a lower P/E Ratio. This fact is not understood by many investors and is the key reason that the P/E Ratio has little value by itself or if used in a vacuum. It is theoretically possible, depending on each company’s growth prospects, that a company with a P/E Ratio of 10, for example, can be significantly more expensive than a company with a P/E Ratio of 40. This would occur if the company with a low P/E ratio of 10 was experiencing a permanent impairment of fundamentals in contrast to the company with a P/E ratio of 40 that was growing their business at an extremely high rate.
A third definition would be: How many years in advance you are paying for this year’s earnings. For example, if a company has a P/E Ratio of 20, then you are paying 20 times this year’s earnings. If the P/E Ratio is 10, you are paying 10 times this year’s earnings, and so on. This definition by virtue of adding the element of time illustrates a simple premise of what a prudent investor thinks an operating business is worth.
What We Can Learn from The Price To Interest On Bonds
Utilizing the third definition of the P/E ratio presented above, the price to interest (P/I) of a bond can be evaluated in the same way. However, before we delve too far into this, let’s recognize that although a bond sells at a multiple of interest (P/I) in a similar fashion that a stock sells at a multiple of earnings (P/E), the interest on the bond is fixed. In other words, even though a bond does not grow, it has a value that is a multiple of its coupon.
Therefore, just as you can utilize a P/E ratio in order to determine how expensive a stock is, you can utilize a bond’s price to interest ratio (P/I) in order to determine how expensive a bond is. For example, the current yield on the 10-year treasury bond is approximately 1.6% currently. Therefore, a current treasury bond is selling at 62.5 times interest. As a result, if the rate never changed and you kept renewing your 10-year bond, it would take 62.5 years of bond interest to return your principle.
Consequently, simply applying common sense suggests to me at least that the 10-year treasury bond is currently extremely expensive. This is the same thing as saying that a 10-year treasury bond doesn’t offer very much yield or return. Additionally, this also suggests that a 10-year treasury bond is rather risky today relative to what I can earn by investing in it.
When I compare this to historical norms a very interesting perspective arises. According to several sources, the long-term (whatever that means) average yield of the 10-year treasury bond is 4.56%. This suggests that the average (normal) 10-year treasury bond P/I multiple has been approximately 22. This suggests a quality premium valuation relative to what most would consider the riskier but normal common stock multiple of 15. To be clear, this also suggests a significant difference between an investment being attractive versus an investment being sound or prudent.
When a 15 P/E Ratio Does Not Apply
As I suggested several times throughout this article and in numerous other articles I have posted, the 15 P/E ratio is a rational and normal valuation level for most (but not all) publicly traded companies. Consequently, I believe that investors can utilize it as a cogent benchmark valuation measurement. In other words, when they see P/E ratios above 15, the investor should automatically recognize that most stocks are expensive at those levels. Conversely, when they see P/E ratios below 15 they could logically assume that attractive valuation is present.
However, those recognitions and assumptions should always be qualified with the infamous economic catchall phrase “ceteris paribus.” Here is a simple explanation: “In summary, ceteris paribus is the commonly used Latin phrase meaning ‘all other things remaining constant.’ The concept of ceteris paribus is important in economics because in the real world, it is usually hard to isolate all the different variables that may influence or change the outcome of what you are studying.”
Although in the real world, things are rarely if ever remaining constant it is useful to simplify the concept when considering principles. Moreover, as I’ve often stated, “it is a market of stocks and not a stock market.” Therefore, even though the concept of the average company has some value, the range of what constitutes average can be and is quite broad. This becomes especially relevant when you are attempting to discount future cash flow levels to the present value. The power of compounding coupled with the compression of time as it applies to the time use of money comes into play.
One of the best ways that I have found to comprehend the true power of compounding is by utilizing the rule of 72. Simply stated, if you divide any growth rate into the number 72 it will tell you with uncanny accuracy how many years it would take to double your money at that growth rate. For example, if you divide 72 by 5% growth it would take 14.4 years to double your money. If you divide 72 by 9% growth it would take 8 years to double your money and so on. On the other hand, if you divide 72 by a much higher growth rate of 20% it only takes 3.6 years to double your money. At 30% growth, it would only take 2.4 years to double your money and so on.
However, as investors we must also recognize and consider that we have a rather finite time period with which to invest our money. We usually won’t start investing until were of working age, let’s say in our mid-to-late 20s, and most people usually don’t work too much beyond their 60s or 70s. Therefore, it’s reasonably safe to assume that we have approximately 40 to 50 years of investing time. How many times we might be practically capable of doubling our money over our working lifetime is extremely relevant to how compounding impacts investments.
From the above it should be clear that average growth rates take relatively long periods of time to double money. In contrast, very high growth rates compress time and double money very quickly. Consequently, the geometry of more doubles and higher growth rates is extremely relevant to understanding fair value P/E multiples of average or low growth stocks versus appropriate fair value P/E ratios of very fast-growing stocks. Conceptually, this is all about geometry rather than arithmetic.
Stated more directly, extremely higher growth rates (significantly above average) will produce significantly higher future streams of income. Since all companies (all investments for that matter) derive their value from the amount of cash flows they generate for their stakeholders, a much larger cash flow stream is more valuable than a smaller cash flow stream. However, this value occurs in future time, not present time. I offer the following illustration to put these concepts into focus:
First, I will assume that the average person has a working lifespan of 36 years. In modern times this may be a conservative assumption, but as I will soon illustrate, it facilitates the math. Next, I will assume two different compound rates of earnings growth as they apply to the average dividend growth stock, and then to the pure growth stock. For the dividend growth stock, I will assume a generous and above- average rate of earnings growth of 10% per annum. For the pure growth stock, I will assume the appropriately higher rate of earnings growth of 20% per annum. The math then looks like this:
With the dividend growth stock, If I divide 10% into 72, I calculate that it will take 7.2 years to double my earnings (72/10% = 7.2 years).
With the pure growth stock, if I divide 20% into 72, I calculate it will take only 3.6 years to double my earnings (72/20%=3.6 years). In other words, earnings will double in half the time.
If I apply this math to my assumed average working life of 36 years, I get the following results:
If my earnings double every 7.2 years at a 10% rate of growth, I will get 5 doubles in 36 years (36/7.2=5).
If my earnings double every 3.6 years at a 20% rate of earnings growth, I will get 10 doubles in 36 years (36/3.6=10).
The net effect is that by doubling my average rate of earnings growth from 10% to 20% per annum, I do not generate two times the earnings by growing at twice the rate. Instead, I get double the doubles. Looked at from the perspective of the first $1 (dollar) of earnings, the power of compounding (compressing time) becomes vividly clear.
Doubling my first dollars’ worth of earnings 5 times at the 10% growth rate results in the following: $1 doubles 5 times to $2, $4, $8, $16, and finally to $32. However, at the 20% growth rate I get 5 additional doubles over the same 36 year timeframe as follows: $64, $128, $256, $512, $1024.
To put this into perspective, over my assumed 36-year working lifetime I generate 32 times more earnings or cash flows by growing at 20% than I would have if my earnings grew at 10% (1024/32=32). Doubling the number of doubles over the same timeframe shows the incredible power of compounding that true growth stocks are capable of offering.
However, it should be noted that successfully growing earnings at the rate of 20% or higher per annum over a working lifetime is a rare and difficult feat. Eventually the law of large numbers comes into play and a company’s earnings growth rate will surely slow down as a result. Nevertheless, the above exercise is valuable for the insights it provides into the power of compounding.
As a result, when you are dealing with very fast earnings growth of 15% or better, a fair valuation reference that is widely utilized is Peter Lynch’s famed fair value is when P/E ratio is equal to earnings growth rate (P/E = EPS growth rate). Therefore, a 20% grower would command a P/E ratio of 20, 30% grower a P/E ratio of 30 and so on. However, for any growth rates lower than that, a 15 P/E ratio becomes a rational standard or benchmark for all the reasons described above.
Examples of Applying Fair Valuation Reference Lines Based on Earnings Growth
What follows below are just a few examples of how fair valuation of a common stock can be calculated based on each company’s ability to grow. Most importantly, these examples are designed to illustrate that fair valuation is a measure of soundness and not a driver of future rates of return. The primary drivers of future return will be the growth of a company’s income streams – earnings, cash flows and dividends, etc.
The idea of possessing a clear understanding of fair valuation empowers investors to make more prudent decisions in the long run. Over the short run, the stock market is liable to do anything and/or behave in often irrational and illogical ways. However, when an investor is grounded in the principles of valuation, they can protect themselves from participating in folly or in making risky long-term bets with their capital.
Furthermore, I will also provide a few examples below that are exceptions to the rule. In the video that follows these pictures, I will describe how I personally think about and navigate exceptions when they occur.
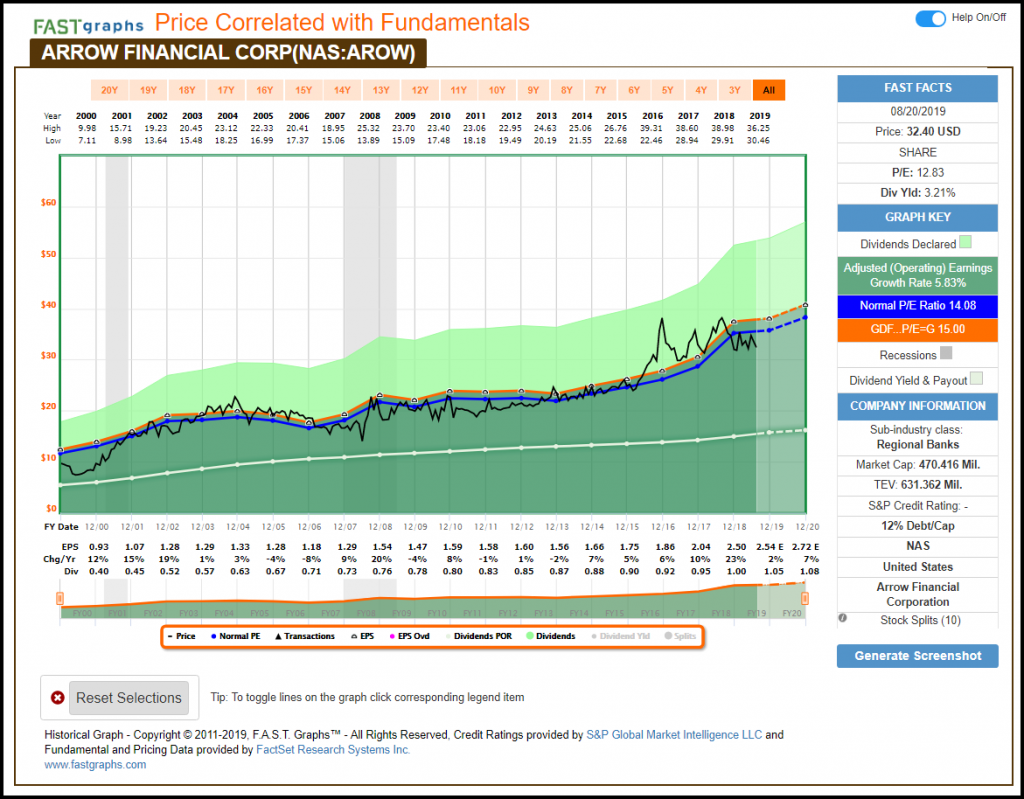
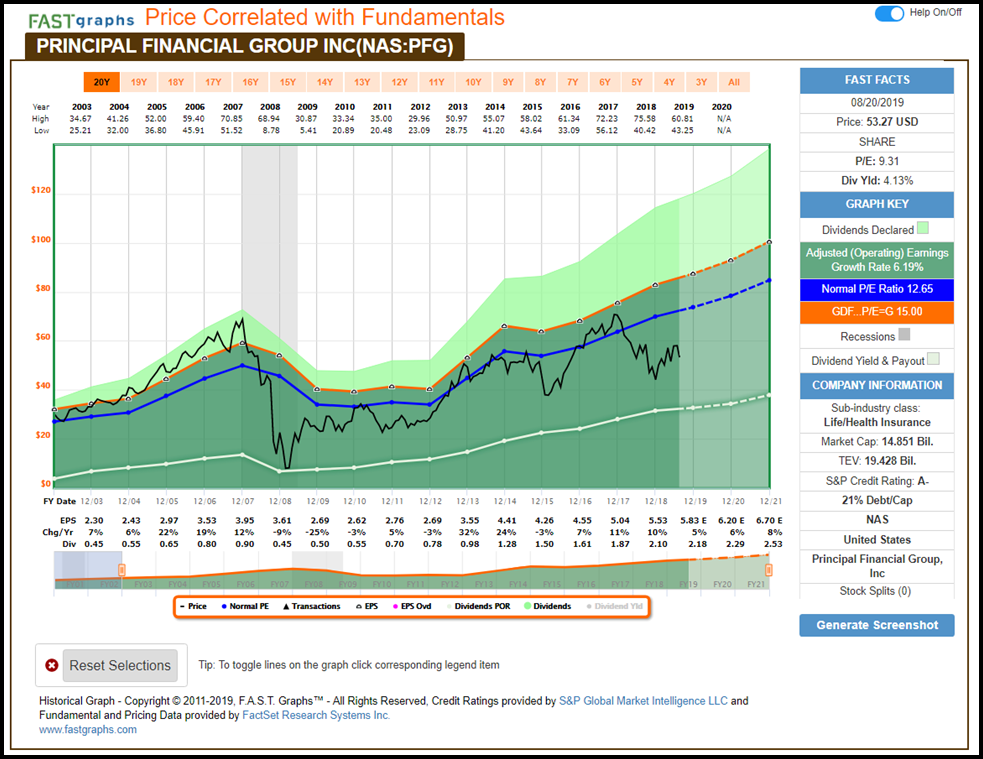
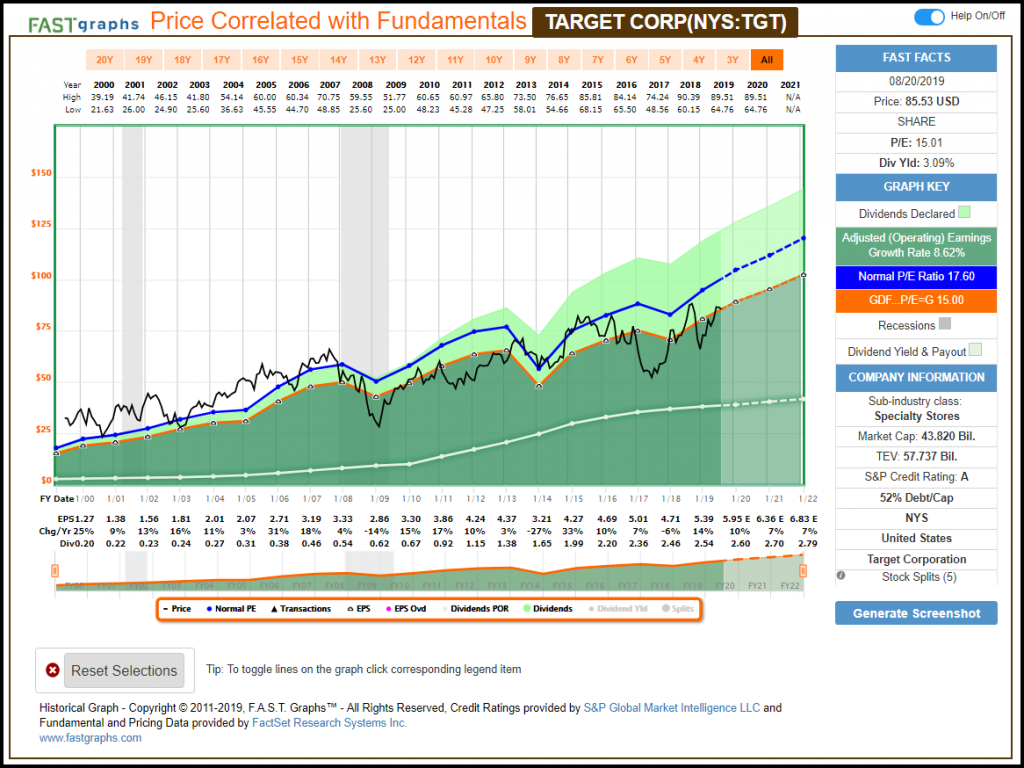
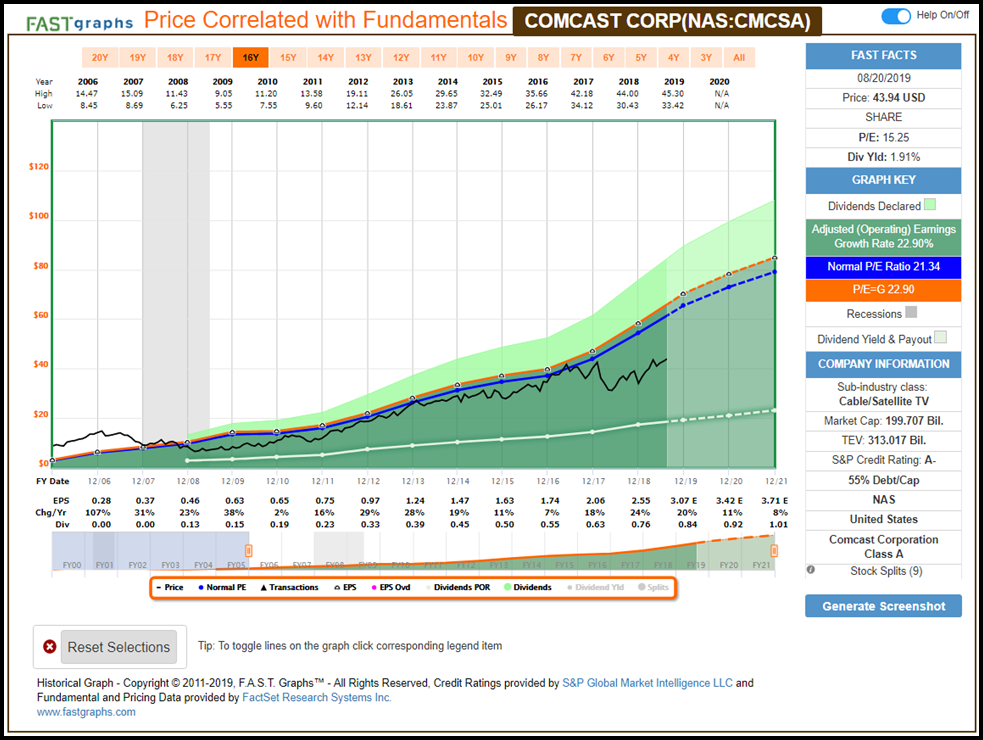
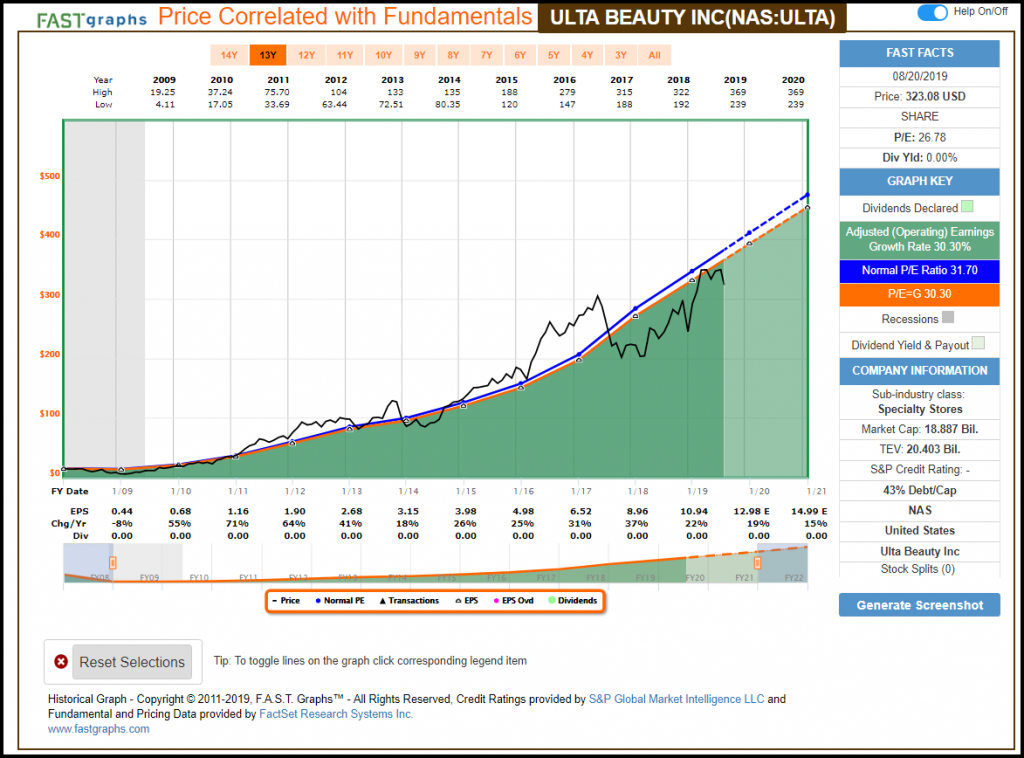
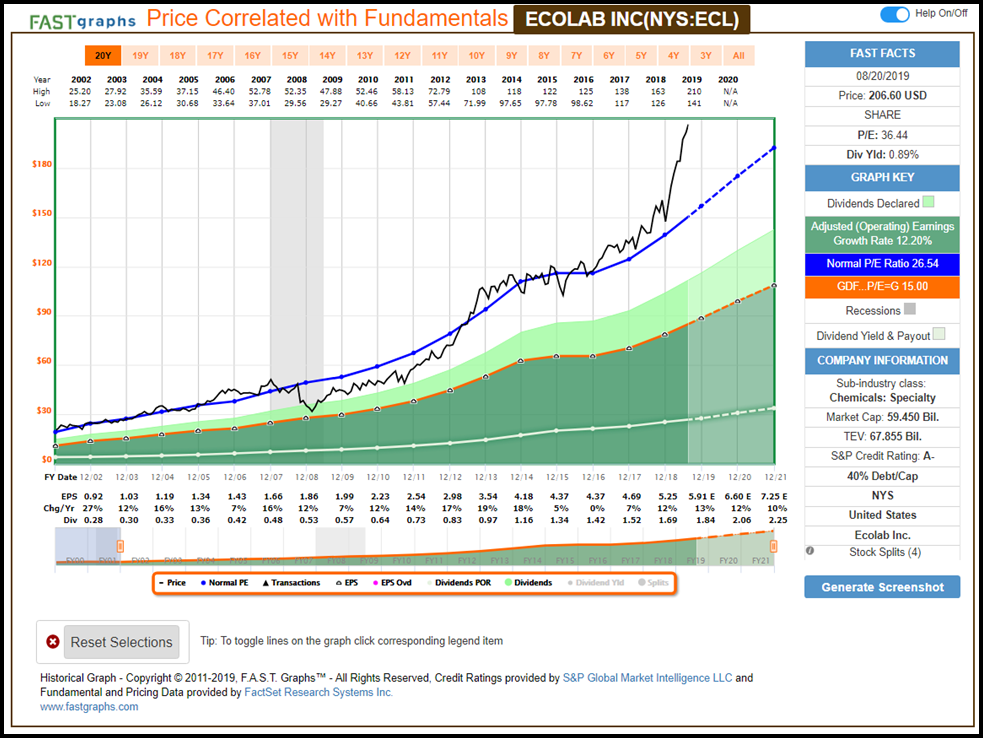
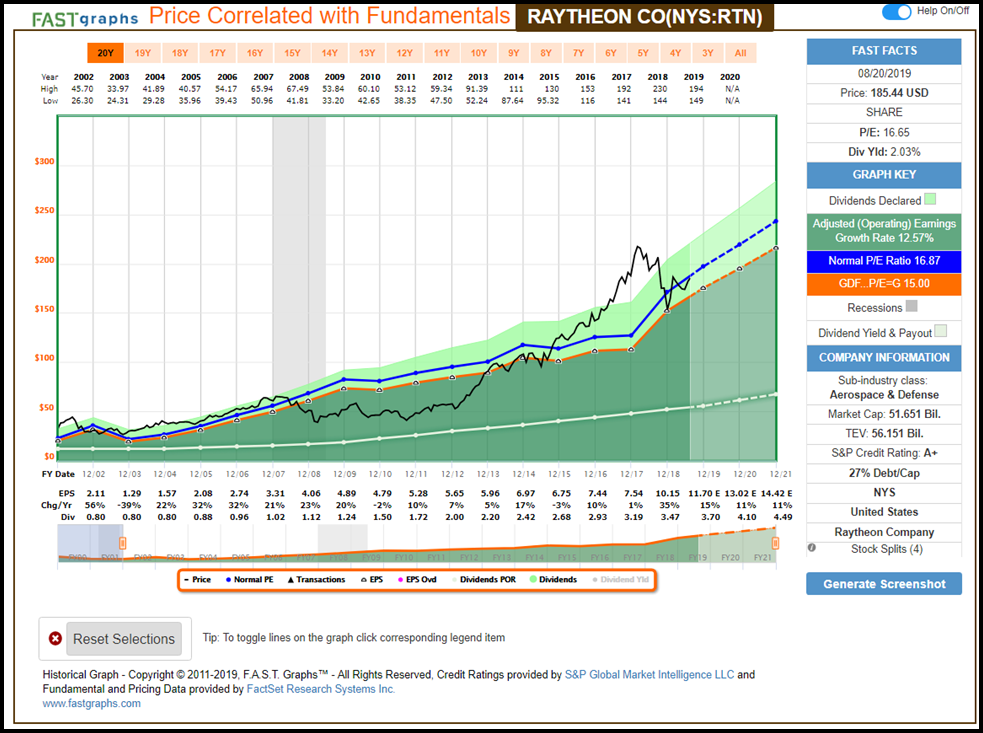
When reviewing the following screenshots, I ask that you pay close attention to a couple of important attributes. First start your review by checking the dark green color-coded rectangle to the right of each graph that shows the company’s earnings growth rate over the timeframe being shown. Next, check the orange rectangle and note the P/E ratio that is being applied and the widely accepted formula for valuing a business that is utilized. Then, as you review each company, focus on how the stock price (the black line) has correlated to and followed the orange earnings justified valuation reference line. Finally, note how these valuation reference lines have actually provided fair valuation insights historically in the real world.
Arrow Financial Corp (AROW): Average Growth Fair Value P/E ratio of 15
Principal Financial Group (PFG): Average Growth Fair Value P/E ratio of 15 vs Normal P/E ratio of 12.65
Target Corp (TGT): Above Average Growth Fair Value P/E Ratio Of 15
Comcast Corp (CMCSA): High Growth Fair Value P/E Ratio Equal To The Company’s Growth Rate
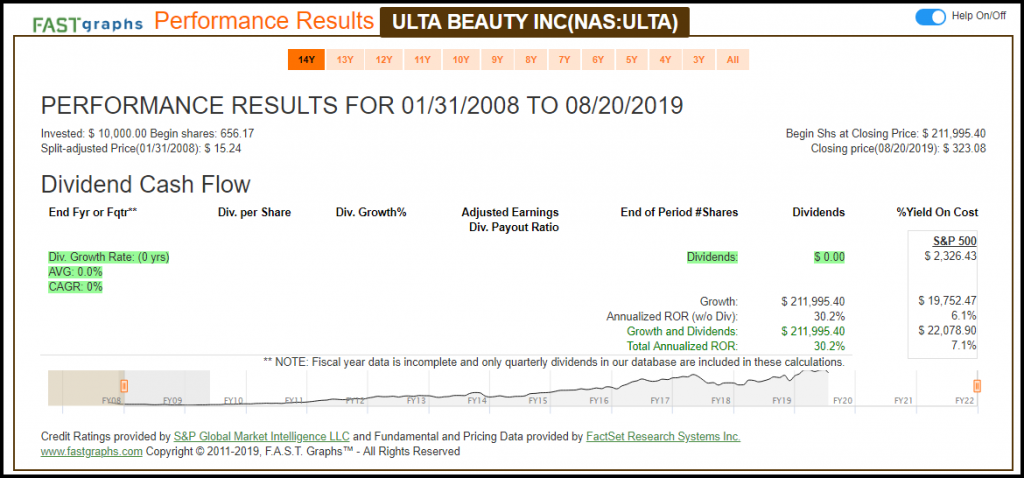
Ulta Beauty Inc (ULTA): Very Fast Growth Fair Value P/E Ratio Equals Growth Rate
Ecolab Inc (ECL): The Exception to the Rule versus Raytheon Co (RTN)
FAST Graphs Analyze Out Loud Video: Fair Valuation P/E Ratios for Average vs High-Growth
In the following analyze out loud video I will illustrate how sensible valuation references apply in the real world with low growth, moderate growth and then high-growth companies.
Summary and Conclusions
When I am suggesting that a fair value P/E ratio of 15 applies for most stocks, I am not simultaneously suggesting that it is an absolute or perfectly precise valuation measurement. Instead, I am suggesting that it is a prudent and rational valuation reference or benchmark that investors can utilize and think about in order to assist them in making rational decisions when investing in common stocks. For most companies, when the P/E ratio is above 15, the investor should automatically recognize that the stock is getting expensive. In contrast, when the P/E ratio is below 15, the prudent investor might suspect that there is a bargain or attractive opportunity at hand. However, this is only a starting point and not the final answer. On the other hand, a 15 P/E ratio provides an extremely rational and relevant shortcut that investors can utilize to screen for and evaluate investment opportunities in most common stocks.
In contrast, when investors are evaluating extremely fast-growing companies, a good rule of thumb benchmark is to apply a fair value reference that is equal to the company’s expected growth rate. Historically, as I illustrated above, there is a preponderance of evidence that suggests that stock prices will gravitate to a valuation level that equates with the company’s growth production (P/E =G).
In closing, as it is with all rules, there are always exceptions. However, the value of utilizing intelligent valuation references as described in this article lies in their ability to help you make investment decisions more efficiently and prudently. Investing is not a game of perfect. However, as Warren Buffett so profoundly put it: “It is better to be approximately right than precisely wrong.” So don’t get hung up worrying about whether a 15 P/E ratio makes sense or not. Instead, embrace the idea that it is an approximate and relevant benchmark that can be utilized to make your investing decisions both better and easier.
Disclosure: Long TGT
Disclaimer: The opinions in this document are for informational and educational purposes only and should not be construed as a recommendation to buy or sell the stocks mentioned or to solicit transactions or clients. Past performance of the companies discussed may not continue and the companies may not achieve the earnings growth as predicted. The information in this document is believed to be accurate, but under no circumstances should a person act upon the information contained within. We do not recommend that anyone act upon any investment information without first consulting an investment advisor as to the suitability of such investments for his specific situation.
Article by F.A.S.T. Graphs

