
Those that follow my personal account on Twitter will be familiar with my weekly S&P 500 #ChartStorm in which I pick out 10 charts on the S&P 500 to tweet. Typically I’ll pick a couple of themes and hammer them home with the charts, but sometimes it’s just a selection of charts that will add to your perspective and help inform your own view – whether its bearish, bullish, or something else!
The purpose of this note is to add some extra context beyond the 140 characters of Twitter. It’s worth noting that the aim of the #ChartStorm isn’t necessarily to arrive at a certain view but to highlight charts and themes worth paying attention to.
So here’s the another S&P 500 #ChartStorm write-up!
1. 200-day Moving Average Breadth: First up is a look at market breadth for the S&P500 (proportion of S&P500 constituents trading above their 200 day moving averages). There’s a few things to note with this one, first is how basically half of the S&P500 are trading below their 200-day moving average (a rough mechanical rule of thumb as to whether a market is in an uptrend or downtrend). Second is the point that it didn’t really recover with the brief rally into June. Third is the bearish divergence – the rally into June took the market back to the March rebound level, but the recovery in breadth was much more muted. Basically this is all typically a reflection that there is underlying weakness in the market right now.
Bottom line: The soft breadth numbers indicate underlying weakness in the market.

2. Global Equities – 200-day Moving Average Breadth: Staying with the topic of market breadth, but this time looking at a global perspective, and in this case looking at countries rather than stocks (i.e. the main benchmark of the 70 countries we monitor), the view is much worse. Global equity market breadth has completely broken down. So going on the same reasoning of the previous comments – there seems to be underlying issues for a majority of countries (and as I show in the next charts, EM is a big part of this). In terms of the historical signals that this indicator has generated, it normally does collapse leading into a major global equity correction, but the other thing to note is that it often indicates oversold conditions when it gets to these levels. As history shows us though, oversold markets can get even more oversold.
Bottom line: Global equity 200-day moving average breadth has broken down.
3. S&P500 vs Emerging Markets and Credit: This next chart in my opinion shows how Fed quantitative tightening and the resurgent US dollar are having a severe negative impact on financial conditions globally, and particularly for emerging markets. The price action of the last week suggests the potential for the developing stress in emerging markets to spillover to the S&P500. This is a key risk for global markets.
Bottom line: Emerging stress in emerging markets may spillover to the S&P500.
4. S&P500 vs Financial Conditions Index: Here’s another angle on financial conditions from Jurrien Timmer of Fidelity Investments. It shows the S&P500 against the US financial conditions index, and as with the previous chart, there is a clear divergence. Unless we see some form of easing of financial conditions, the risk is that the S&P500 is the one to move and close the gap. Basically if this gap persists or if financial conditions tighten further then from a short term risk management perspective the market is basically just waiting for an excuse/catalyst to selloff further.
Bottom line: The tightening of financial conditions presents downside risks to the S&P500.
5. Volatility Seasonality: This chart seems to fit quite well with the bearish tone of the previous charts as it shows the seasonality of volatility and it’s worth paying attention to the July period. The chart is by Goldman Sachs – shared by Pat Hennessy – and basically their analysis shows that from a historical seasonal perspective July has been the best time to buy volatility. So with the poor breadth backdrop, tightening financial conditions, and EM stress, maybe there’s still more water to go under the bridge on the current VIX spike. Of course it is important to mention that the chart shows the average, and the average can deceive with outliers and exceptions liable to disappoint those who rely solely on historical average patterns.
Bottom line: Historically July has been a good time to buy volatility (on average).
6. Smart Money Index vs Fed Balance Sheet: The chart shows the Bloomberg Smart Money Index vs the Fed balance sheet, and comes from “Things That Make You Go Hmm” (shared by Tony Sagami). The SMI (Smart Money Index) tracks the implied buying/selling of so-called “smart money” by tracking the difference between price action at the opening and last hour of trading – the logic is that smart money does all their trading at the end of the day. The drop in this index implies that smart money has been selling, and it’s interesting then to see that the index has dropped along with the drop in the Fed’s balance sheet (quantitative tightening). This again speaks to the idea of tightening financial conditions negatively impacting on the market (and this makes sense, if you think that quantitative easing was supportive for stocks).
Bottom line: The drop in the SMI alongside Fed QT reflects the impact of tightening monetary policy.
7. S&P500 vs Global Central Bank Balance Sheets: Again, using a slightly different chart to provide a further insight on the same issue, this one shows the S&P500 against the combined US dollar value of the balance sheets of the Fed, Bank of Japan, European Central Bank, and People’s Bank of China. The chart is from Chris Carolan of Spiral Calendar. It’s important to note that because these are expressed in US dollar terms any changes in the US dollar will impact on the number… while this may mislead as to the true level or change in global central bank balance sheets, from a signal standpoint it is good because it also captures the impact of the US dollar (the thinking here is this: the best case scenario for global financial conditions would be expanding central bank balance sheets and a falling US dollar and vis versa). With the resurgent US dollar and quantitative tightening by the Fed, the US is the one doing most of the work to push this number down, and as it heads down the downside risks for the market will rise – one to keep an eye on.
Bottom line: The downward movement in global central bank balance sheets presents downside risks to the market.
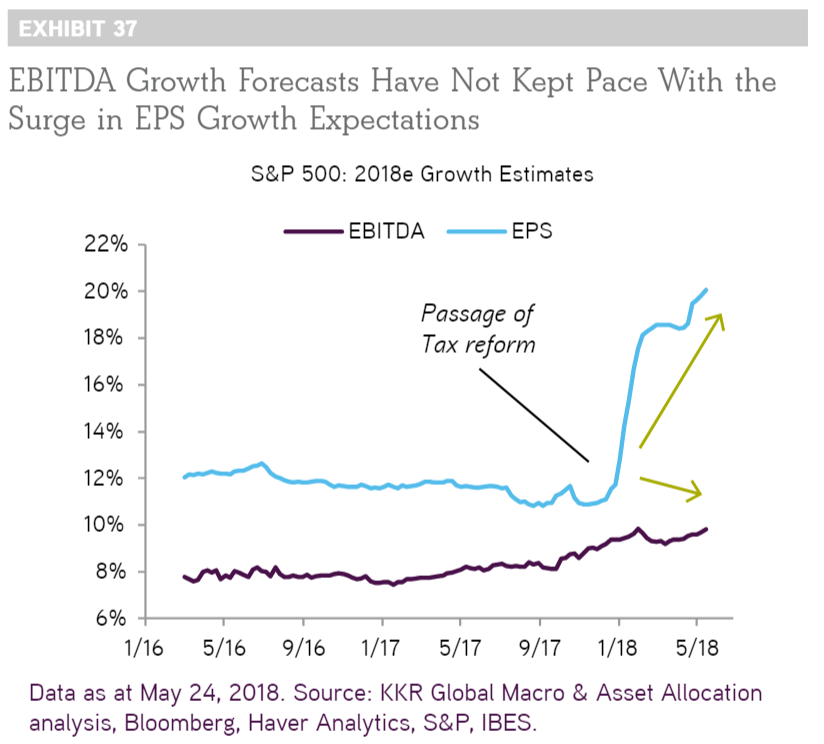
8. S&P500 EPS vs EBITDA: The next chart comes from the KKR Global Institute’s 2018 mid-year outlook report. It shows a divergent path between consensus estimates for EPS (Earnings Per Share) vs EBITDA (Earnings Before Interest, Tax, Depreciation, and Amortization). The simplest explanation for the difference between expected EPS and EBITDA is the impact of the tax cuts (obviously the tax cuts are going to have a disproportionate and direct impact vs more indirect impact on post-tax vs pre-tax earnings numbers… it’s just maths). This is not to dismiss the impact of the tax cuts, but it certainly puts it into perspective.
Bottom line: The impact of the tax cuts can be seen with the divergence in expected EPS vs EBITDA.
9. Aggregate Stockmarket Leverage: Since we’re talking about financial conditions and balance sheets, this next chart is particularly topical, it shows aggregate stockmarket leverage (leveraged bets in margin accounts, ETFs, and futures) standardized against the S&P500 market capitalization. I noted earlier this week that the absolute value is at an all time high – close to $400 billion, but even against market cap it’s the highest percentage on record. The glass half full version is that this represents confidence in the outlook, the glass half empty view is that it represents OVER-confidence in the outlook and potential selling fuel if these traders are forced to quickly liquidate their leveraged positions. This type of indicator is similar to valuations – it doesn’t matter until it does.
Bottom line: Leveraged bets on the stock market are at an all time high.
10. Small Caps vs Large Caps PE10 Valuation: Speaking of valuation, we wrap this week up with a look at the PE10 valuation (price divided by trailing 10 year average earnings) for the S&P600 (small caps) and the S&P100 (large caps). The key point is that US small caps are trading at the most expensive levels on record, and significantly higher vs large caps. I talked about the various adjustments you can make to the small cap PE10 to make it look cheaper in my latest weekly report, but the bottom line is that it’s still just plain expensive – and for those investors who just buy the index, those adjustments don’t really matter. The other thing worth noting is that even large caps by themselves are certainly not cheap. So again, as with the previous chart – high valuations don’t matter until they do…
Bottom line: US small caps are the most expensive on record, and particularly so vs large caps.
So where does all this leave us?
This week there are 3 key themes
1. Market Weak Spots
The market breadth chart for the S&P500 showed there is still some underlying weakness in the market, and likewise the global equity market breadth showed a veritable breakdown in breadth. The chart of the S&P500 against EM equities, EM bonds, and IG credit showed a couple of particular weak spots.
2. Tightening Financial Conditions
Speaking of that EM chart – it basically represents a tightening of financial conditions as a result of QT and the stronger dollar. The US financial conditions index also showed tightening for the US itself, and the SMI vs Fed chart and S&P500 vs global central bank balance sheet provided different angles on this same issue.
3. Background Features
The last 3 charts could be described as background features – the EPS vs EBITDA chart showed the impact of the tax cuts, while the stockmarket leverage and small cap valuation charts could easily be interpreted as bearish… but it could still take time before these features “matter” for markets.
Summary
Similar to last week, the overall tone of the charts is again characterized by a bearish hue. With tighter financial conditions, soft market breadth, and emerging stress in EM, it feels like the market is just looking for a catalyst (or an excuse) to selloff further. In reflecting, it does seem like we have gotten through the correction fairly lightly so far – particularly relative to the 2015/16 twin corrections. With background features of lofty leverage and expensive small cap valuations, it may well be that all it takes for a deeper correction from here is a wayward tweet or an unfortunate piece of (non-fake) news to trigger things off. But maybe I just woke up out of the wrong side of bed this week!
See also: Weekly S&P500 #ChartStorm – 24 June 2018

