
Mergermarket has released its Global M&A roundup for 1Q21, including its financial advisors league tables.
Q1 2021 hedge fund letters, conferences and more
A couple key findings include:
- Globally, first quarter activity in 2021 reached USD 1.16tn in transactions, surpassing even red-hot 2018 and 2019, making 2021 the most active annual opening on record and one of the highest ever. Large deal values but fewer deals have led to the highest average deal value since 2006 of USD 518.7m (based on 2,243 deals with disclosed deal values).
- Cross-border deals were a significant contributor to overall activity, hitting a record of USD 516.6bn for first quarter activity and nearly returning to historical averages of more than 44.4% of total deal value.
- North America, dominated by the US, reached its highest market share in 14 years netting 54.4% of global deal value, up from 48% in 4Q20. It is a marked turnaround from 2Q20 when North America plunged to 21.5%. North America’s gain came at the expense of all other regions. Save the Middle East, all other global regions lost market share.
- The US was also home to more than two-thirds (USD 137.8bn) of the USD 200.9bn in global IPOs in 1Q21, according to sister product Dealogic. There were 398 IPOs in the US compared to 762 worldwide. Overall, global IPO activity in 1Q21 reached nearly two-thirds of the value of all 2020 activity (USD 319.5bn on 1,592 IPOS).
- SPACs played a large part in the overall increase in IPO activity and, particularly, in the US. Year-to-date, more than USD 97bn has been raised by 304 SPACs globally, the figures showed.
- US M&A activity remained strong in 1Q21, breaking record 4Q20. There were at least 1,595 deals worth USD 563bn recorded in 1Q21, up slightly by value compared to the previous quarter (1,708 deals worth USD 554bn in 4Q20). For the second quarter in a row, US M&A activity by value was the highest quarterly level recorded on Mergermarket record (since 2001).
Please let me know if you’re interested in speaking to a Mergermarket expert. I can have someone speak to you at your convenience about 2021 so far and additional insights you might need.
- Global & Regional M&A Report 1Q21: Including League Tables of Financial Advisors
- Global Overview: Regional M&A Comparison
- International dealmaking shows strength.
- North America back with a vengeance.
- SPAC space surges.
- Large deals increase even as mega deals decline.
- Private equity flexes muscles.
- Technology dominates, but Transport biggest winner.
- Top Deals
Global & Regional M&A Report 1Q21: Including League Tables of Financial Advisors
Global Overview: Regional M&A Comparison
Carrying forward the momentum of 4Q20, global mergers and acquisitions activity turned in a strong first quarter performance. While many themes crossed over into 2021, such as the technology sector’s dominance and the continued strength of private equity, some notable shifts did occur in terms of deal size and geographic concentration of deals.
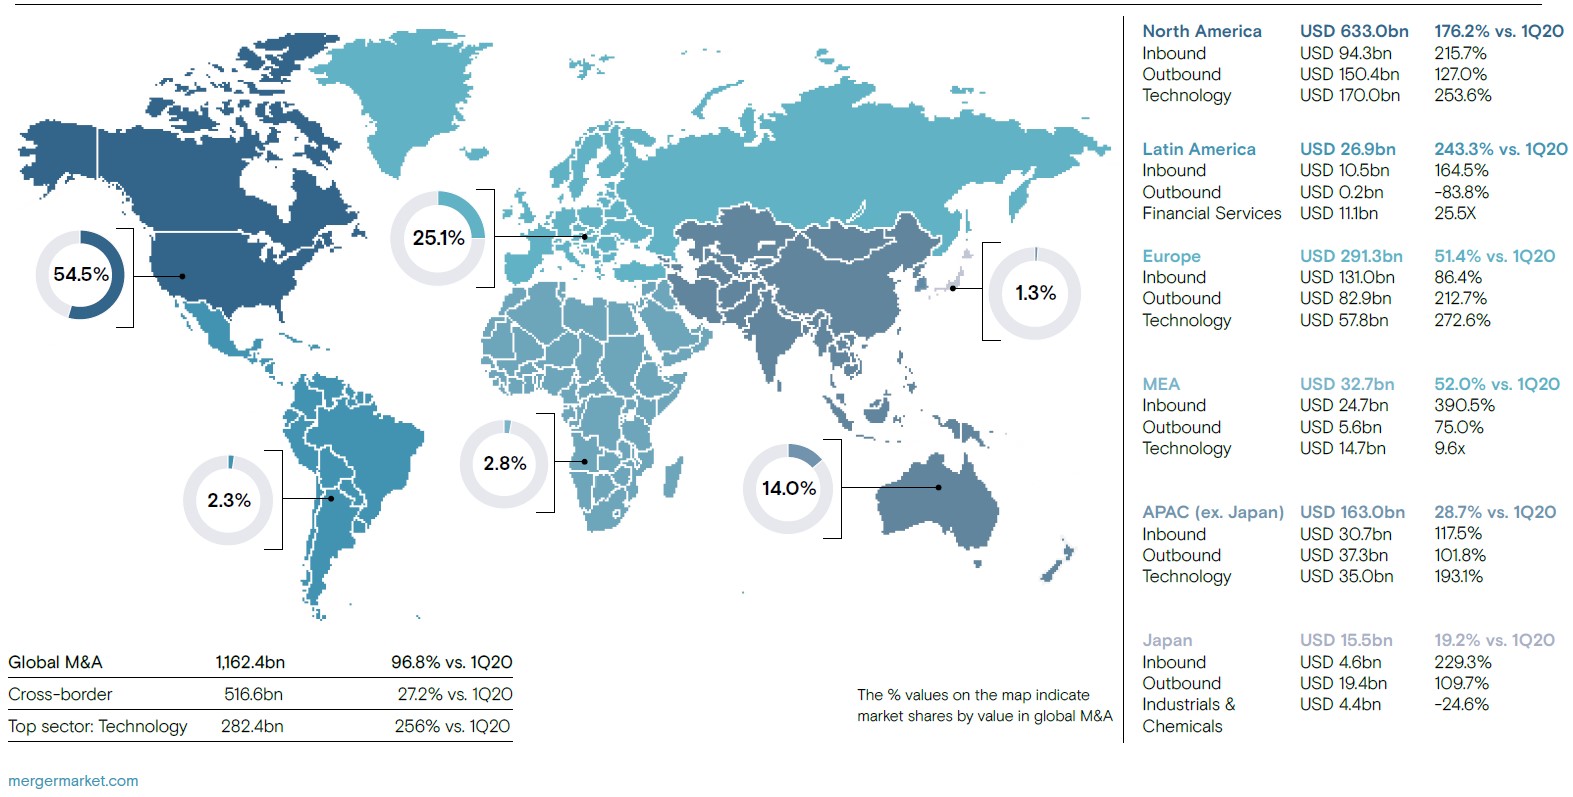
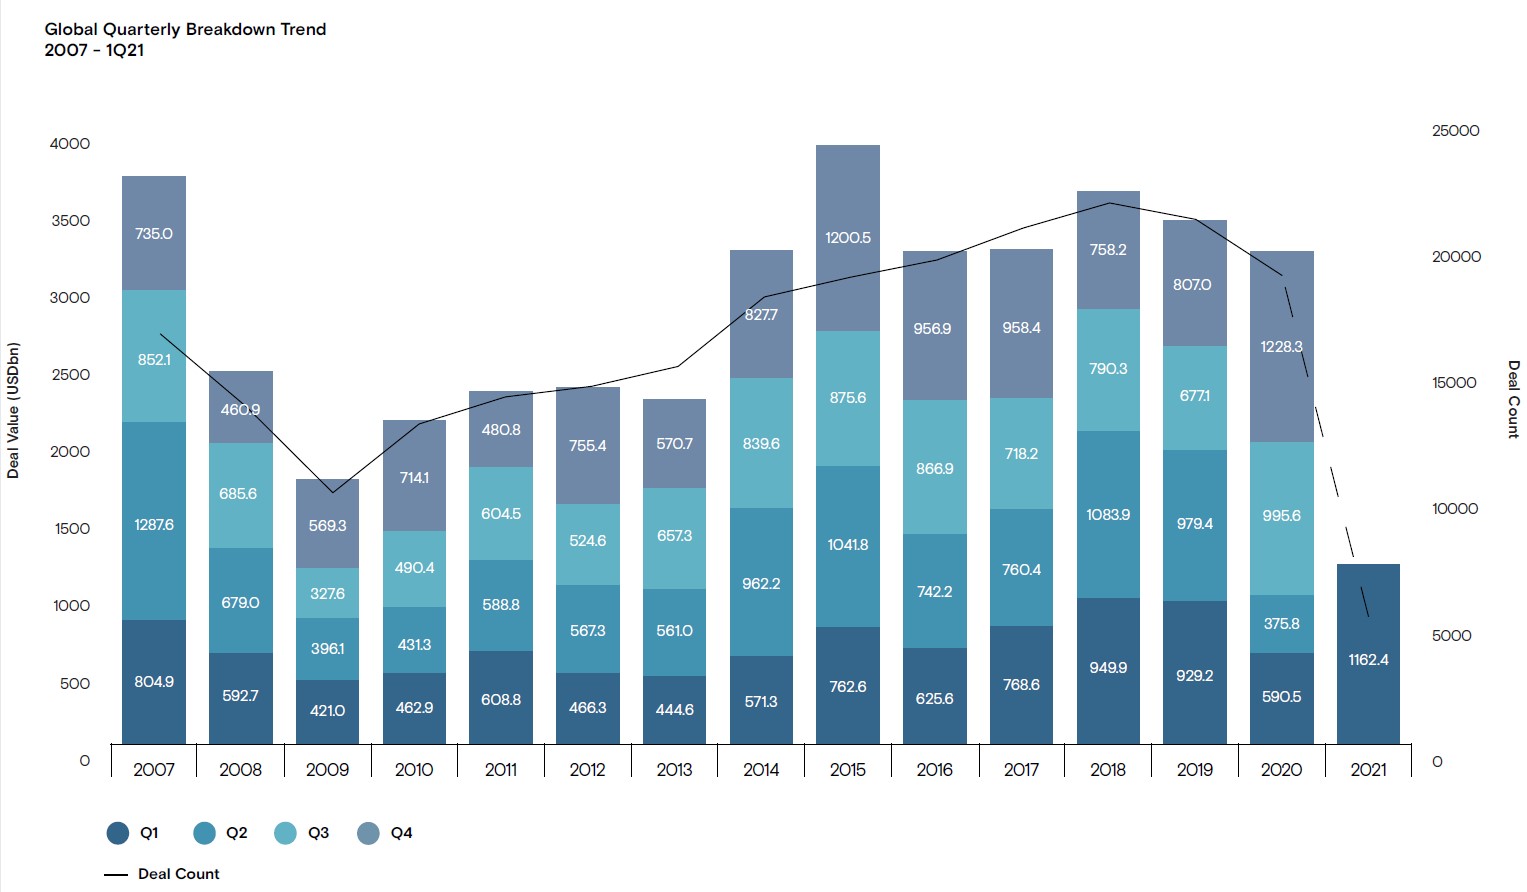
Globally, first quarter activity in 2021 reached USD 1.16tn in transactions, surpassing even the red-hot 2018 and 2019, and making 1Q21 the most active annual opening on record and one of the highest ever. Large deal values but fewer deals have led to the highest average deal value since 2006 of USD 518.7m (based on 2,243 deals with disclosed deal values).
International dealmaking shows strength.
Cross-border deals were a significant contributor to overall activity, hitting a record of USD 516.6bn for first quarter activity and nearly returning to historical averages of more than 44.4% of total deal value.
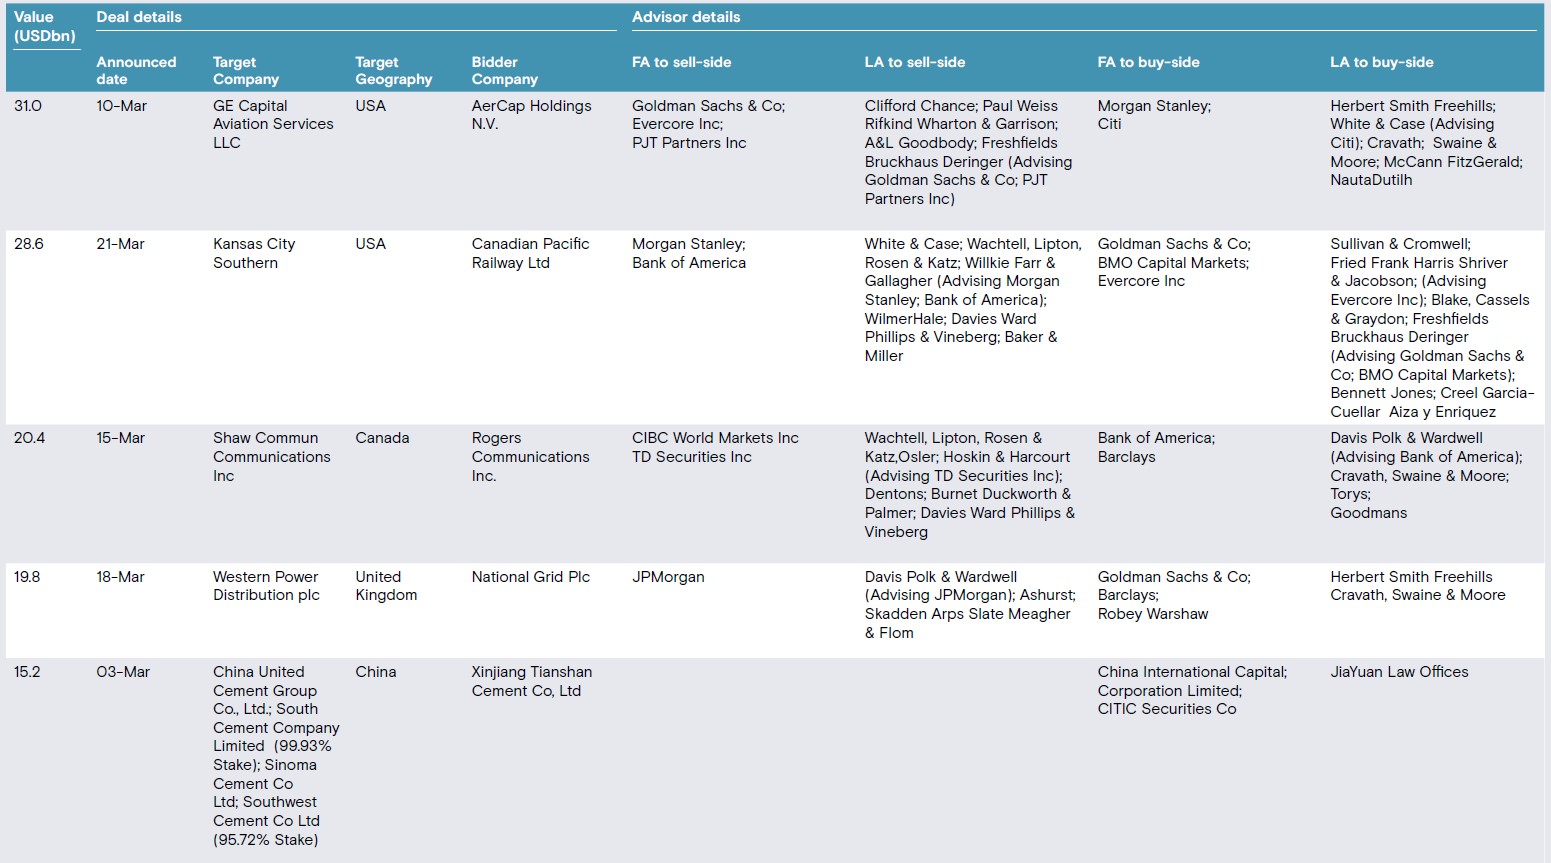
The two largest deals announced in the quarter were crossborder deals that involved US targets: AerCap Holding’s USD 31bn bid for GE Capital Aviation Services and the planned USD 28.6bn merger of Canadian Pacific Railway and Kansas City.
North America back with a vengeance.
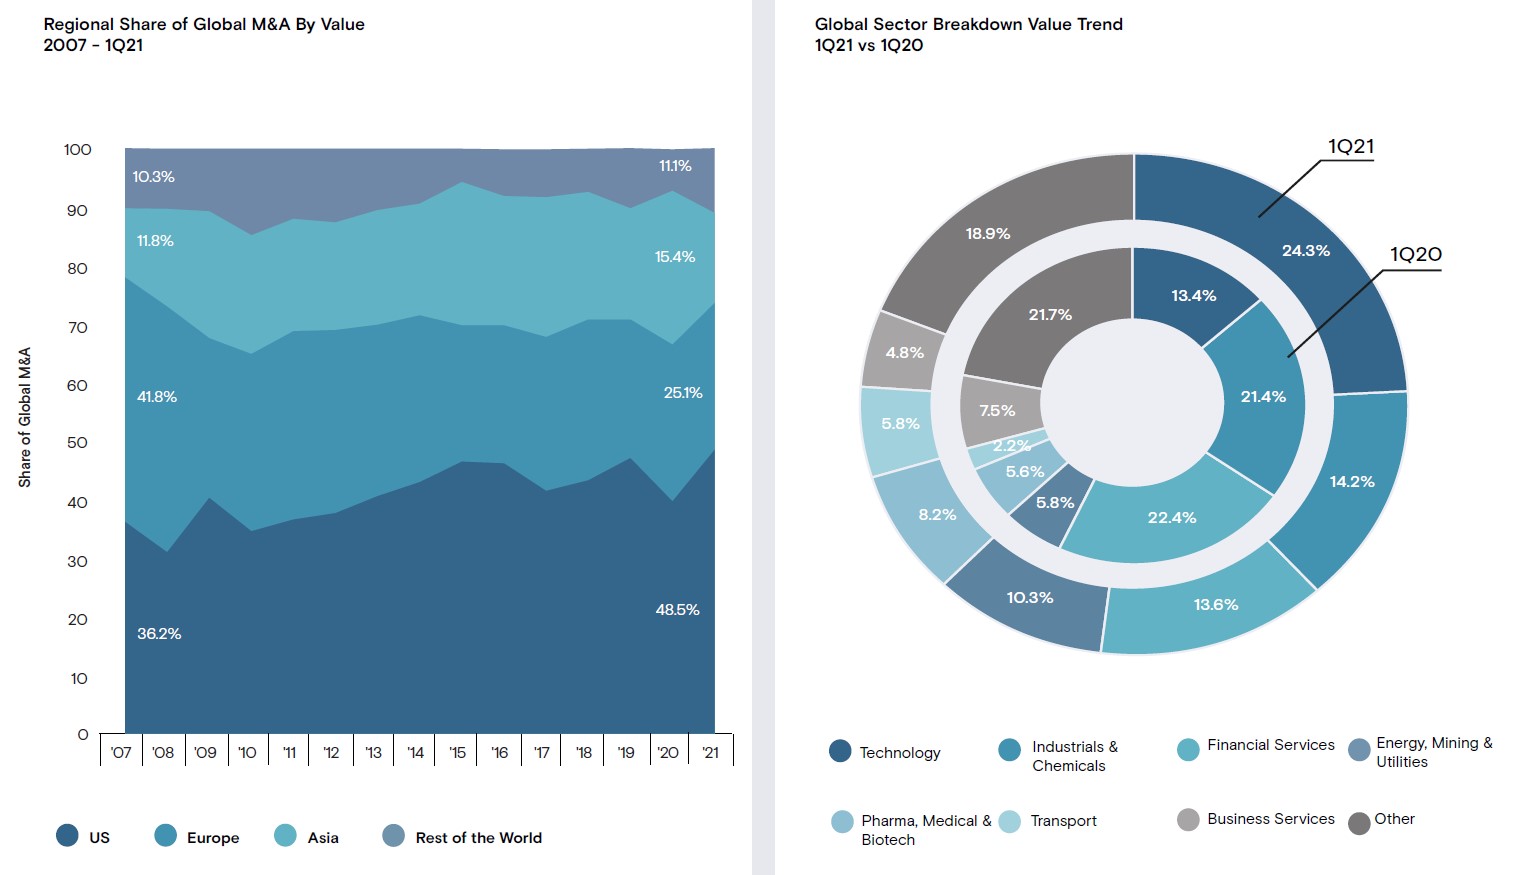
North America, dominated by the US, reached its highest market share in 14 years netting 54.4% of global deal value, up from 48% in 4Q20. It is a marked turnaround from 2Q20 when North America plunged to 21.5%. North America’s gain came at the expense of all other regions. Save the Middle East, all other global regions lost market share. APAC ex Japan saw its market share decline to 14%, down significantly from its 37.2% share in 2Q20.
The US was also home to more than two-thirds (USD 137.8bn) of the USD 200.9bn in global IPOs in 1Q21, according to sister product Dealogic. There were 398 IPOs in the US compared to 762 worldwide. Overall, global IPO activity in 1Q21 reached nearly two-thirds of the value of all 2020 activity (USD 319.5bn on 1,592 IPOS).
SPAC space surges.
Special purpose acquisition companies (SPACs) played a large part in the overall increase in IPO activity and, particularly, in the US. Year to date, more than USD 97bn has been raised by 304 SPACs globally, the figures showed.
The SPAC surge may take hold in Europe as an increasing number of the specialized vehicles are coming to market (https://www.mergermarket.com/intelligence/view/intelcms- 7xfp6h). M&A tied to SPACs has also been spiking, with 99 deals totalling USD 219.5bn taking place globally in 1Q21, eclipsing all of 2020, Dealogic data shows. The average deal value for SPAC transactions was USD 2.2bn for the quarter, up from USD 1.2bn in 2020.
Large deals increase even as mega deals decline.
The rising buying power of SPACs may be one factor in the rise of deals in the USD 2bn to USD 5bn range. Deals between USD 2bn and USD 5bn have jumped from 19.5% of all deal value in 4Q20 to 23.6%, USD 274bn on 91 deals. Deals greater than USD 5bn in value, which surged in the latter half of 2020, declined in absolute and relative terms. Deals greater than USD 5bn represented more than 44.5% of all deal value in 2H20. In 1Q21, deals such deals declined to 36.4% (USD 423.4bn on 46 deals).
Private equity flexes muscles.
For years, the amount of reported dry powder held by private equity has risen to ever greater levels. The COVID-19 pandemic appears to have acted as another catalyst for sponsors to deploy capital. In 1Q21, PE buyouts reached new heights with USD 296.6bn in buyouts (1,156 total deals), one of the most active quarters since 2001 in terms of deal value save 2Q 2007.
Since 3Q20, PE sponsors have deployed USD 683.5bn. That buyout surge follows several quarters of outstanding exit activity. Over the last three quarters, private equity exits have totalled USD 638.9bn in deal value, including USD 213.9bn in exits and 711 total deals in 1Q21, representing a USD 212.9bn quarterly average. That level is 140% the historical average of USD 88.7bn per quarter since 2001.
Technology dominates, but Transport biggest winner.
Technology Media & Telecoms (TMT) continued its deal-making dominance with USD 344.8.7bn in deal value and 1,237 total deals in the space, making up 29.7% of all deal value. Year over year, the shift has been striking, with deal value jumping 247% from USD 99.4bn in 1Q20.
Nearly every sector saw increases in deal value but the Transport sector saw one of the greatest year-over-year increases. Transport deals rose 424.9% reaching USD 66.9bn and 140 deals in 1Q21 from USD 12.7bn and 170 deals in 1Q20. Energy, Mining & Utilities also turned in an impressive 248.3% increase, rising to USD 119.2bn on 373 transactions from USD 34.2bn and 303 deals.
“Carrying forward the momentum of 4Q20, global mergers and acquisitions activity turned in a strong first quarter performance” – Mark Druskoff, Data-Driven Content Coordinator
Top Deals
Read the full report here by Merger Market

