
A lot of talk on Twitter this week pointing out that CTA / managed futures/trend following has been doing quite well during this sell-off and rally in commodity markets like Oil….without much in the way of investor interest??
Q4 2021 hedge fund letters, conferences and more
SG CTA Trend index is up >8% year-to-date and it feels like people still aren’t interested in CTAs.
Still think this is why the stacking???? framework is useful.
Makes allocation an AND, rather than an OR decision.
— Corey Hoffstein ????☠️ (@choffstein) February 23, 2022
What gives? Well, it looks like there’s some confusion on just what the CTA return profile looks like:
Makes sense. Is there a generally accepted average historical return for the category? I see really high and low numbers and can’t make sense of what is the standard for the industry
— Dallinar (@Dallinar) February 24, 2022
Who are the idiots that didn’t put that information in THE GUIDE to trend following (download the free whitepaper here)… that would be us. But, hey, what’s a blog for if not for being able to help fix and explain your own issues. So what does the average historical return look like for CTAs? Glad you asked. Here’s 21 years of data from 2000 to Dec 2021 on the main indices we use internally here at RCM.
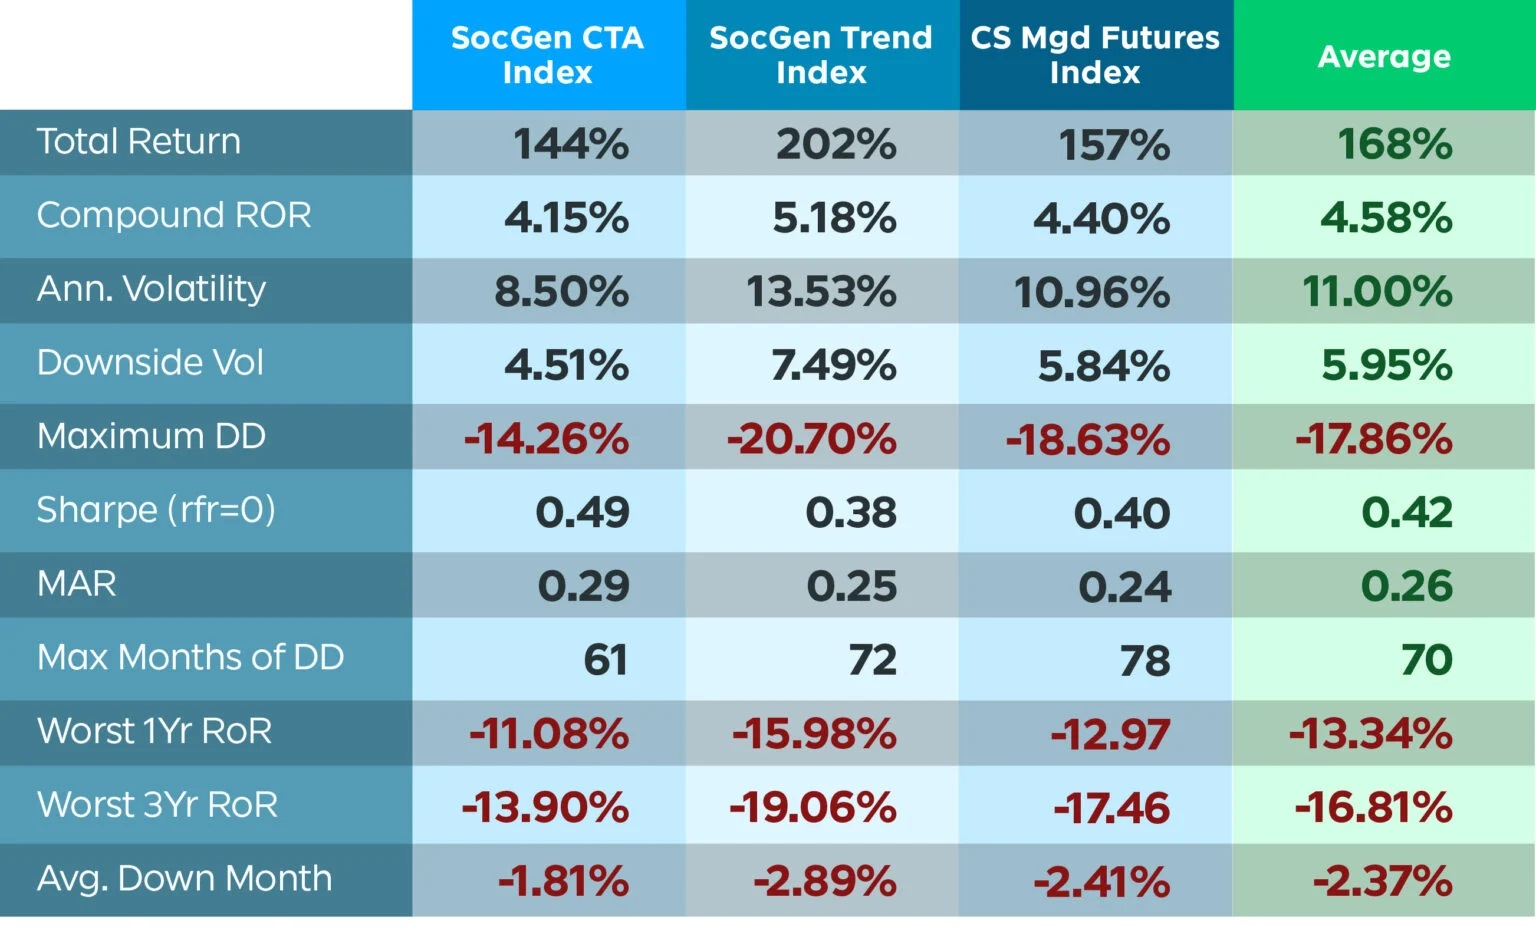
Past performance is not indicative of future results.
So… about a 4.5% annual compound rate of return, with 11% yearly volatility and an 18% max drawdown. Compare that to 8.7% returns/ 17% vol / -41% DD for Gold, or 7%/15%/-50% for stocks, and maybe that’s why investors aren’t banging down the door to access CTAs?
But let’s take a step back and consider what CTAs are trying to do and where they can really shine for the portfolio. Take a look at their 20+yr performance alongside commodities and bonds – you know – the things that make up the bulk of their portfolios:
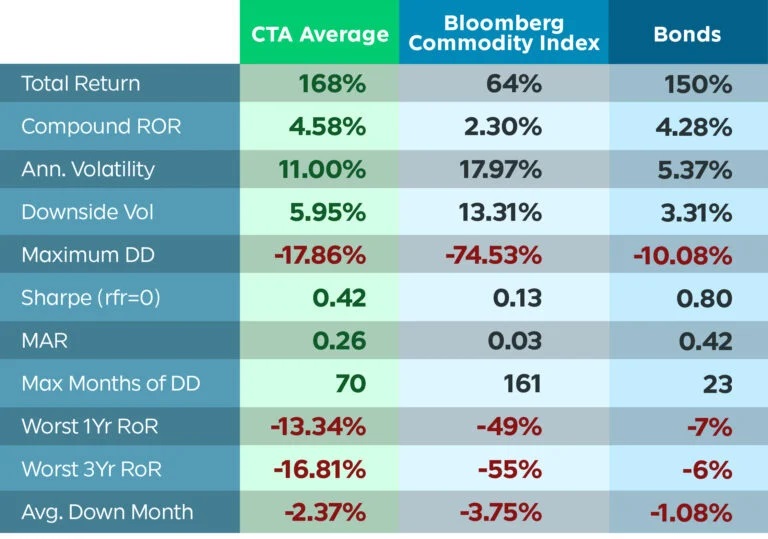
Past performance is not indicative of future results.
Because they can go long and short commodities, they’re able to outperform a simple buy and hold commodities drastically in terms of the volatility and max drawdown. Who in their right mind would hold a long only commodities allocation through 161 months of drawdown… ouch. If you take anything away from everything we say about CTAs, have it be that it’s a heck of a lot smarter and less painful to trend follow commodities than just buy and hold them.
Which brings us to bonds. That’s quite a Sharpe ratio for something that is mostly nothing – give your money to the U.S. govt, get it back with interest a bit later. But what do you do now? After the 20-year bull run in bonds (rates to historic lows). CTAs enjoyed that run…. And are now enjoying the sell-off! They go short bonds too (rates higher), and while it won’t look just like capturing the uptrend – it’s sure to capture some of it like we’ve seen over the past few months, leading some to consider CTAs in this environment as a bond replacement.
So, there you have it @dallinar – the historical return profiles. Of course, all of this ignores the ‘when’ and is just the ‘how much’. The ‘when’ can be much more important in the case of CTA, with their returns tending to cluster around periods of increased volatility, increased inflation or interest rate movements, and during stock market crisis periods like the dot com bubble and GFC. But, there’s an infographic for that:

Article by RCM Alternatives

