
Alpine Capital Research commentary for the first quarter ended March 31, 2019, titled, “A Historic Divergence.”
Q1 hedge fund letters, conference, scoops etc

US markets ran hot in 1Q with the S&P 500 posting a 13.7% total return – a whopping 68.0% if annualized. ACR’s flagship EQR strategy poked along at 5.1% – a more pedestrian 22.1% if annualized. In our opinion, quarterly market “returns” are a better reflection of investor psychology than of concrete economic results.
The emotionally charged Mr. Market breathed an ebullient sigh of relief after his 4Q panic over a possible global recession. We believe both reactions were overdone – not because a market decline should be unexpected, but for the rationale of a recession. ACR includes the prospect of recession in our valuation estimates, which we believe should be standard practice. The real fear in our opinion should be of high prices. On that point the market seems oblivious.
As investors, we believe true equity market economic results are better measured by the earnings yield than quarterly market price fluctuations. In this we are simpatico with the great economist J.M. Keynes who defined investment as forecasting yields and speculation as forecasting the psychology behind price fluctuations. The earnings yield (earnings divided by price) is similar to a bond yield (interest divided by price), but for stocks. Unlike market fluctuations, which stem from Mr. Market’s mood swings, the earnings yield measures the cash earning power which our companies generate for us as shareholders.
Our analysis shows a historic divergence today in earnings yields between ACR’s strategies and the broader markets. The estimated yield on our holdings has become increasingly attractive as the US stock market yield has become increasingly unattractive. Since market values eventually converge toward sustainable cash earnings, we believe the divergence in ACR and market yields will reverse, with major repercussions for ACR clients (positive) and general stock market investors (negative).
Our Q1 commentary is organized according to three main points:
1) The EQR Estimated Earnings Yield has risen significantly in recent years to historic highs, whereas the S&P 500 Earnings Yield has drifted lower to historic lows.
2) We believe the implications of our estimated divergence are significant, as small percentage differences in annualized return translate into large dollar disparities in spending power and future value.
3) Extraordinary discipline is required to resist the siren song of market gains which we believe will prove ephemeral.
The EQR Estimated Earnings Yield has risen significantly in recent years to historic highs, whereas the S&P 500 Earnings Yield has drifted lower to historic lows.
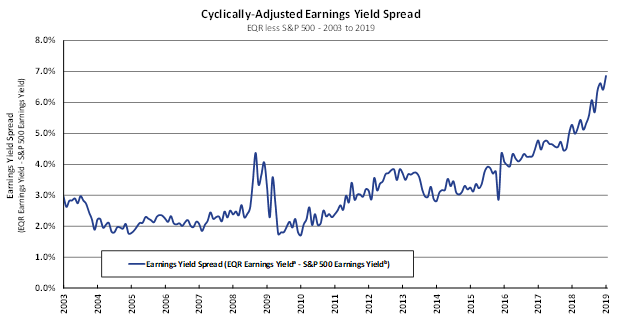
The first chart below shows how the EQR Estimated Earnings yield jumped to 10.0% while the S&P 500 Earnings Yield fell to 3.1% in recent years. The second chart shows the spread between the two yields approximated 2-4% from 2003-2016, then took off in hockey-stick form to 6.9% from 2017-2019.
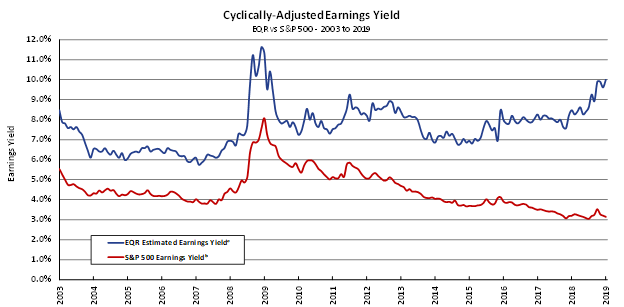
Earnings Yield (“EY”) is the inverse of the Price-to-Earnings Ratio (i.e. EPS/Price). EY represents estimated earnings that could be paid out in dividends as a percentage of current price. Yields (income/price) are the most fundamental metric to compare the margin of safety for an investment (e.g. Earnings Yield for Equities, Yield to Maturity for Bonds).
ᵃ EQR Estimated Earnings Yield is the weighted average estimated normalized cash earnings yield for investment holdings in ACR’s Equity Quality Return Strategy.
ᵇ S&P 500 Earnings Yield (ACR CAPE Earnings Yield) is calculated using Real S&P 500 Price Per Share (PPS) divided by an Ordinary Least-Squares Regression (OLS) trendline of S&P 500 Real Earnings Per Share (EPS) from 1926 to 2019.
Price as of Mar 31, 2019; EPS as Dec 31, 2018. Sources: S&P Dow Jones Indices; Robert Shiller; BLS- CPI Data; ACR Alpine Capital Research.
We believe the implications of our estimated divergence are significant, as small percentage differences in annualized return translate into large dollar disparities in spending power and future value.
The earnings yield is a barometer for future real returns (returns reduced by inflation), and ultimately investor spending power[i]. For example, on $1 million in assets, a 6% versus 4% real annual return is commensurate with having $60,000 in sustainable spending power versus $40,000. In other words, a 50% “raise”. Compounded over 20 years, that is an extra $1 million adjusted for inflation. Given today’s yield divergence between EQR and the market, the gap in dollar values is difficult to fathom. A 9% (net of 1% fee) versus 3.1% real annual return is commensurate with $90,000 per year in sustainable spending power versus $31,000. A 190% “raise”. Compounded over 20 years, that is an extra $3.8 million adjusted for inflation.
ACR cannot guarantee any of these figures will prove accurate or will be realized. We can only assert with confidence that, based upon our analysis, we believe the data is directionally correct. In recent commentaries, we have attempted to show how our valuation statistics have translated into actual long-term market returns (see our April-2018 commentary). In addition to this quantitative evidence, our analysis also rests on the nature of the figures and the work that went into producing them. Warning: the following two paragraphs contain explanatory technical detail which may cause drowsiness.
Correctly calculated, the “earnings” in the earnings yield represents the amount of cash earnings a company could distribute in dividends while maintaining its current unit production. The “yield” reflects that earnings are divided by price to arrive at a figure akin to the current yield on a bond. However, unlike bonds, which do not protect investors from an erosion in purchasing power due to inflation, inflation can be added to the earnings yield when estimating equity returns. The reason is that equity earning power, when properly adjusted, includes a charge for maintaining current productive capacity, while future equity earnings participate in inflation-driven growth.
Estimating earnings is critical in the investment team’s analysis. In effect, the portfolio manager’s job is to determine the amount, durability, and risks of security cash flows. Our estimates will be wrong for certain holdings, which is why we maintain a diversified portfolio and insist on a margin of safety between market price and our estimated intrinsic value. The margin of safety provides downside protection and improves our odds of positive surprises. The investment team therefore remains confident in our portfolio level figures. ACR will continue to share our security-level analysis in conference calls or upon request, allowing clients a more detailed view of our process and work.
Unfortunately, historically low income from a 3% earnings yield does not represent the full risk of investing in the broad stock market today. A potentially greater risk is a sustainable rise in earnings yields (i.e., a decline in P/E multiples) to historical averages, which we have discussed at length in previous commentaries. The following table shows potential stock market price declines associated with higher earnings yields.
Decline in Price Given a Beginning 3% Earnings Yield
| Stock Earnings Yield | 4% | 5% | 6% | 7% | 8% |
| Stock Price Decline | -25.0% | -40.0% | -50.0% | -57.1% | -62.5% |
Extraordinary discipline is required to resist the siren song of market gains which we believe will prove ephemeral.
Despite the known risks and arithmetic consequences, “FOMO” (Fear of Missing Out) has been gaining traction among stock market participants. Some think we are in the early days of FOMO and the market has much further to run. We have no idea. The ACR investment team does not attempt to forecast when bull markets will begin or end. If we could predict stock prices, we would not spend all our time poring over financial statements to better understand fundamental cash flows and values. We do know this period reminds us of another nearly twenty years ago.
At our founding in late 1999, I explained to our initial clients that we would significantly underperform the market as long as the speculative cycle of that day continued. At the same time, I indicated that we would protect the capital entrusted to us, and that the arithmetic of our valuations implied a satisfactory return over time. Lastly, I opined that the average investor may not be so fortunate. The figures in 1999 are eerily similar to today’s. To recount our July-2002 commentary: “During most of the year 2000, we paid approximately $10 for each $1 of earnings purchased, while it cost $30 to buy $1 of earnings in the S&P 500.” In other words, the earnings yield on EQR stock purchases at our founding was 10%, while the earnings yield on the market was 3%.
What happened next? From 2000-2002, EQR’s total return (dividends and gains) was 66.2% while the S&P 500 was -39.0%. ACR is certainly not forecasting a reset of this magnitude today. We have said in the past that we are highly unlikely to outperform the market by such a large margin in so short a time again. The valuation differences may appear nearly the same today as in 2000, but we are currently holding more cash and cannot predict when today’s gap will close. We also shared with our investors in 2002 that we were not as smart as they thought after 2000-2002, nor would we be as dumb as they think during the next speculative cycle. Sure enough, ACR lagged the market from 2003-2007, before looking smart again from 2008-2011.
The roller coaster of market cycles is a reliable fixture in the history of financial markets. The current cycle is no different. Elevated financial market prices from the mid-teens of this decade to today in our view contain significant uncompensated risks. We believe it is very possible that a large portion of the broader stock market gains during this period could be given back. Regardless of how market conditions play out, we will patiently maintain our discipline, confident that valuation arithmetic will win the day. To paraphrase a quote attributed to Mark Twain, 2000-2002 might not repeat itself, but it could certainly rhyme.
Nick Tompras
April 2019
[i] The earnings yield is not a good barometer of real return for companies experiencing extraordinarily high growth and capital returns. Taken as a group neither EQR nor the S&P 500 has those characteristics.

