
This article focuses on a composite view of the P/E ratio to look at how AEJ (Asia Ex-Japan) equities are currently trading compared to recent history, as well as bringing in some longer term context. The main objective is to consider whether there is still value in AEJ equities, and our conclusion is that although valuations have re-rated significantly, there may still be some scope for further upside.
Q1 hedge fund letters, conference, scoops etc
The chart comes from an exclusive report on Asia Ex-Japan equities, which along with valuations also reviewed the price/ policy/macro picture.
The chart below shows AEJ equity valuations trading below their long-term average, but as alluded to, valuations are no longer at rock bottom.
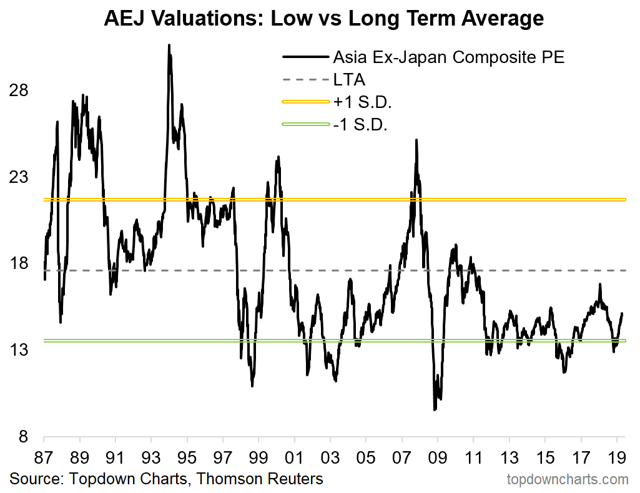
This chart presents a composite view of the P/E ratio; taking an equal-weighted average of the trailing 12-month P/E, next 12-month P/E/, and P/E 10 (price vs. average earnings of the past 10 years), and compares against the long-term average. Also shown are standard deviation bands (i.e., one standard deviation above and below the long-term average).
Even though valuations are no longer at rock bottom, they are by no means overvalued but instead are still trading below the long-term average and are currently about in line with the average of the past decade. This tells us that even though the valuation picture is not as compelling now, there is still arguably scope for upside valuation re-rating.
Now, some people reading this may think to themselves that the P/E ratio can be a flawed metric and they will be correct in that there is no one perfect indicator. We do, however, make at least an attempt to address this by using a composite version of the P/E ratio, which in effect provides a compromise between the 3 P/Es, and basically gives each of them a vote to try and focus on the signal rather than the noise.
Another point is sometimes in investing all you need is a majority of investors to believe something works and it will work regardless of whether you believe it works or not. For example, many people believe technical analysis does not work but in the currency market majority of participants believe it works; thus in the end technical analysis works in the currency market regardless of your views on it.
The other thing is although the P/E/ ratio has its flaws, a study conducted by Pinto, Robinson & Stowe (2018), in which they surveyed professional equity analysts, found that 92.8% of respondents reported using a market multiple approach (P/E, P/CF) in valuation, making it the most popular approach. The survey also found that 88.1% of respondents who use a market multiple approach use P/E (price to some form of earnings), making it the most popular among the market multiples. This tells us that despite the flaws of P/E as a valuation metric, it is still the most used market multiple in the industry and thus requires investors’ attention.
With increasing geopolitical risk across the globe (not to mention policy and politics), it can be easy to get lost in the noise and overlook the core factors that drive risk and return over the medium term.
We believe not only have issues like the trade war, slump in Asian exports, and softer growth in China caused investors to overlook the cheap valuations seen earlier this year, but that for the most part a lingering sense of skepticism remains. On our metrics the macro pulse is turning (up), earnings momentum has bottomed out, and the policy outlook has turned bullish for risk assets.
So the bottom line is that there is still value for AEJ Equities, albeit less than the past. And while they’re no longer the value play they once were, the policy/macro/sentiment picture is on an improving path.
If you like my free articles, you will probably like our Marketplace service, which takes a deeper look at select ideas, provides you with a big picture weekly global market snapshot, and a monthly cheat-sheet on the outlook across global markets…
Article by Top Down Charts

