
Executive Summary
The analyses in this report are derived from the public plan documents in eVestment Market Lens. Market Lens aggregates thousands of documents sourced from the U.S., Canada and the U.K., ranging from asset allocation studies to program reviews and manager evaluations.
Q1 hedge fund letters, conference, scoops etc
As institutional investors review their asset allocations periodically, they typically begin with capital market assumptions for each asset class and strategy within their portfolios. Often these assumptions are provided by consultants.
Market Lens includes broad data on capital market assumptions, and eVestment has aggregated this data for 2018 and 2019.1 This aggregation lets consultants, asset managers and institutional investors conduct their own comparisons of return assumptions and to assess the spread of assumptions within an asset class.
Key Findings
- The spread between intermediate-term capital market assumptions for US Large Cap Equity decreased from 225bps in 2018 to 120bps in 2019
- Intermediate-term assumptions for Bank Loans did not overlap at all in 2018 and 2019; in 2018 the range was 4.3% – 4.9%, in 2019 the range was 5.5% – 5.9%
- In 2018 the lowest assumption for Emerging Markets Debt (Hard Currency) was Aon’s at 3.7%; in 2019 the lowest assumption for the same strategy was NEPC’s, at 4.75%
- For their 2019 assumptions, NEPC increased their intermediate-term and long-term assumptions for Energy by 150bps and 175bps respectively
- RVK was the only consultant to decrease their long-term assumptions for Private Equity
Traditional Asset Classes
Of the traditional asset classes, our study focuses on Equity and Fixed Income as generally, these asset classes make up the core allocations of many public plans’ portfolios. The liquidity of Equity and Fixed Income investments is appealing for these types of investors, as they have ongoing commitments for pension payments.
Equity
The Equity market has experienced directional shifts for several years. According to RVK, “as of the January 3, 2019 market close, the S&P 500 Index declined by more than 14% from the market peak reached on September 20, 2018 …. as a result of the regional equity market declines, the global equity market, as measured by the MSCI All Country World Index, finished 2018 with negative annual returns for the first time since 2015.” 6
Many institutional investors have Equity exposure and looking at forward-looking capital market assumptions for Equity may be helpful for any future asset allocation decisions.
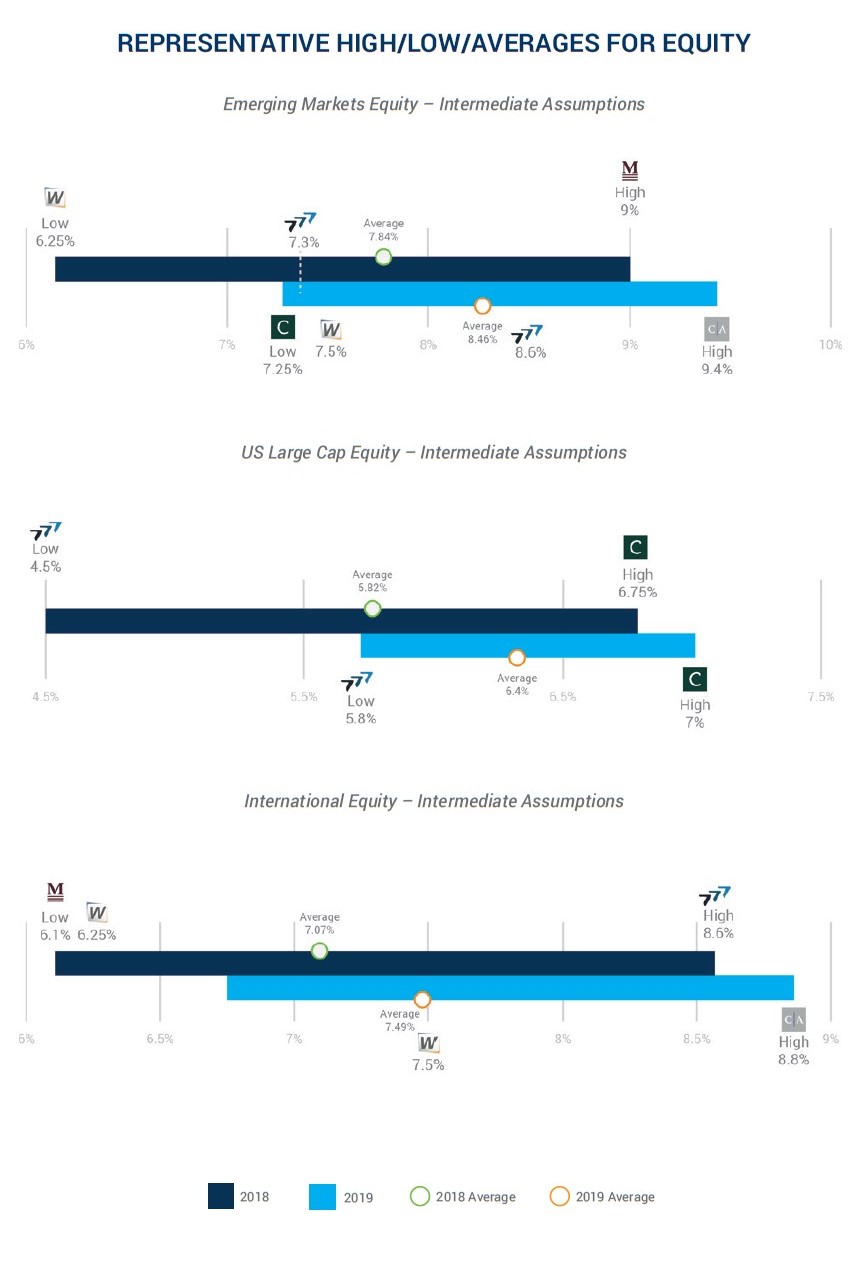
When looking at consultants’ capital market assumptions for Equity, the assumptions were grouped into seven categories:
- Emerging Markets Equity
- Global Equity
- International Equity
- US Equity
- US Large Cap Equity
- US Small Cap Equity
- US SMID Cap Equity
We conducted a spread comparison between Equity sub-strategy assumptions and US Large Cap Equity and International Equity assumptions. In other words, we compare not only a consultant’s assumptions to their peers’ but also how each consultant’s US Large Cap Equity and International Equity assumptions fall in relation to their other Equity assumptions.
Equity Intermediate-Term Assumptions
Representative data for intermediate-term assumptions was found for seven unique consultants. For both years of data analyzed, Emerging Markets Equity had either the highest or second highest return assumptions.
The range of assumptions was 6.25% – 9% (275 bp difference) in 2018. In 2019 the range was 7.25% – 9.4%, a 215 bp difference. The lowest return assumption across both time periods and strategies was Cambridge’s assumption for US Equity in 2019 at 3.4%.
Notable Changes:
- Verus’ assumptions for Emerging Markets Equity and US Large Cap Equity increased by 130 bps from 2018 to 2019.
- Wilshire’s International Equity assumption increased from 6.25% in 2018 to 7.5% in 2019.
- NEPC lowered their International Equity assumptions by 75 bps, but raised their US Large Cap Equities assumptions by the same amount.
Equity Long-Term Assumptions
We analyzed six consultants’ long-term Equity assumptions. Aon, Meketa, and Segal Marco all raised their 2019 assumptions for Emerging Markets Equity while NEPC’s assumptions remained unchanged. Both Aon and Meketa increased all of their Equity assumptions in 2019.
Interestingly, out of the six Equity assumptions RVK released, the consultant increased all assumptions for EM Equity, International Equity, and Global Equity but lowered assumptions for all US Equity strategies.
Fixed Income
Public funds may view Fixed Income investments as a source of reliable income over an extended period. These strategies may also help to reduce or diversify portfolio risk.
As Meketa noted in Why Hold Bonds?, “2018 saw a return of volatility that appears to be continuing into 2019… Diversification with bonds helped a portfolio through those equity drawdowns.” 7
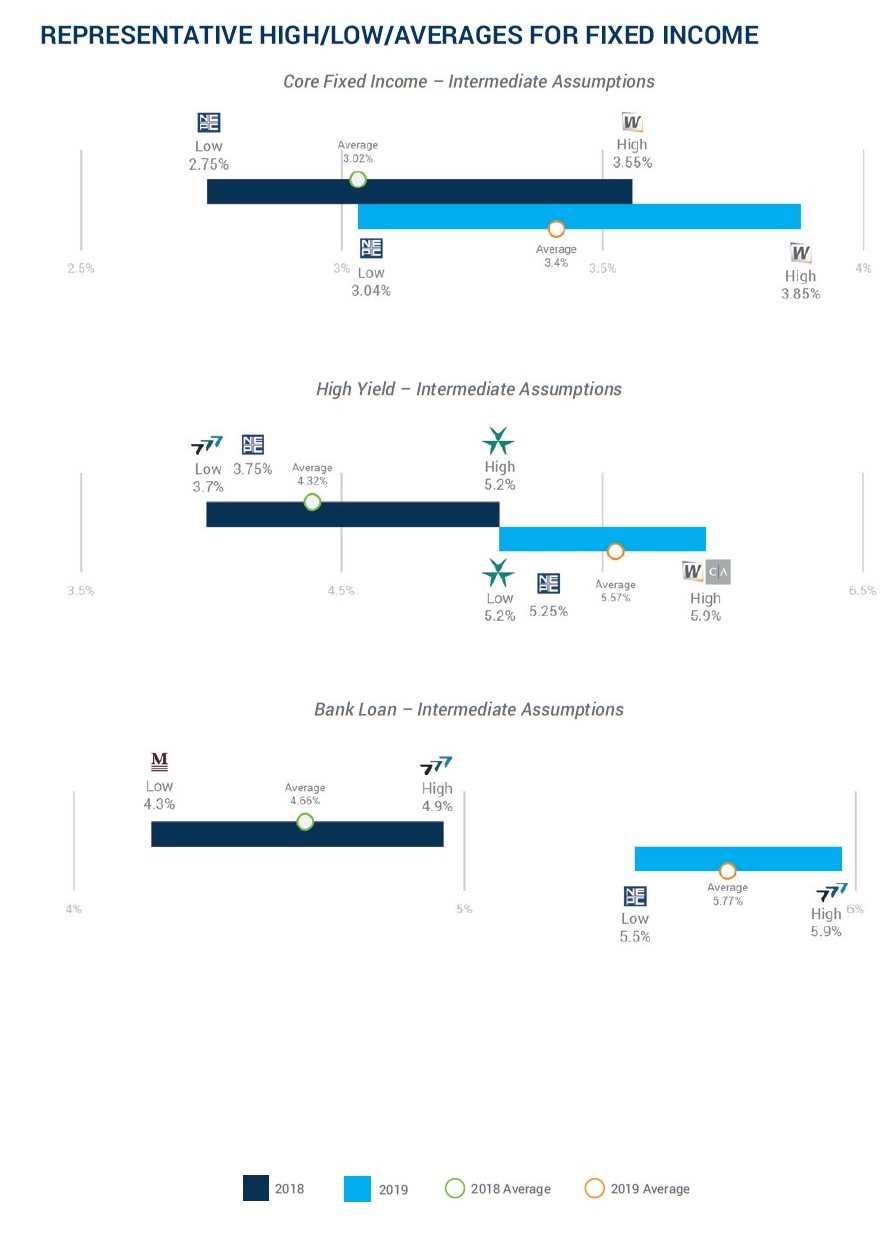
Similarly, raising “safe-haven” Fixed Income was listed as a key theme and opportunity by NEPC for 2019. A total of 16 sub-strategies were used to compare assumptions across consultants:
- Bank Loans
- Core
- Core Plus
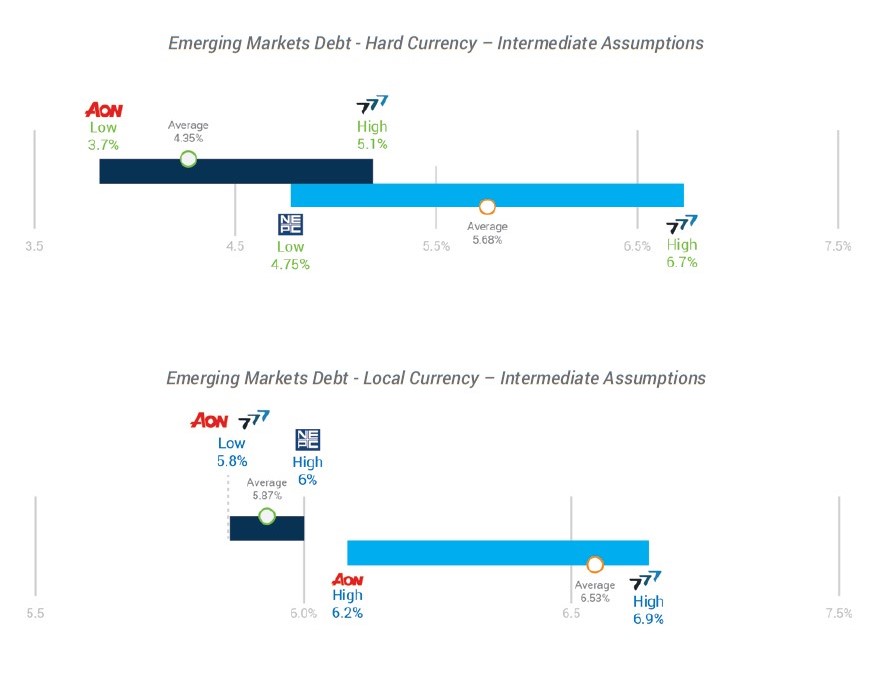
- Emerging Markets Debt
- Emerging Markets Debt (Blended Currency)
- Emerging Markets Debt (Hard Currency)
- Emerging Markets Debt (Local Currency)
- High Yield
- Intermediate Duration
- International
- Investment Grade
- Long Duration
- Short Duration
- TIPS
- Treasuries
- US Fixed Income
We also conducted a spread analysis for Fixed Income capital market assumptions, comparing each consultant’s sub-strategy assumptions with their own assumptions for Core Fixed Income. This allows us to easily compare, for example, NEPC’s Core Fixed Income assumption vs. their Emerging Markets (Local Currency) assumption.
Fixed Income Intermediate-Term Assumptions
Aon, NEPC, and Verus all increased their assumptions for Bank Loans by 100bps or more in 2019. All the consultants with 2019 data increased their assumptions for Long Duration, except for NEPC which decreased its assumptions for the strategy by 50 bps.
In 2018, the lowest assumption for Emerging Markets Debt (Hard Currency) was Aon’s at 3.7%; in 2019 the lowest assumption for the same strategy was NEPC’s, at 4.75%. Callan increased all its Fixed Income assumptions in 2019 except for International Fixed Income, which remained at 1.4%.
In 2018 there was a 150bp difference between the lowest and highest assumptions for High Yield; that discrepancy decreased to just 70bps in 2019. NEPC increased its assumption for High Yield by 150bps in 2019. The high/low charts for Bank Loans did not overlap at all for 2018 and 2019.
Of note, the previous version of this Capital Market Assumptions report was published in mid- February 2018 when the short-term rate (for the 1-year T-Bill) was yielding 1.98%. As of April 1, 2019, the yield was 2.41% – an increase of approximately 43bps. Similarly, for the consultants that provided Short Duration Fixed Income assumptions, the average return expectation increased from 2.61% in 2018 to 3.3% in 2019 – an increase of 71bps.
Fixed Income Long-Term Assumptions
We analyzed five consultants’ long-term assumptions for Fixed Income. A notable change includes Meketa raising its Bank Loan and High Yield assumptions by 110 bps in 2019.
NEPC’s Emerging Markets Hard Currency assumptions increased by 125bps, but their Local Currency assumption only increased by 25bps. Aon and NEPC both raised their Emerging Markets Debt Local Currency assumptions while Meketa decreased its assumptions for the same strategy.
Conclusion
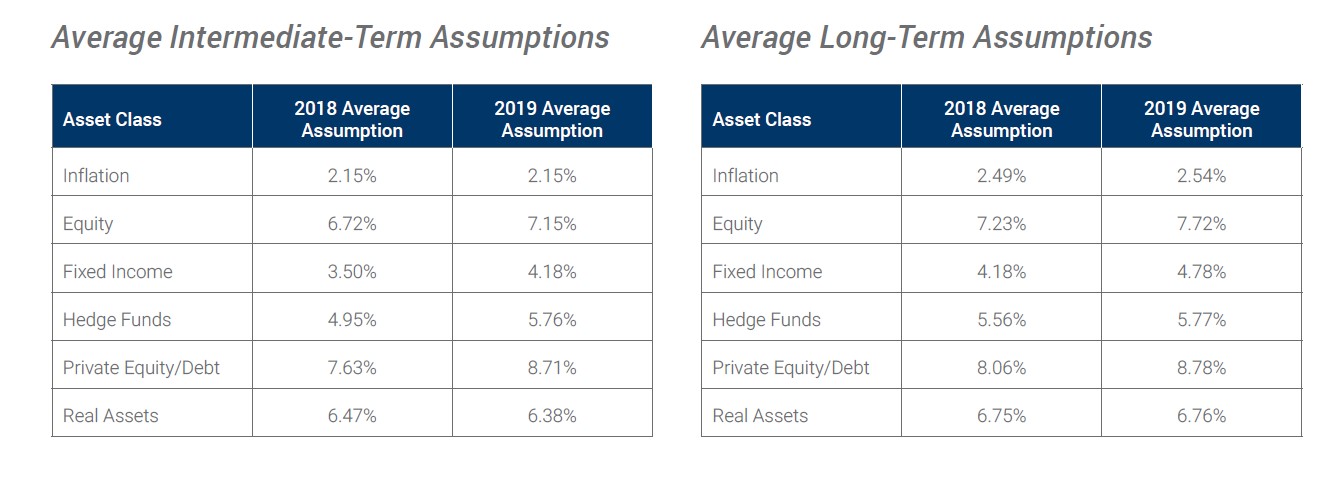
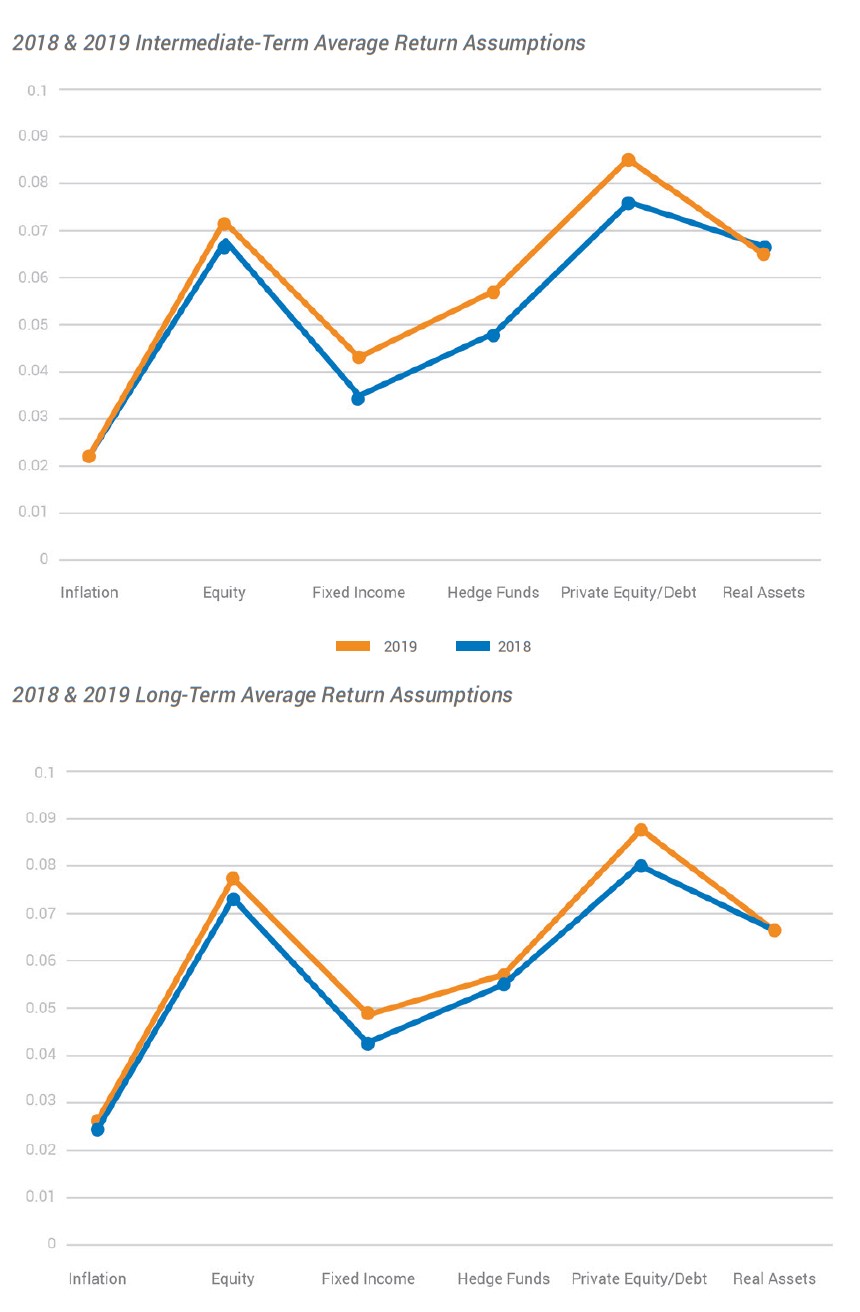
A high-level understanding of the changes in consultant capital markets assumptions can be gained by looking at average return expectations for each asset class analyzed.
We charted the average of the assumptions for Inflation along with each overall asset class analyzed: Equity, Fixed Income, Hedge Funds, Private Equity/Debt and Real Assets.
Intermediate-Term Assumptions
Overall, consultants’ intermediate-term capital market assumptions increased from 2018 to 2019. The result shows that while Inflation and Real Assets assumptions on average remained the same, return expectations for Equity, Fixed Income, Hedge Funds and Private Equity/Debt all increased. The largest increase was 108bps for Private Equity/Debt. Real Assets was the only asset class to have a slight decrease to their its average intermediate-term assumptions, a decline of 9 bps.
Long-Term Assumptions
Like the average intermediate-term assumptions, most of the average long-term assumptions increased. The largest increase was again in Private Equity/Debt, an increase of 70bps. For long-term assumptions, the return expectations for Real Assets increased from 2018 to 2019.
Article by Preqin

