
ETFGI reports assets invested in the Global ETF/ETP industry extend lead over hedge fund industry as gap widens to US$1.75 Trillion at the end of Q2 2018
Q3 hedge fund letters, conference, scoops etc
LONDON — October 23, 2018 — ETFGI, a leading independent research and consultancy firm covering trends in the global ETF/ETP ecosystem, reported today that assets invested in ETFs and ETPs listed globally amounted to US$4.99 trillion at the end of Q2 2018, following net inflows of US$85.47 billion and market moves during the period. The Global Hedge Fund industry saw assets rise to a record US$3.24 trillion, despite net outflows of US$3.0 billion over the quarter, buoyed by positive market moves, according to ETFGI’s Q2 2018 Global ETF and ETP industry landscape insights report, an annual paid-for research subscription service. (All dollar values in USD unless otherwise noted.)
Highlights
- Asset growth of global ETF/ETP industry continues to outpace global Hedge fund industry.
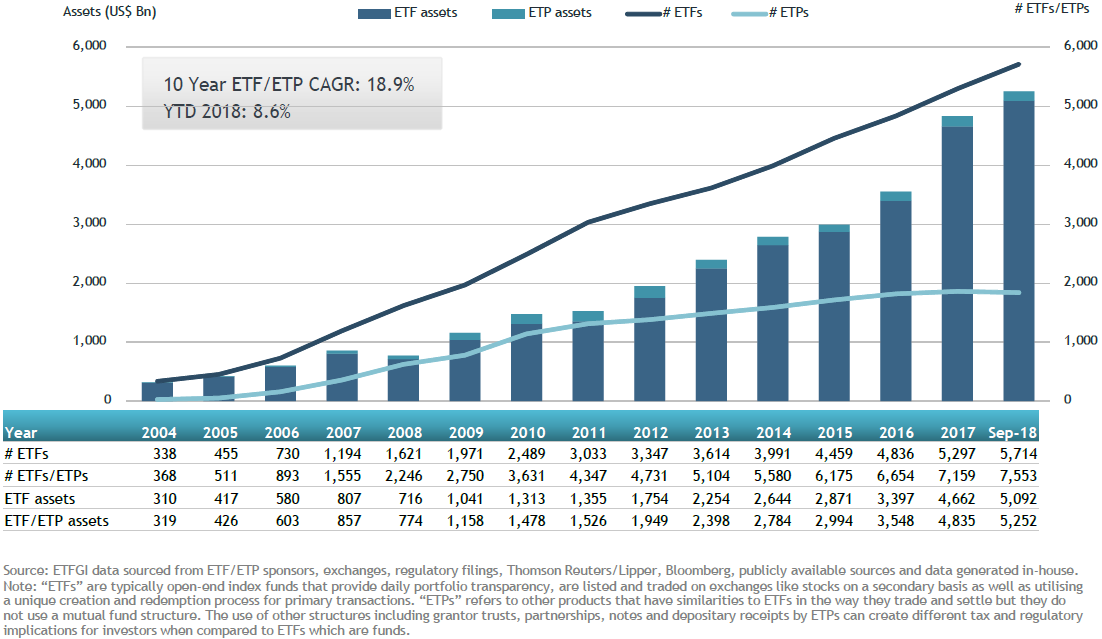
- $4.99 trillion invested in 7,430 ETFs/ETPs listed globally at end of June 2018.
- Record $3.24 trillion invested in 8,413 Hedge Funds listed globally at end of June 2018.
According to analysis by ETFGI, $4.99 Tn were invested in 7,430 ETFs/ETPs listed globally at the of Q2 ‘18, representing growth in assets of 1.36% over the quarter. Over the same period assets invested in hedge funds globally grew by 0.65%, to a record $3.24 Tn in 8,413 hedge funds, according to a report by Hedge Fund Research.
Total assets invested in the global ETF/ETP industry continues to extend the lead over assets invested in the global hedge fund industry, as the gap widened by 2.70%, from $1.70 Tn in Q1 2018, to $1.75 Tn. Assets invested in the global ETF/ETP industry first surpassed those invested in the hedge fund industry at the end of Q2 2015, as ETFGI had forecast. Growth in assets in the ETF/ETP industry has outpaced growth in the hedge fund industry since the financial crisis in 2008.
Growth in Global ETF and ETP assets as of the end of June 2018
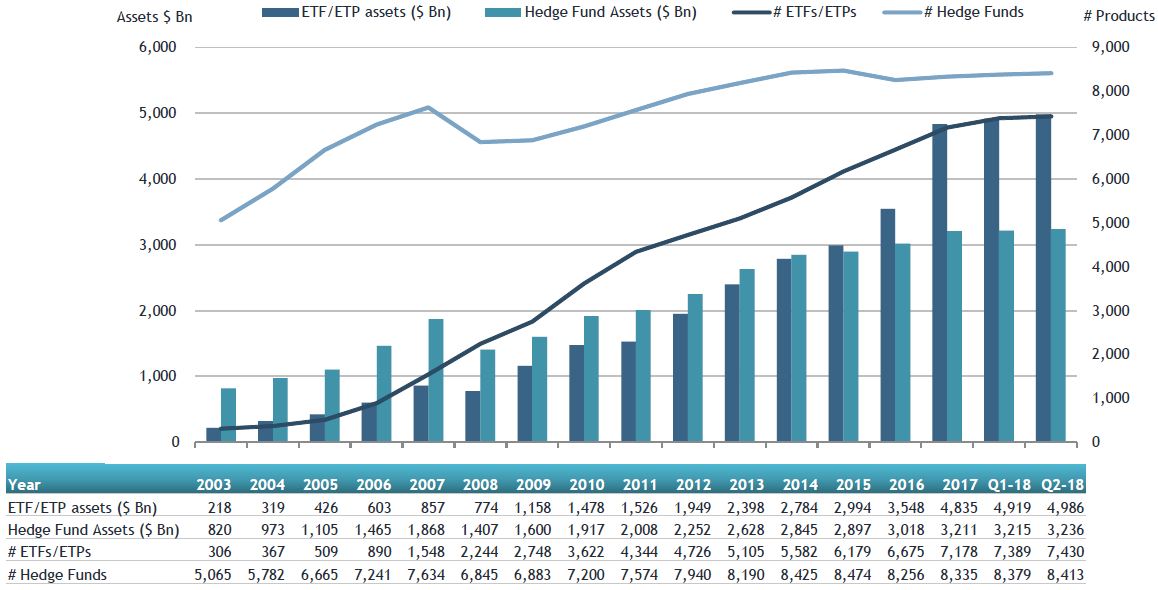
Sources: Hedge Fund Research HFR, ETFGI
In Q2 2018 the return of the the S&P 500 Index was higher than the performance of the HFRI Fund weighted Composite index: 3.44% vs. 0.84%, respectively.
Returns of the HFRI Fund Weighted Composite Index and the S&P 500 Index
| Year | HFRI Fund Weighted Composite Index |
S&P 500 Index w/ dividends |
| 2011 | -5.25% | 2.09% |
| 2012 | 6.36% | 15.99% |
| 2013 | 9.13% | 32.36% |
| 2014 | 2.98% | 13.65% |
| 2015 | -1.12% | 1.38% |
| 2016 | 5.44% | 11.93% |
| 2017 | 8.68% | 21.80% |
| Q1-18 | 0.14% | -0.76% |
| Q2-18 | 0.84% | 3.44% |
Sources: Hedge Fund Research HFR, S&P Dow Jones Indices
During the second quarter of 2018, ETFs/ETPs listed globally gathered $85.47 Bn in net inflows, according to ETFGI’s Global ETF and ETP industry insight report. June 2018 also marked the 53rd consecutive month of net inflows into ETFs/ETPs. Over the same period, HFR reported net outflows of $3.0 Bn from Hedge Funds.
Net New Asset (NNA) flows into ETFs/ETPs and hedge funds globally as of end June 2018
Sources: Hedge Fund Research HFR, ETFGI
Investors tended towards developed market equities during Q2, with equity-based ETFs/ETPs listed globally gathering net inflows of $49.0 Bn, and Equity Hedge strategy funds (as defined by HFR) seeing net inflows of $2.4 Bn.
The majority of net inflows into ETFs/ETPs can be attributed to the top 20 ETFs by net new assets, which have collectively gathered $1.5 Bn during Q1 and Q2 ‘18. The iShares Core MSCI EAFE ETF (IEFA US) alone accounted for net inflows of $18.07 Bn over the period.
Top 20 ETFs by net new assets June 2018: Global
| Name | Ticker | Assets (US$ Mn) Jun-18 |
ADV (US$ Mn) Jun-18 |
NNA (US$ Mn) YTD 2018 |
| iShares Core MSCI EAFE ETF | IEFA US | 57,500 | 551.1 | 18,069 |
| TOPIX Exchange Traded Fund | 1306 JP | 71,304 | 33.3 | 12,017 |
| iShares Core MSCI Emerging Markets ETF | IEMG US | 46,709 | 650.8 | 7,971 |
| iShares Short Treasury Bond ETF | SHV US | 15,049 | 155.5 | 7,014 |
| Daiwa ETF TOPIX | 1305 JP | 34,343 | 3.8 | 6,393 |
| Vanguard S&P 500 ETF | VOO US | 90,788 | 657.8 | 5,329 |
| Vanguard FTSE Developed Markets ETF | VEA US | 70,008 | 401.8 | 4,756 |
| iShares Core S&P 500 ETF | IVV US | 146,407 | 1,056.9 | 4,710 |
| Listed Index Fund TOPIX | 1308 JP | 31,631 | 4.4 | 4,423 |
| Nikkei 225 Exchange Traded Fund | 1321 JP | 51,942 | 48.5 | 3,808 |
| iShares Core U.S. Aggregate Bond ETF | AGG US | 55,309 | 361.4 | 3,799 |
| iShares Floating Rate Bond ETF | FLOT US | 10,399 | 94.2 | 3,782 |
| iShares Core S&P Small-Cap ETF | IJR US | 42,864 | 340.5 | 3,627 |
| iShares Edge MSCI USA Momentum Factor ETF | MTUM US | 9,199 | 113.1 | 3,428 |
| Vanguard Total Stock Market ETF | VTI US | 96,423 | 297.2 | 3,344 |
| Vanguard Value ETF | VTV US | 38,709 | 192.3 | 3,078 |
| Schwab International Equity ETF | SCHF US | 15,671 | 92.6 | 2,644 |
| Schwab US TIPS ETF | SCHP US | 5,440 | 42.8 | 2,566 |
| PowerShares QQQ | QQQ US | 65,895 | 6,504.1 | 2,344 |
| iShares Core MSCI Total International Stock ETF | IXUS US | 10,182 | 41.6 | 2,342 |
Similarly, the top 10 ETPs by net new assets collectively gathered $8.19 Bn by the end of June 2018.
Top 10 ETPs by net new assets June 2018: Global
| Name | Ticker | Assets (US$ Mn) Jun-18 |
ADV (US$ Mn) Jun-18 |
NNA (US$ Mn) YTD 2018 |
| Xtrackers Physical Gold ETC (EUR) | XAD5 GY | 2,239 | 2.5 | 1,648 |
| Barclays ETN+ FI Enhanced Global High Yield Exchange Traded Notes Series B | FIYY US | 1,497 | 0.5 | 1,310 |
| ProShares Short VIX Short-Term Futures | SVXY US | 528 | 164.0 | 1,185 |
| iShares Gold Trust | IAU US | 10,799 | 163.4 | 1,129 |
| Barclays ETN+ FI Enhanced Europe 50 Exchange Traded Notes Series C | FFEU US | 669 | 2.8 | 687 |
| VelocityShares Daily Inverse VIX Short Term ETN | XIV US | – | – | 654 |
| PowerShares DB Commodity Index Tracking Fund | DBC US | 3,015 | 49.9 | 596 |
| Credit Suisse FI Enhanced Europe 50 ETNs | FEUL US | 314 | 4.3 | 351 |
| VelocityShares Daily 2x VIX Short Term ETN | TVIX US | 556 | 406.7 | 338 |
| iPath Bloomberg Commodity Index Total Return ETN | DJP US | 1,217 | 9.8 | 294 |

