
Key highlights for February 2019:
Q4 hedge fund letters, conference, scoops etc
- The Eurekahedge Hedge Fund Index gained 0.89% in February, bringing its year-to-date return to 3.26%. The risk-on sentiment among investors driven by the Fed’s patient stance and optimism over the potential resolution of the US-China trade tension persisted through the month, sending global equity markets on a rally through February.
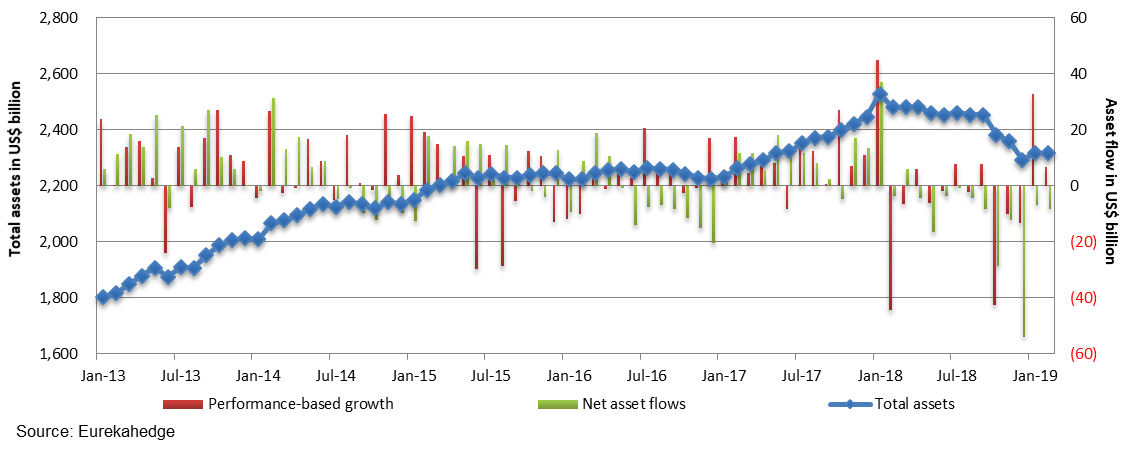
- The global hedge fund industry saw performance growth totalling US$39.5 billion over the first two months of 2019, supported by the global equity market performance since the beginning of the year. Despite the positive performance figures, net investor redemptions stood at US$15.1 billion over the same period.
- The Eurekahedge Fixed Income Hedge Fund Index gained 0.61% in February, as growth forecast cuts among the developed economies led to lower bond yields, resulting in strength in the government and high-yield bond markets. The fixed income strategic mandate was up 2.29% year-to-date, with all of its underlying mandates in positive territory.
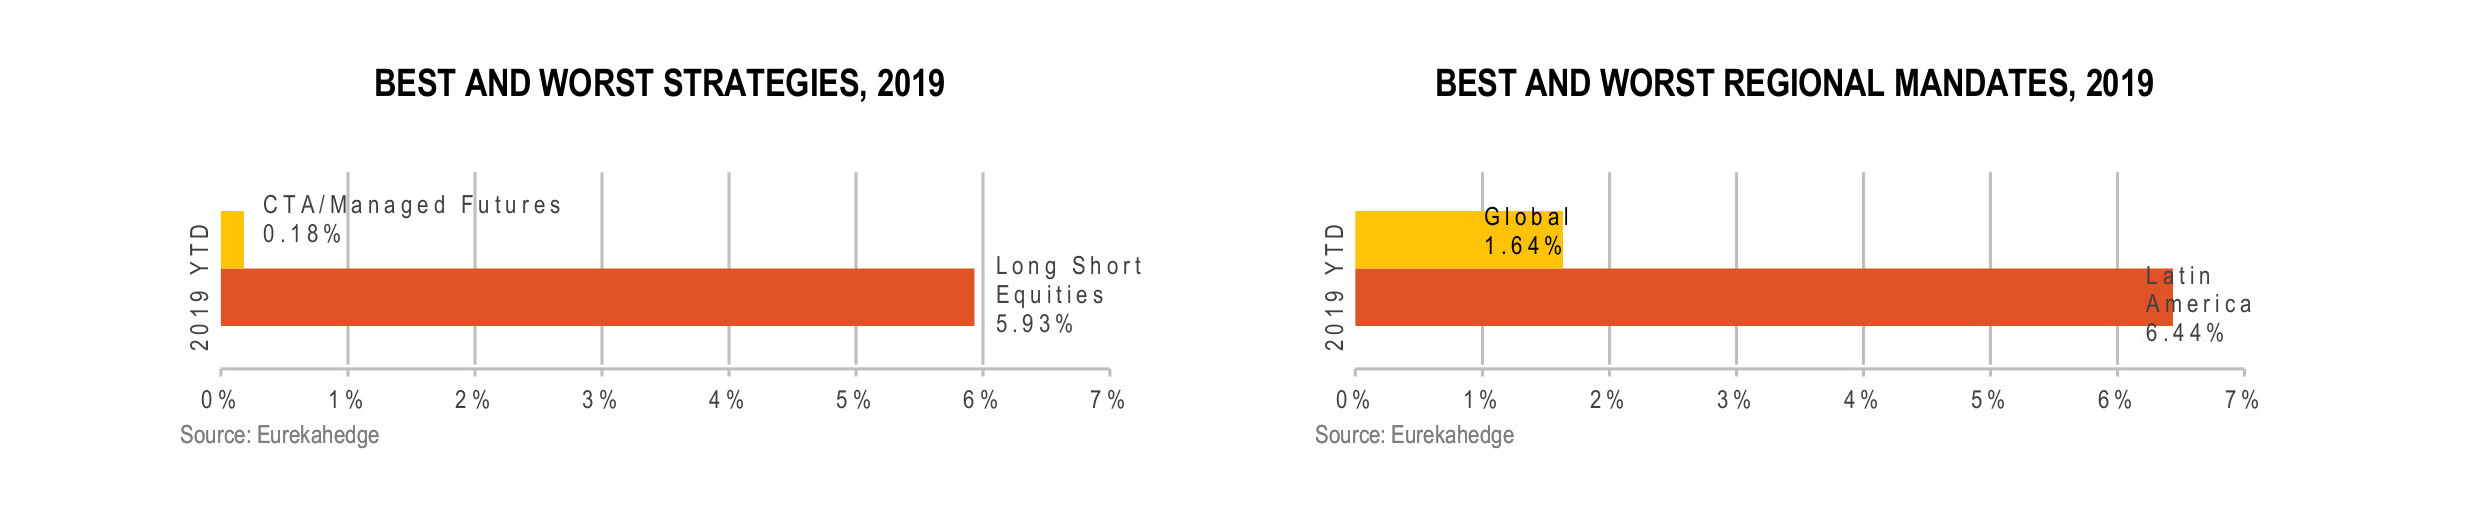
- Hedge fund managers utilising CTA/managed futures strategies were up 0.37% in February, with mixed returns among the underlying regional mandates. Rising oil prices resulting from the OPEC’s production cut and a drop in the US crude supplies contributed to the strategy’s performance during the month. On a year-to-date basis, the Eurekahedge CTA/Managed Futures Hedge Fund Index was up a meagre 0.16%.
- Fund managers utilising AI/machine learning strategies were down 0.32% in February, dragging their year-to-date returns to 2.02%. Quant strategies continued to fall out of investors’ favour, with the CTA/managed futures mandate seeing investor redemptions totalling US$29.0 billion in 2018 and US$4.0 billion as of February 2019 year-to-date.
- The Eurekahedge Crypto-Currency Hedge Fund Index gained 12.74% in February, recording its best month in nearly a year. Roughly half of the underlying crypto-currency hedge funds managed to outperform Bitcoin which gained 9.65% during the month.
- The Eurekahedge Greater China Long Short Equities Hedge Fund Index was up 8.31% over the first two months of 2019, supported by the underlying region’s equity market rally which resulted from investor optimism over the US-China trade negotiations and the Fed’s dovish stance.
- The Greater China hedge fund industry’s asset currently stands at US$28.7 billion, marginally up from the US$28.0 billion figure by the end of 2018. Hedge fund managers focusing on the region were hit particularly hard by the aggressive Fed rate hikes and the US-China trade friction in 2018, as indicated by the US$2.3 billion of performance-based losses recorded during the year. Despite that, investor allocations toward the region remained robust, as the industry saw US$1.0 billion of net inflows in 2018.
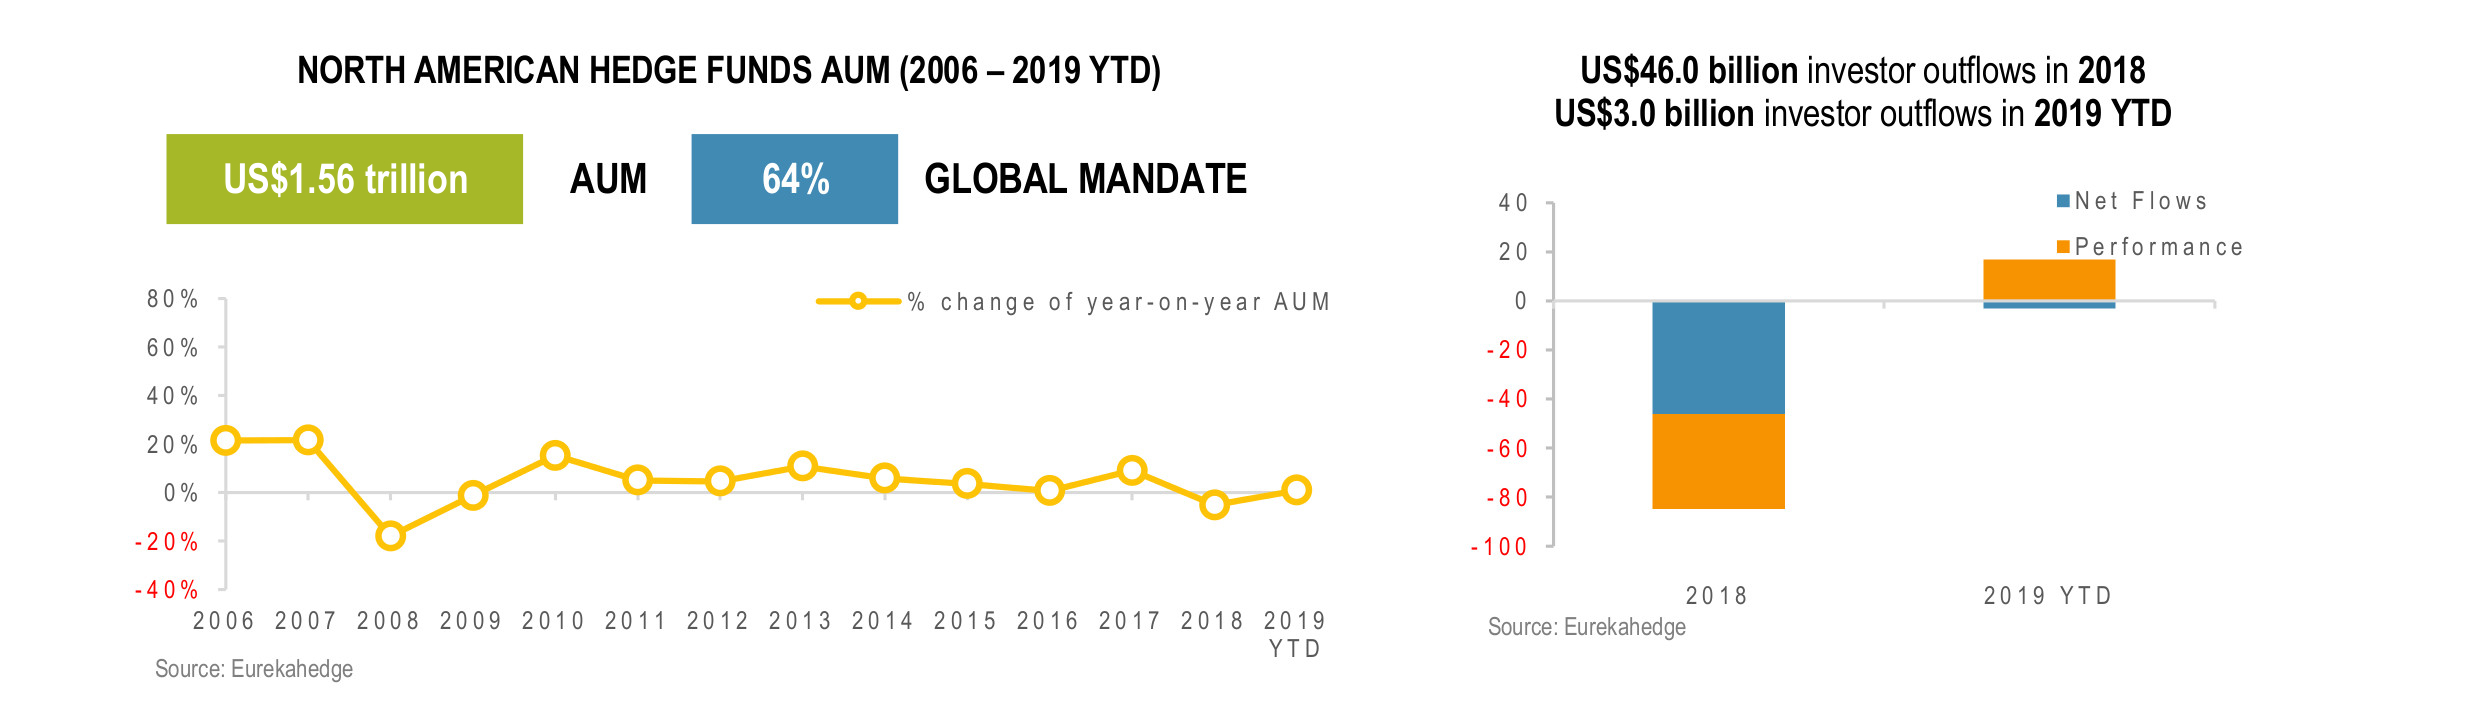
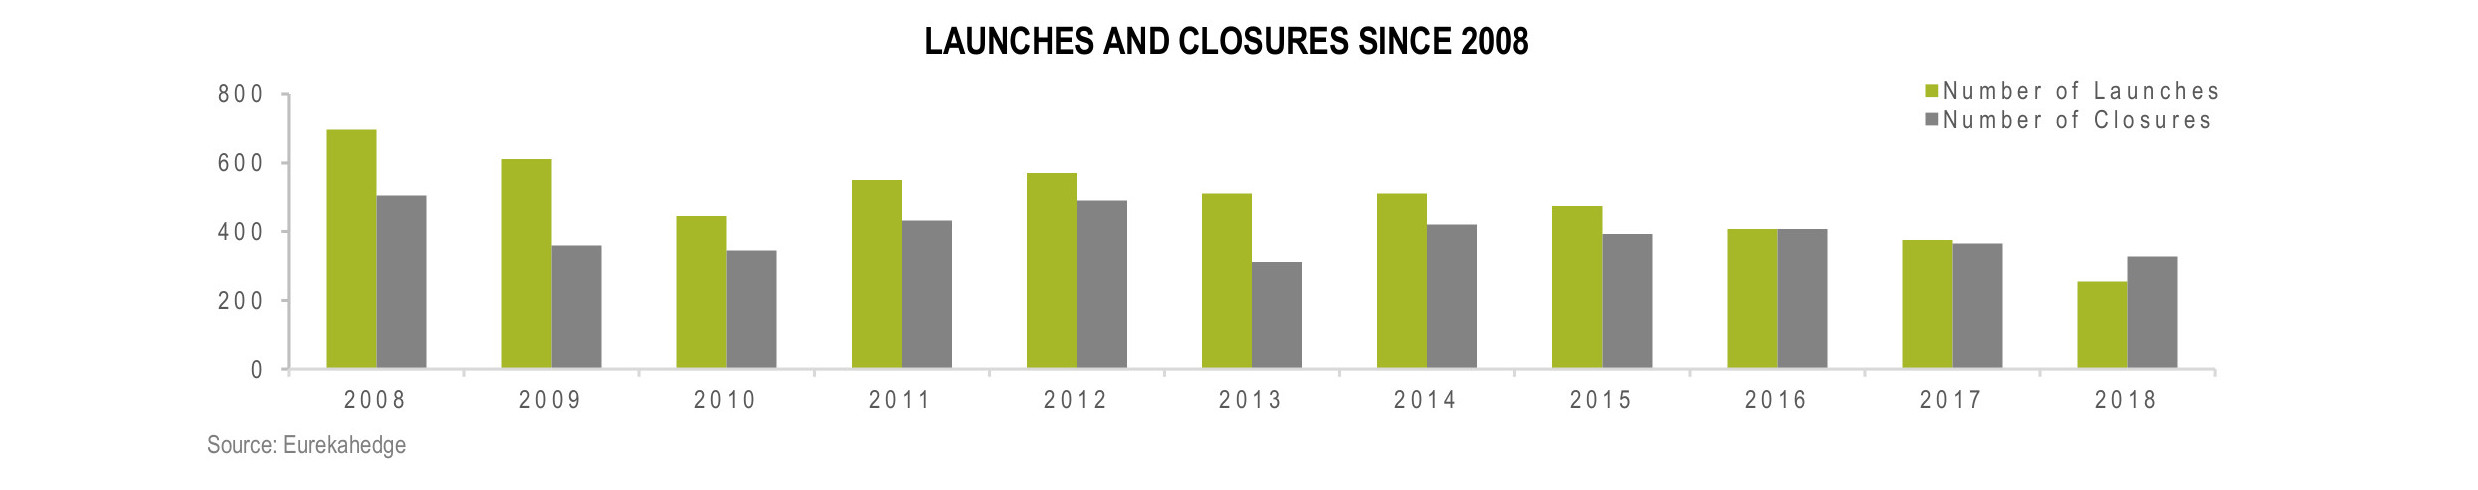
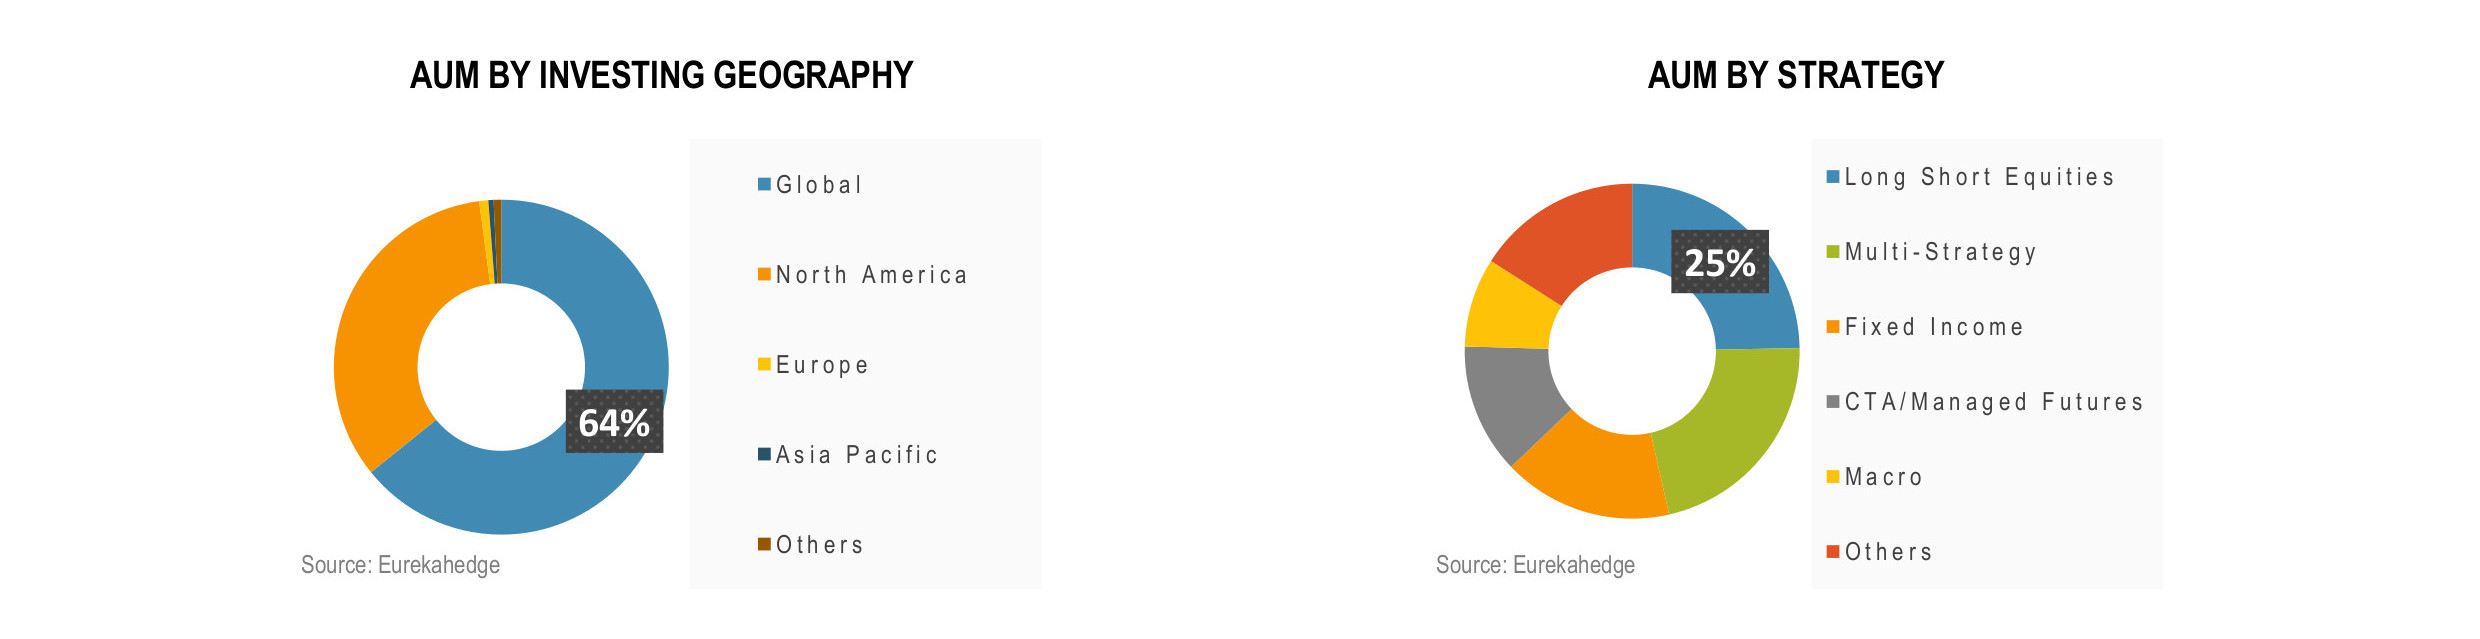
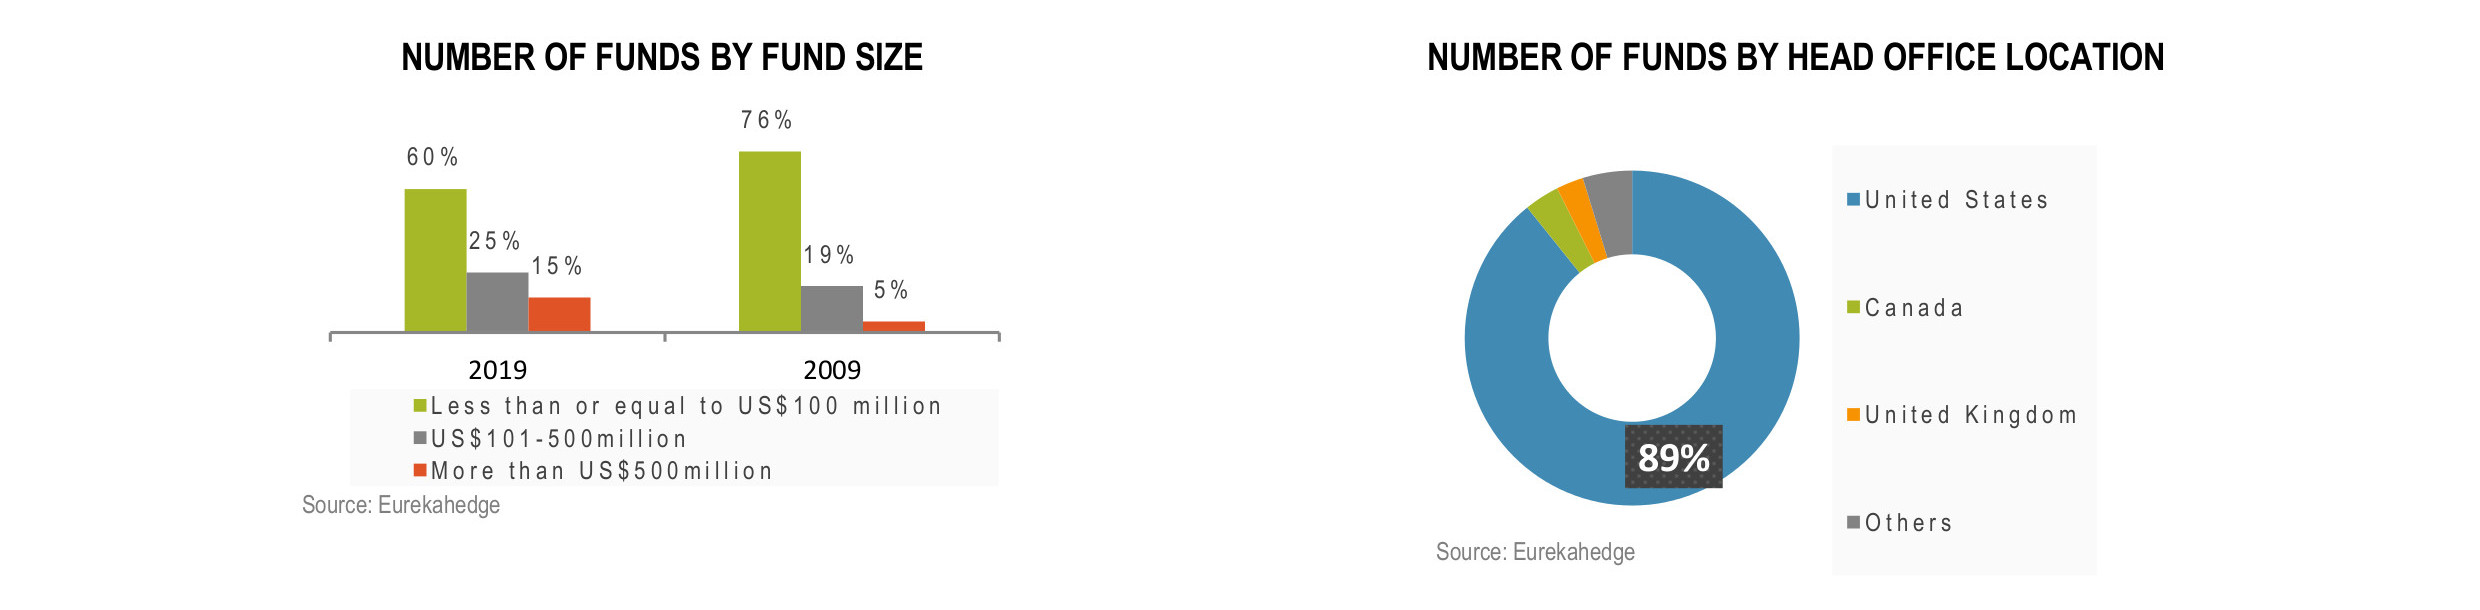
2018 Overview: Key Trends in North American Hedge Funds
The Eurekahedge Hedge Fund Index gained 0.89% in February bringing its year-to-date return to 3.26%. The risk-on sentiment among investors driven by the Fed’s patient stance and optimism over the potential resolution of the US-China trade tension persisted through the month, sending global equity markets on a rally through February. The MSCI AC World Index (Local) gained 3.03% during the month, resulting in 10.61% year-to-date return over the first two months of 2019. On the other hand, growth forecast cuts from developed economies’ central banks raised concerns over lower inflation, sending bond yields lower throughout the month.
Approximately 65.6% of the hedge fund managers tracked by Eurekahedge posted positive returns in February, and 12.8% of them managed to generate double-digit gains year-to-date. Managers utilising event driven and long/short equities strategies were best positioned to benefit from the upward movement in both equity and bond markets throughout January and February. The two strategic mandates were up 5.20% and 5.11% respectively as of 2019 year-to-date. On the other hand, CTA/managed futures hedge funds were up 0.16% despite the strong recovery seen in energy and industrial metal sectors over the past two months.
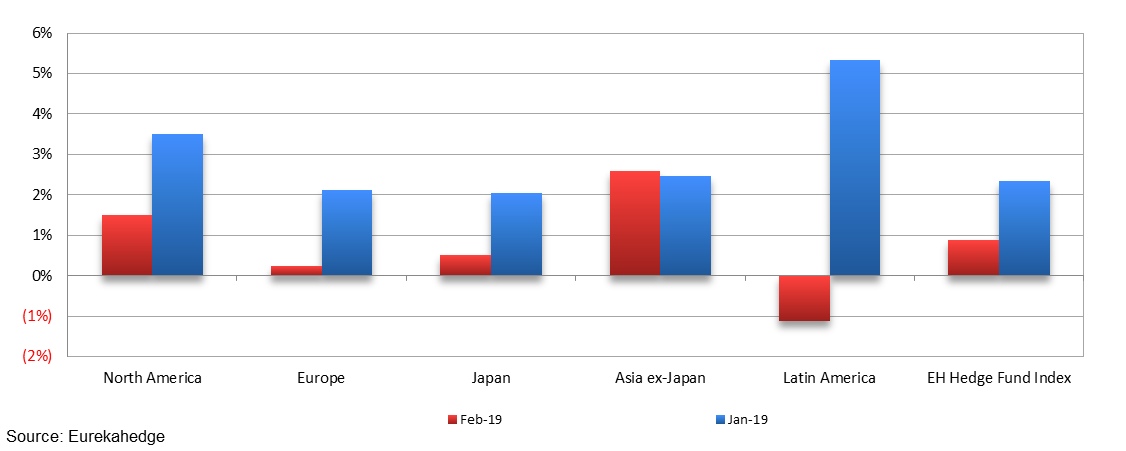
Most of the major geographic mandates were up in February, with Asia ex-Japan and North American managers gaining 2.60% and 1.50% respectively. Latin American fund managers on the other hand dipped 1.13%, as the region’s equity markets slumped due to weak GDP growth.
February 2019 and January 2019 returns across regions
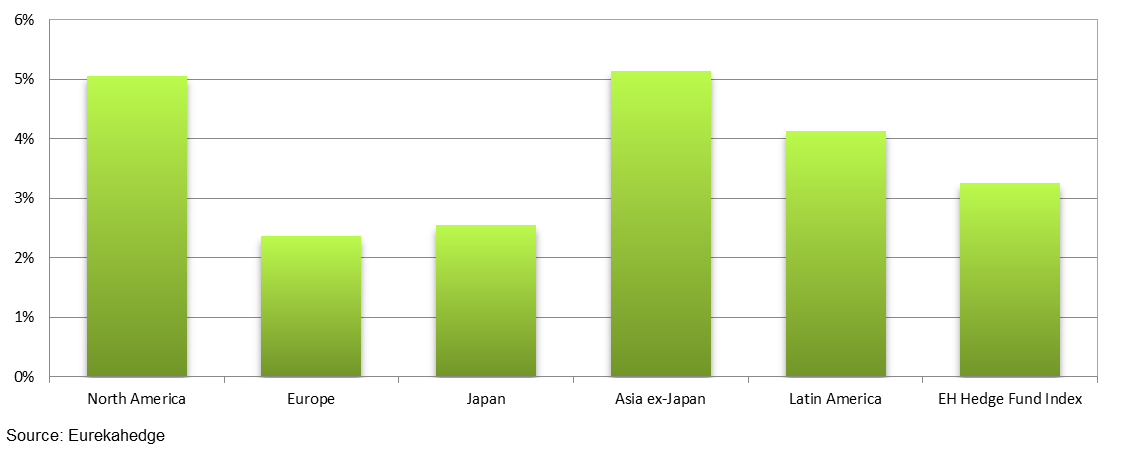
Looking at year-to-date returns, Asia ex-Japan and North America mandates posted the strongest return thanks to the underlying equity markets’ performance during the month. The two mandates were up 5.14% and 5.05% respectively as of February 2019. Meanwhile, Europe and Japan lagged behind as slowing growth concerns weighed on fund managers’ returns.
2018 year-to-date returns across regions
Mizuho-Eurekahedge Asset Weighted Index
The asset-weighted Mizuho-Eurekahedge Index – USD gained 0.32% in February, after ending 2018 down 4.29%. It should also be noted that the Mizuho-Eurekahedge Index is US dollar denominated, and during months of strong US dollar gains, the index results include the currency conversion loss for funds that are denominated in other currencies.
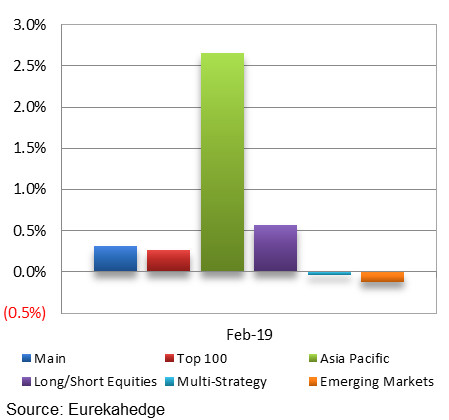
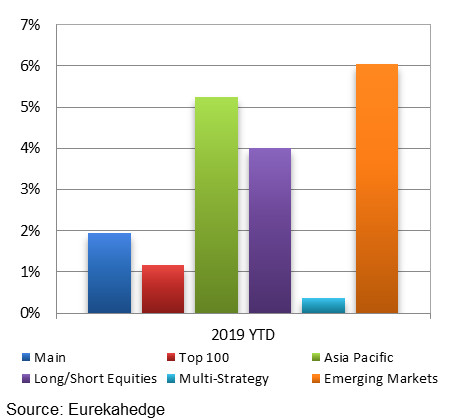
Most of the Mizuho-Eurekahedge indices posted positive returns in February, with the Mizuho-Eurekahedge Asia Pacific Index gaining 2.66% over the month, supported by the strength in the underlying region’s equity markets. In terms of year-to-date return, all Mizuho-Eurekahedge indices were in positive territory, with emerging markets and Asia Pacific managers posting the strongest returns of 6.05% and 5.24% respectively as of February 2019, as the two regions reacted positively to the Fed’s wait-and-see stance in raising rates.
|
Mizuho-Eurekahedge Indices February 2019 returns
|
Mizuho-Eurekahedge Indices 2019 year-to-date returns
|
CBOE Eurekahedge Volatility Indexes
The CBOE Eurekahedge Volatility Indexes comprise four equally-weighted volatility indices – long volatility, short volatility, relative value and tail risk. The CBOE Eurekahedge Long Volatility Index is designed to track the performance of underlying hedge fund managers who take a net long view on implied volatility with a goal of positive absolute return. In contrast, the CBOE Eurekahedge Short Volatility Index tracks the performance of underlying hedge fund managers who take a net short view on implied volatility with a goal of positive absolute return. This strategy often involves the selling of options to take advantage of the discrepancies in current implied volatility versus expectations of subsequent implied or realised volatility. The CBOE Eurekahedge Relative Value Volatility Index on the other hand measures the performance of underlying hedge fund managers that trade relative value or opportunistic volatility strategies. Managers utilising this strategy can pursue long, short or neutral views on volatility with a goal of positive absolute return. Meanwhile, the CBOE Eurekahedge Tail Risk Index tracks the performance of underlying hedge fund managers that specifically seek to achieve capital appreciation during periods of extreme market stress.
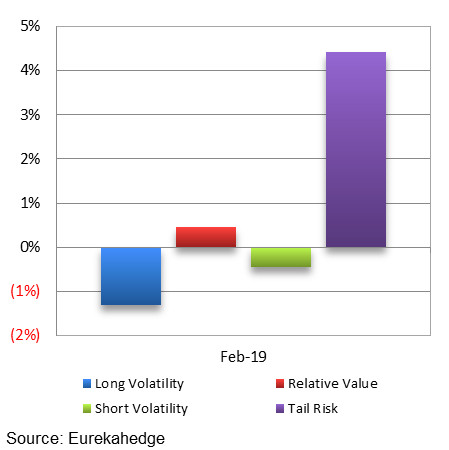
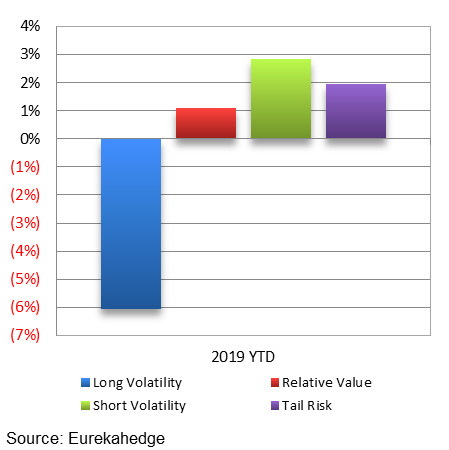
Returns were mixed among the CBOE Eurekahedge indices, with the CBOE Eurekahedge Long Volatility Hedge Fund Index down 1.30% amidst the risk-on sentiment in the market during the month. Hedge fund managers utilising relative value volatility strategies gained 0.46% in February, trailing behind their peers utilising tail risk strategies who returned 4.43% over the month. On a year-to-date basis, long volatility hedge fund managers were down 6.07%.
|
CBOE Eurekahedge Volatility Indexes February 2019 returns
|
CBOE Eurekahedge Volatility Indexes 2019 year-to-date returns
|
Summary monthly asset flow data since January 2013
Eurekahedge
Launched in 2001, Eurekahedge has a proven track record spanning over 16 years as the world’s largest independent data provider and alternative research firm specialising in global hedge fund databases and research. Headquartered in Singapore with offices in New York and Philippines, the global expertise of our research team constantly adapts to industry changes and needs, allowing Eurekahedge to develop and offer a wide array of products and services coveted by institutional investors, family offices, accredited investors, qualified purchasers, financial institutions and media sources. In addition to market-leading hedge fund databases, Eurekahedge’s other business functions include hedge fund research publications, due diligence services, investor services, analytical platforms and risk management tools.

