
Key highlights for March:
Q1 2020 hedge fund letters, conferences and more
- The Eurekahedge Hedge Fund Index registered its strongest outperformance relative to underlying markets since October 2008, outperforming the MSCI AC World Index by 9.22% in March.
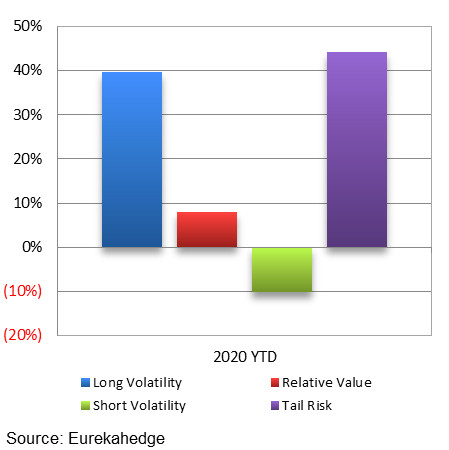
- Long volatility and tail risk hedge funds topped the performance tables for Q1 2020, outshining other strategies as market volatility level remained elevated during the past two months. The CBOE Eurekahedge Long Volatility Hedge Fund Index and the CBOE Eurekahedge Tail Risk Hedge Fund Index have returned 39.70% and 44.29% respectively over the first quarter of the year.
- The Eurekahedge AI Hedge Fund Index gained 0.27% in March, ending the quarter up 0.02%. On a similar note, the Eurekahedge Trade Finance Hedge Fund Index and the Eurekahedge ILS Advisers Index have also recorded gains over the first quarter, with the two indices returning 0.27% and 0.40% respectively as of March 2020 year-to-date.
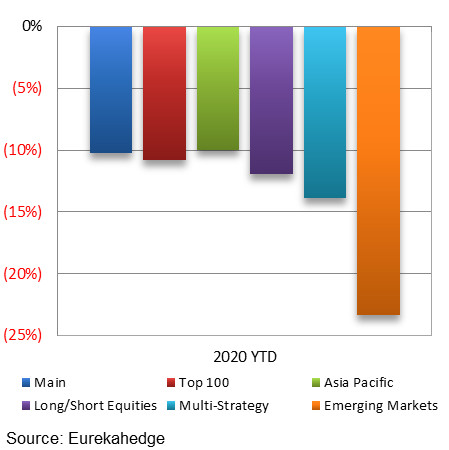
- The asset-weighted Mizuho-Eurekahedge Emerging Index – USD ended March down 19.03%, recording its worst month since the inception of the index. Fund managers focusing on Asia ex-Japan and Latin America have witnessed a total of US$6.7 billion net investor redemptions year-to-date.
- The Eurekahedge UCITS Hedge Fund Index was down 8.51% in March, underperforming non-UCITS hedge funds which were down 3.92% on average during the month. The US$209.4 billion UCITS hedge fund industry has seen US$14.6 billion of performance-driven losses and US$10.1 billion of net investor outflows over the first quarter of 2020.
- The Eurekahedge North American Long Short Equities Hedge Fund Index declined 7.26% in March, weighed by the weak US equity market performance during the month. Underlying constituents for the index have outperformed the S&P 500 Index by 8.62% as of March 2020 year-to-date.
- The Eurekahedge Greater China Long Short Equities Hedge Fund Index was down 6.92% in March, outperforming the Hang Seng Index by 2.75%. On a year-to-date basis, the Greater China hedge fund industry has seen its AUM decline from US$30.4 billion to US$30.2 billion.
- The Eurekahedge Fixed Income Hedge Fund Index was down 8.49% in March as the increase in default rates and lower credit ratings resulted in the weak performance of high yield bonds. The strategic mandate witnessed US$5.0 billion of performance decline and US$3.5 billion of net outflows throughout March.
- Preliminary data showed that hedge fund managers focusing on structured credit were down 24.50% in March as fund managers suffer substantial losses from illiquid bond holdings and investor redemption pressure. The Eurekahedge Structured Credit Hedge Fund Index has plummeted 25.32% year-to-date, recording its worst quarter since inception.
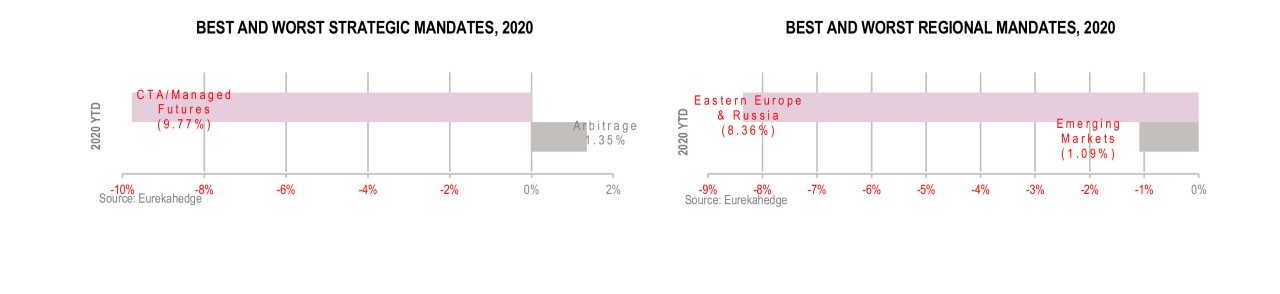
- The Eurekahedge Eastern Europe & Russia Hedge Fund Index was down 18.59% in March, ending the first quarter of 2020 losing 25.31%. Failed negotiations between OPEC and Russia exerted significant pressure on economies reliant on the energy sector.
- The Eurekahedge Billion Dollar Hedge Fund Index was down 4.99% in March, bringing its year-to-date loss to 5.93%. Hedge funds overseeing in excess of US$1 billion in assets have come under redemption pressure in recent months, with US$31.8 billion of net outflows recorded through Q1 2020.
- Hedge fund managers utilising equity long bias, event driven and distressed debt strategies were down 18.68%, 13.50%, and 11.04% respectively as of March 2020 year-to-date, ending the first quarter of the year at the bottom of the performance table. Equity market sell-offs, weak M&A activities and strained corporate debt market weighed heavily on the performance of these strategies in recent months.
Key Trends in European Hedge Funds
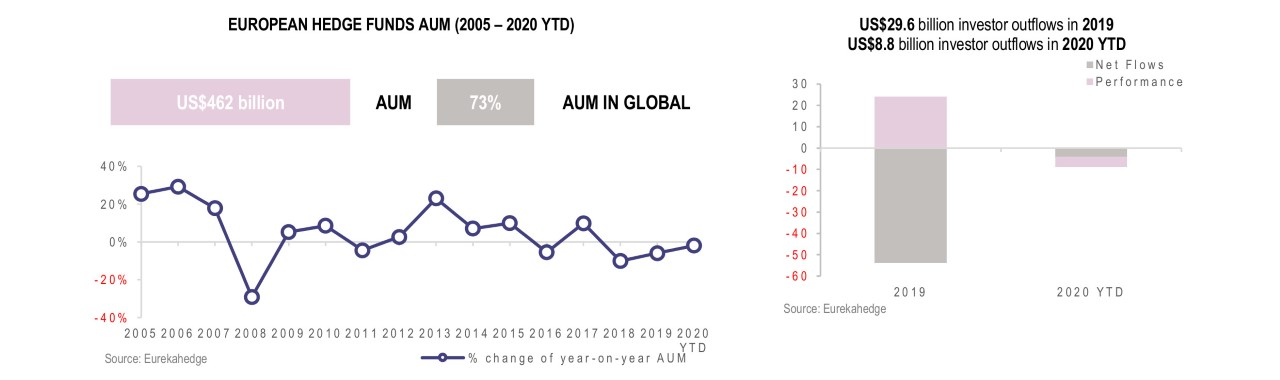
The Eurekahedge Hedge Fund Index was down 4.77% in March , outperforming the underlying equity market as represented by the MSCI ACWI IMI (Local), which lost 13.99% over the month. Global equities were under pressure from the market sell-offs throughout most of the month, before recouping some of their losses later on. The COVID-19 outbreak continued to worsen globally, with the United States overtaking China as the country with the highest number of confirmed cases. US authorities were forced to implement stringent social distancing measures in an attempt to flatten the outbreak curve, resulting in increasing unemployment rate and slowing economic growth as businesses deemed non-essential were forced to temporarily cease their operations. Stimulus packages and an emergency rate cut were implemented during the month, with the aim of supporting the economy and increasing market liquidity. The US equity benchmarks recorded their worst quarterly performance since 1987, as they ended the month of March with double-digit losses – the DJIA and S&P 500 were down 13.74% and 12.51% respectively. In the same vein, European equities performed poorly as the coronavirus outbreak situations worsened in the region, turning it into the new epicentre of the pandemic. The CAC 40 and the DAX plummeted 18.01% and 16.44% respectively throughout the month of March. On the other hand, Chinese equity markets outperformed other regions as Mainland China is on track to ease its months-long lockdown. The Shenzhen and Shanghai Composite indices were down 7.54% and 4.51% respectively in March. Contrary to the relative underperformance of the region’s equity market, fund managers focusing on North America were down 4.91%, topping their Asia ex-Japan and European peers who were down 8.44% and 6.48% respectively over the month.
Approximately 31.6 % of the underlying constituents of the Eurekahedge Hedge Fund Index posted positive returns in March, and 10.3% of the fund managers in the database were able to generate double-digit returns over the first three months of 2020. Preliminary estimates showed that 81.8% of the hedge fund managers were able to outperform the global equity market in March, exemplifying the downside protection afforded by hedged strategies as opposed to long-only portfolios.
March 2020 and February 2020 returns across regions
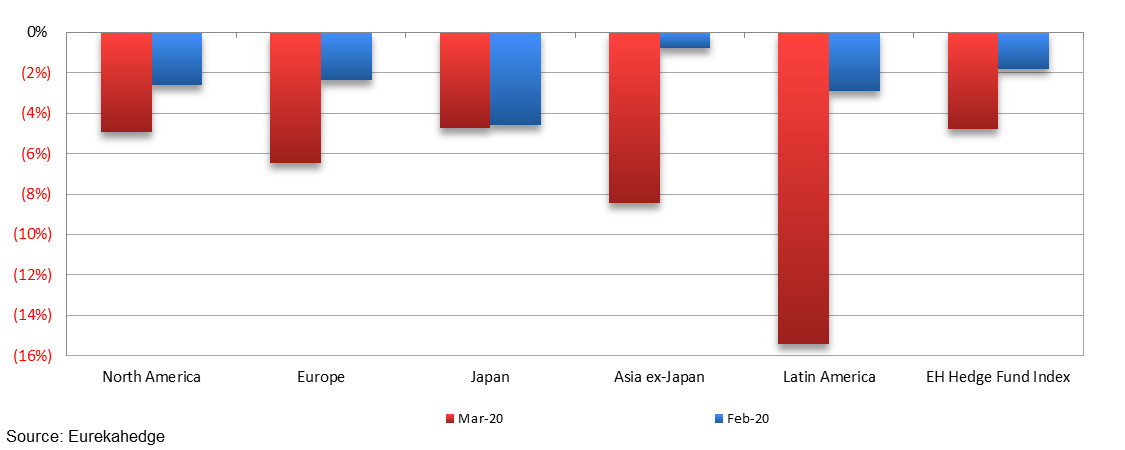
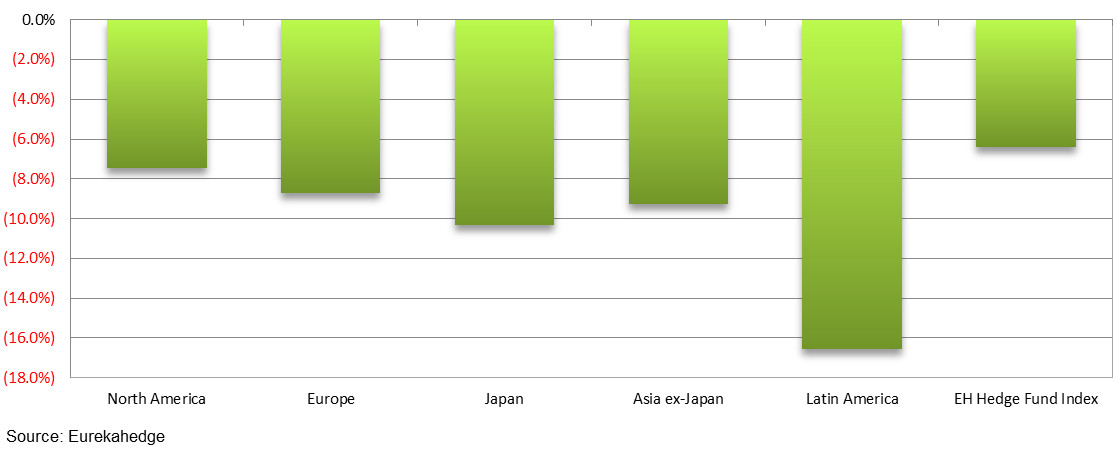
The figure below illustrates the 2020 performance of hedge fund managers across regions. All regional mandates were down for the year, despite the positive geopolitical development surrounding the US-China trade negotiations in January. The escalation of the COVID-19 outbreak resulted in the weak performance of fund managers throughout the quarter. North American hedge funds led the pack with 7.48% loss over the first quarter of 2020, outperforming their peers focusing on Europe and Asia ex-Japan which slumped 8.69% and 9.29% respectively over the same period.
2019 returns across regions
Mizuho-Eurekahedge Asset Weighted Index
The asset-weighted Mizuho-Eurekahedge Index – USD was down 7.78% in March as weak equity market performance and strong US dollar weighed on the index performance. It should also be noted that the Mizuho-Eurekahedge Index is US dollar denominated, and during months of strong US dollar gains, the index results include the currency conversion loss for funds that are denominated in other currencies. The Mizuho Eurekahedge Index – USD is down 10.22% over the first quarter of 2020, recording its weakest quarter post-crisis.
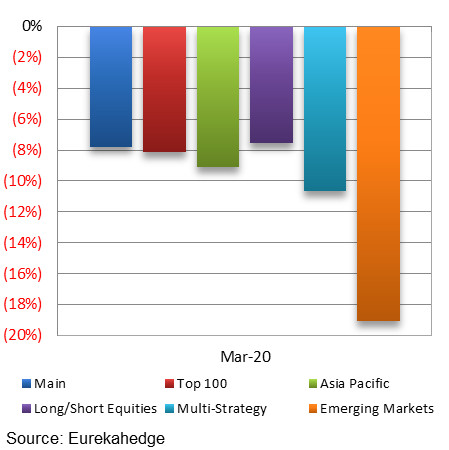
All of the Mizuho-Eurekahedge indices were down in March, with the Mizuho-Eurekahedge Emerging Markets Index posting the steepest loss of 19.03% as the COVID-19 outbreak situation continued to worsen throughout the month. The underlying long/short equities and multi-strategy mandates of the index suite were also down 7.53% and 10.66% respectively in March.
| Mizuho-Eurekahedge Indices March 2020 returns
|
Mizuho-Eurekahedge Indices 2020 returns
|
CBOE Eurekahedge Volatility Indexes
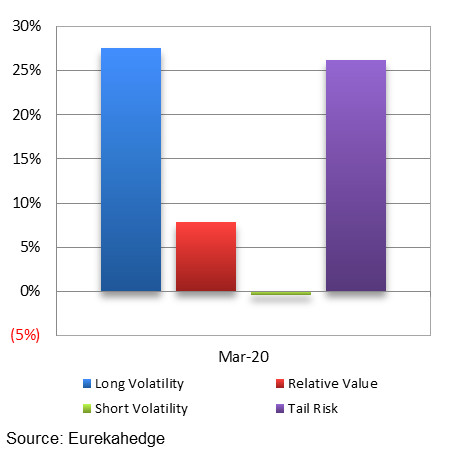
The CBOE Eurekahedge Volatility Indexes comprise four equally-weighted volatility indices – long volatility, short volatility, relative value and tail risk. The CBOE Eurekahedge Long Volatility Index is designed to track the performance of underlying hedge fund managers who take a net long view on implied volatility with a goal of positive absolute return. In contrast, the CBOE Eurekahedge Short Volatility Index tracks the performance of underlying hedge fund managers who take a net short view on implied volatility with a goal of positive absolute return. This strategy often involves the selling of options to take advantage of the discrepancies in current implied volatility versus expectations of subsequent implied or realised volatility. The CBOE Eurekahedge Relative Value Volatility Index on the other hand measures the performance of underlying hedge fund managers that trade relative value or opportunistic volatility strategies. Managers utilising this strategy can pursue long, short or neutral views on volatility with a goal of positive absolute return. Meanwhile, the CBOE Eurekahedge Tail Risk Index tracks the performance of underlying hedge fund managers that specifically seek to achieve capital appreciation during periods of extreme market stress.
Most of the CBOE Eurekahedge Volatility Indexes ended the month of March up, with the exception of the CBOE Eurekahedge Short Volatility Hedge Fund Index which slumped 0.45%. Tail risk and long volatility hedge funds recorded strong returns of 26.14% and 27.61% respectively, supported by the elevated market volatility level during the month, which pushed the CBOE VIX Index past 80 – a level it has not seen since the global financial crisis in 2008. In terms of year-to-date returns, the CBOE Eurekahedge Tail Risk Volatility Hedge Fund Index topped the chart with their 44.29% return, while the CBOE Eurekahedge Short Volatility Hedge Fund Index was down 10.06%, placing them last among the four volatility strategy categories.
| CBOE Eurekahedge Volatility Indexes March 2020 returns
|
CBOE Eurekahedge Volatility Indexes 2020 returns
|
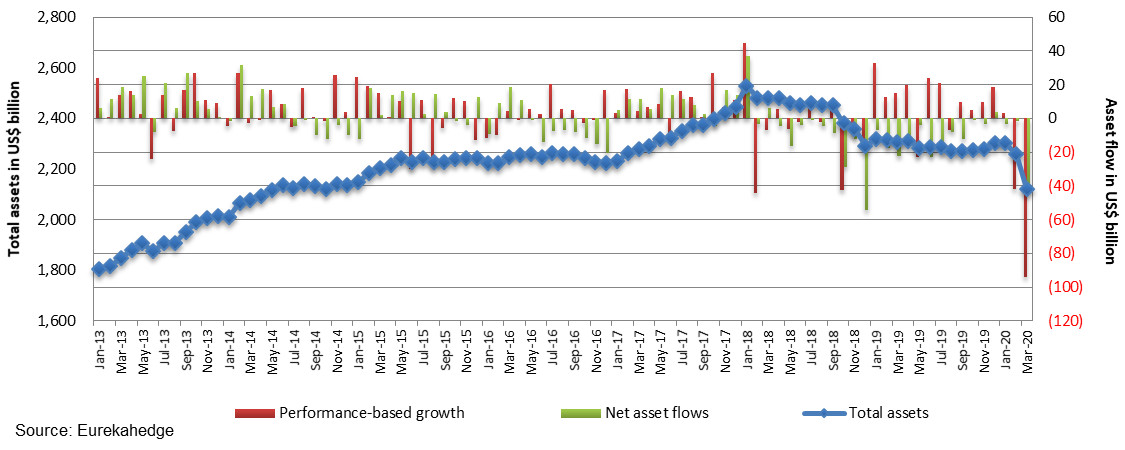
Summary monthly asset flow data since January 2013
About Eurekahedge
Launched in 2001, Eurekahedge has a proven track record spanning over 16 years as the world’s largest independent data provider and alternative research firm specialising in global hedge fund databases and research. The global expertise of our research team constantly adapts to industry changes and needs, allowing Eurekahedge to develop and offer a wide array of products and services coveted by institutional investors, family offices, accredited investors, qualified purchasers, financial institutions and media sources. In addition to market-leading hedge fund databases, Eurekahedge’s other business functions include hedge fund research publications, due diligence services, investor services, analytical platforms and risk management tools.

