
And the Winner is…
[munger]
Q2 hedge fund letters, conference, scoops etc
SUMMARY
- Global factor performance in the first three quarters of 2018 is comparable to 2017
- However, regional factor performance diverges, reflecting changes in monetary and trade policies
- Low Volatility leads and Value lags
Introduction
We present the performance of seven well-known factors on an annual basis for the last 10 years and the first three quarters of 2018. It is worth mentioning that not all factors have strong academic support, e.g. Growth lacks a long-term track record of positive excess returns; however, is still a widely-followed investment style.
Methodology
The factors are created by constructing long-short beta-neutral portfolios of the top and bottom 10% of stocks in the US, Europe and Japan and 20% in smaller markets. Only stocks with a minimum market capitalisation of $1 billion are included. Portfolios rebalance monthly and transactions incur 10 basis points of costs. Please see our Factor Guide for the factor definitions.
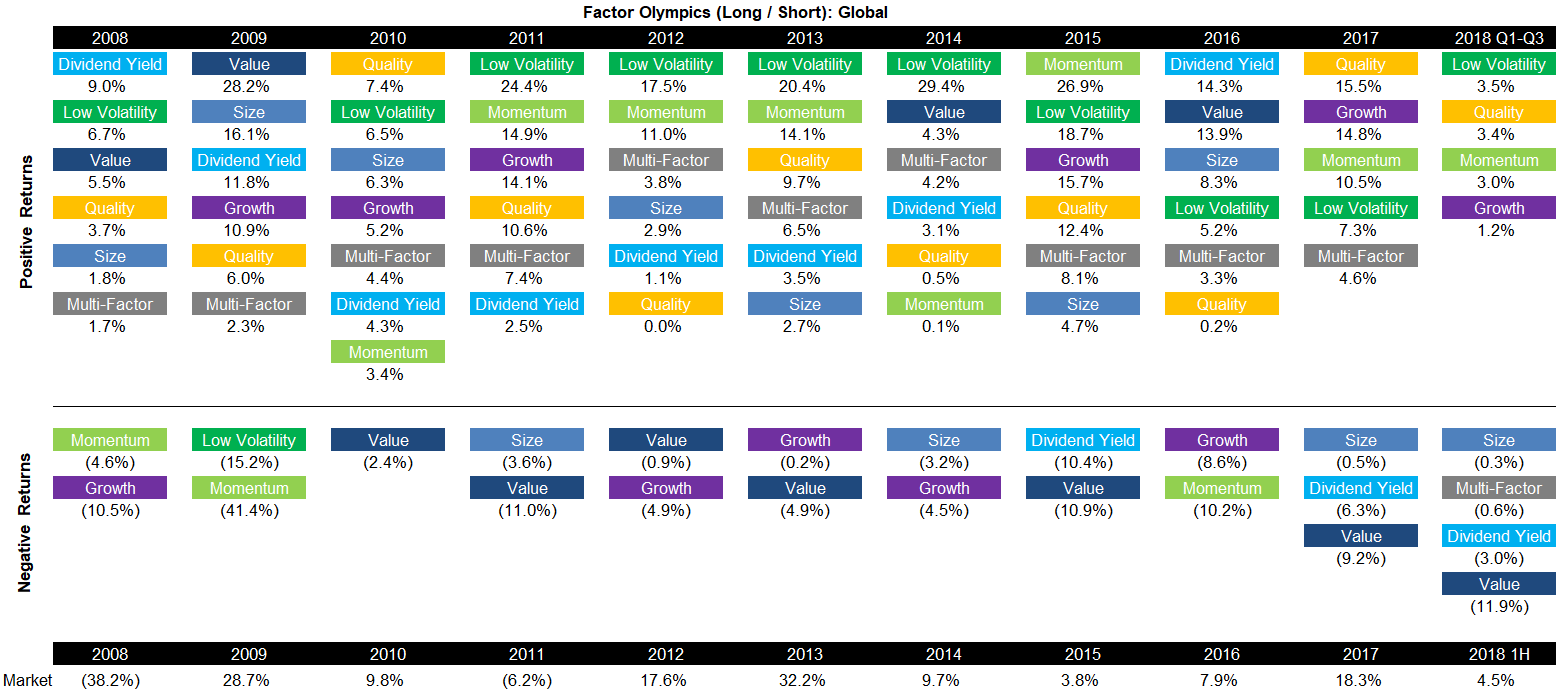
Factor Olympics (Long / Short): Global
The table below shows the factor performance for the last 10 years ranked top to bottom. The global series is comprised of all developed markets in Asia, Europe and the US. Aside from displaying the factor performance the analysis highlights the significant factor rotation in terms of profitability from one year to the next.
The first three quarters of 2018 shows largely a continuation of 2017, i.e. Low Volatility, Quality, Momentum and Growth generated positive returns while Size, Dividend Yield and Value were negative. Factors often exhibit the same trends across markets, but 2018 can be characterized by asynchronous factor performance, which is explained by divergent central bank policies and geopolitical risks.
Source: FactorResearch
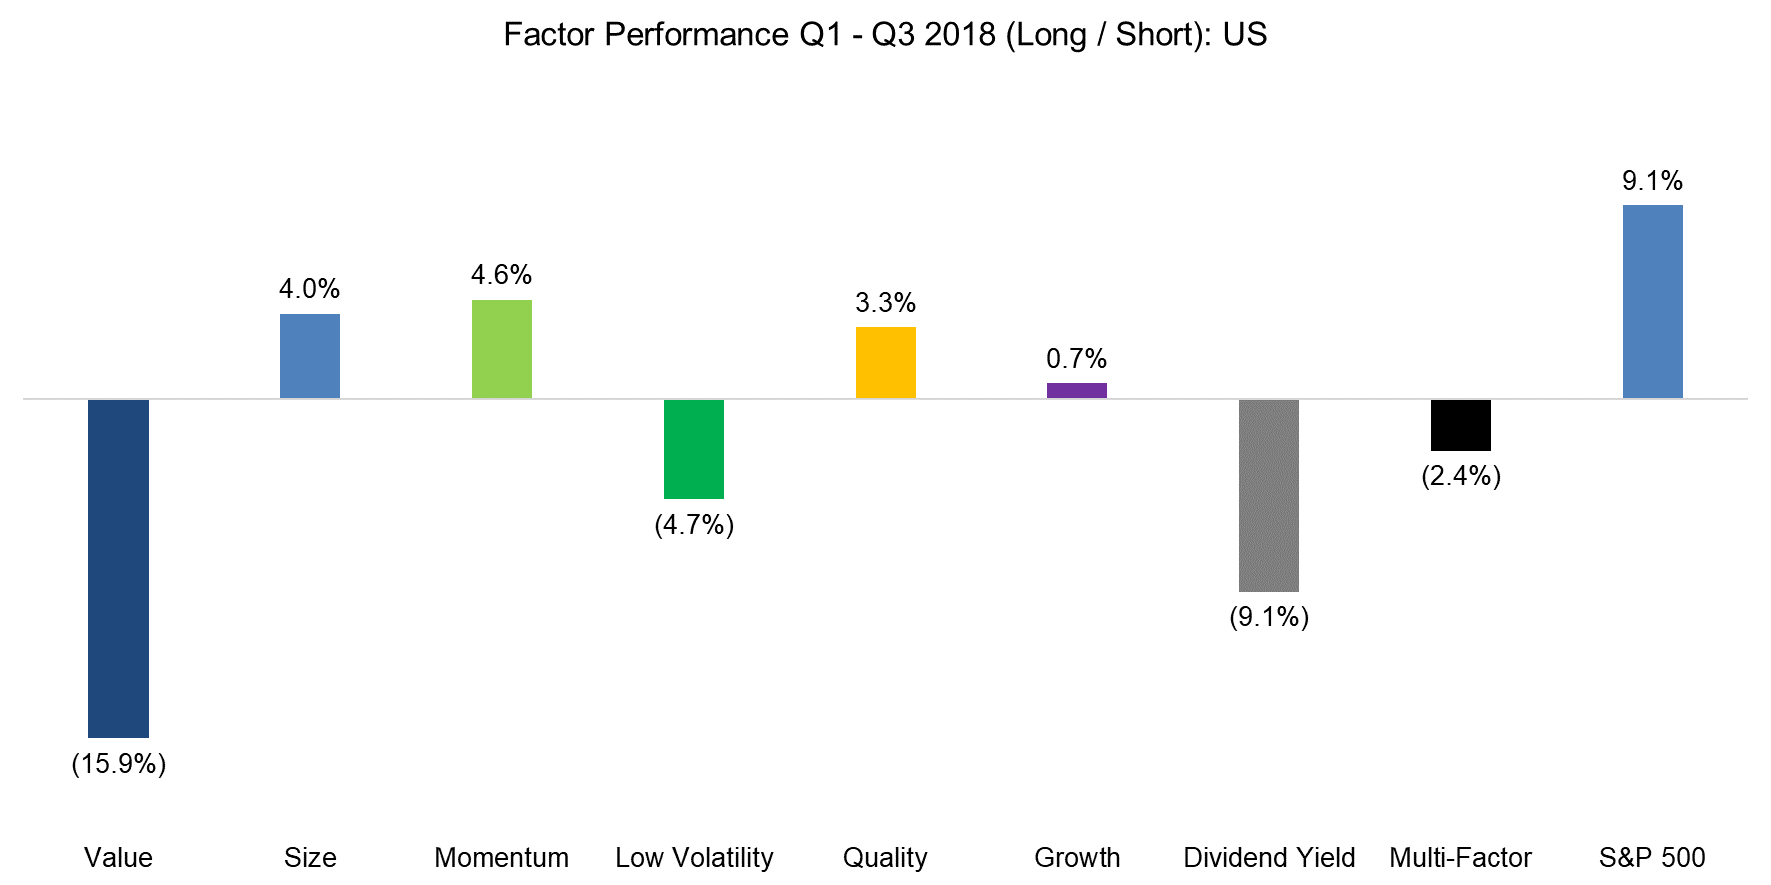
Factor Performance Q1-Q3 2018: US
The table above reflects the global factor performance and it is interesting to analyse how homogeneous the performance is across regions. The global performance is significantly weighted towards the US, so it is not surprising that factor performance in the US is comparable to the global returns.
The factor performance in the first three quarters of 2018 can be partially explained as follows:
- Value: Similar to 2017, investors continue to show a strong preference for growing companies, especially in the Technology sector, and seem to place less emphasis on valuation. The negative performance of the Value factors is reflected in the positive performance of Momentum, Quality and Growth.
- Size: The trade tariffs introduced by the US government have favoured small caps as investors expect these companies to be less affected by a global trade war.
- Low Volatility: The US economy continues to show strong economic growth and low unemployment, which has led to changes in monetary policy and rising interest rates. The Low Volatility factor exhibits interest rate-sensitivity and has therefore been negatively impacted.
Source: FactorResearch
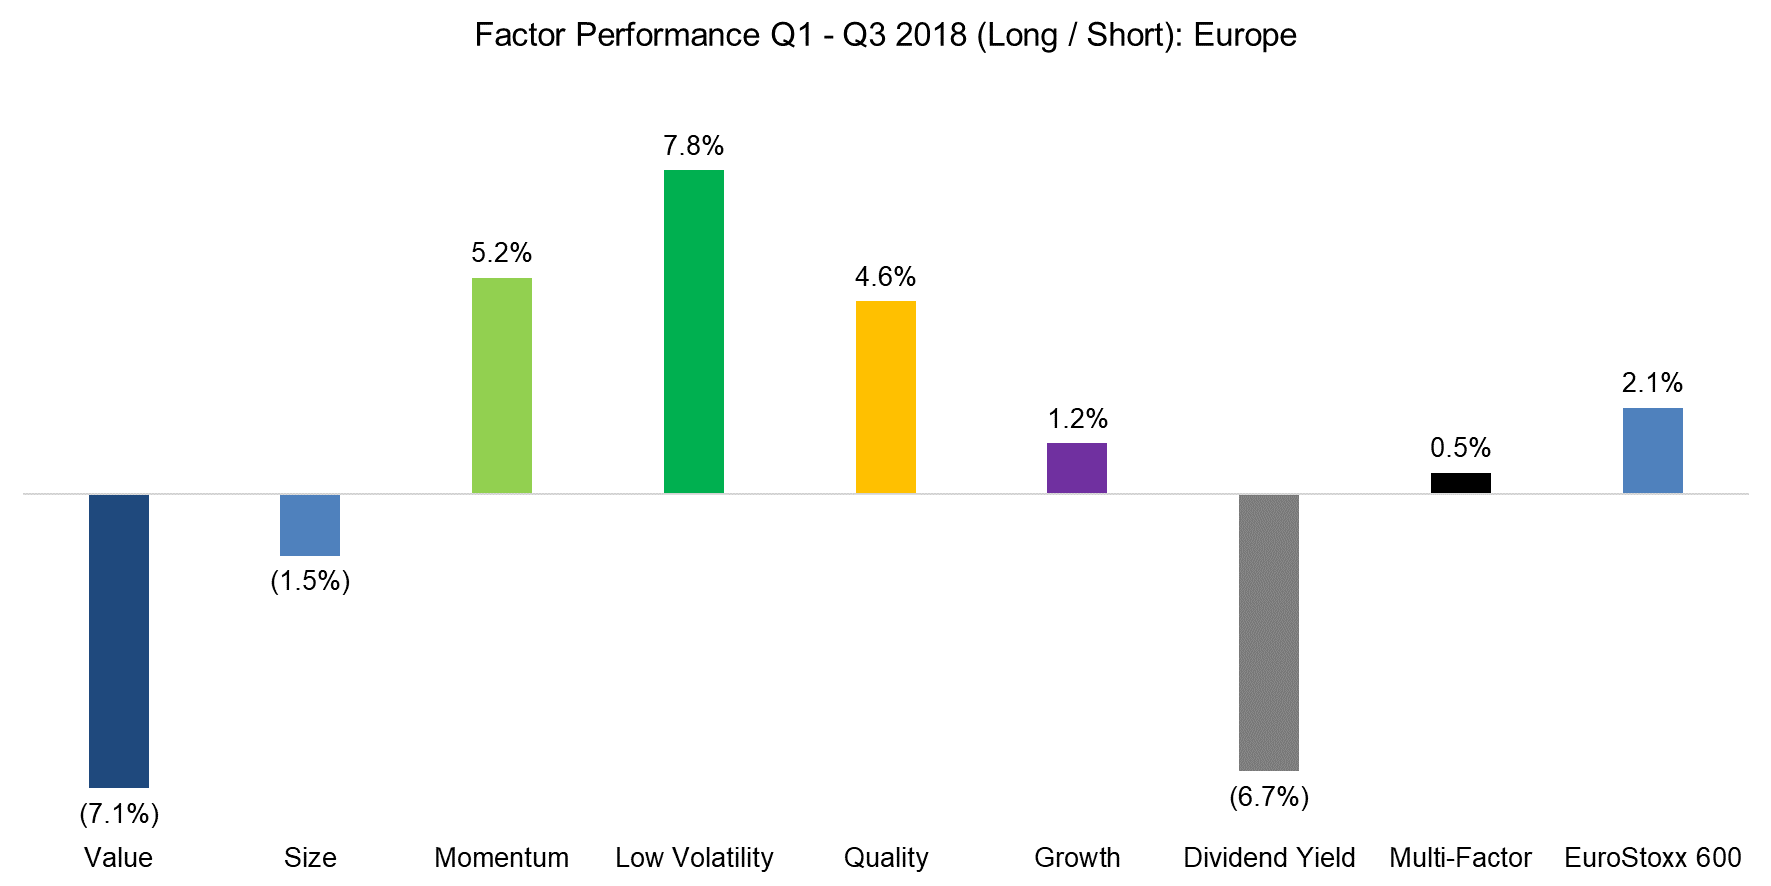
Factor Performance Q1-Q3 2018: Europe
In most years the factor performance in Europe mirrors the US; however, in 2018 there are some divergent trends. The key differences are the following:
- Size: Small cap stocks did not outperform large caps in Europe, which implies that investors anticipate the trade tariffs to have a larger impact on US than on European stocks.
- Low Volatility: While the Low Volatility factor was negative in the US, it was the best performing factor in Europe. The US central bank has started raising interest rates, while the ECB is only moderately changing its monetary policy, which likely explains the difference in performance.
Source: FactorResearch
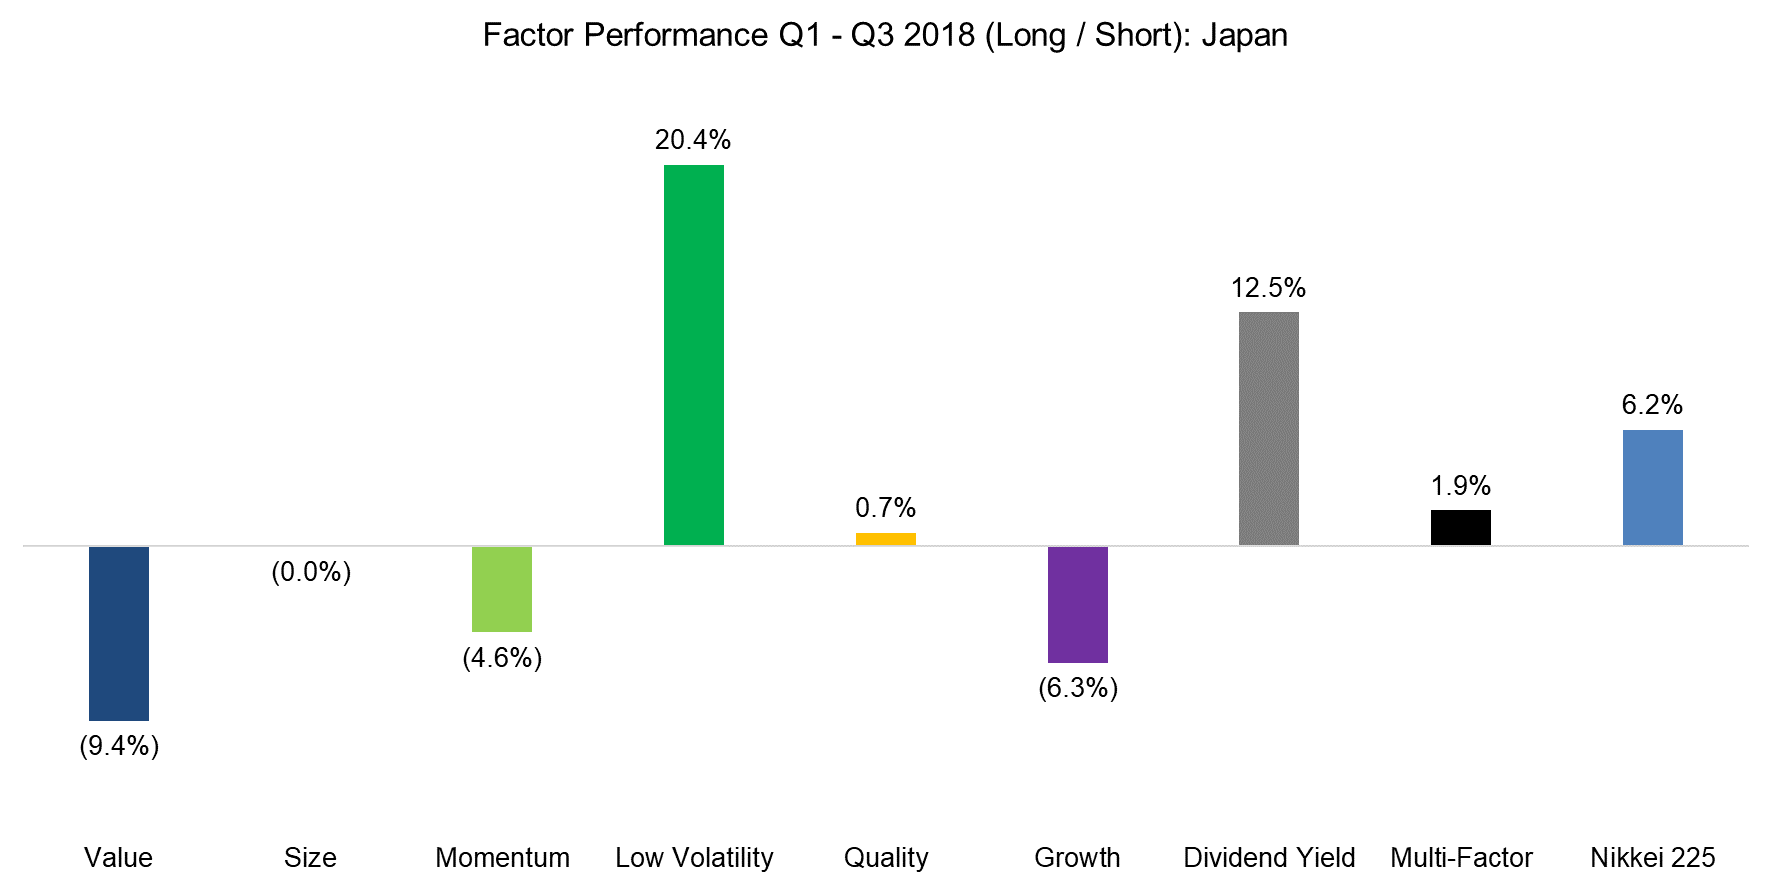
Factor Performance Q1-Q3 2018: Japan
The factor performance in Japan shows even stronger divergent trends to the US performance than Europe. The key differences to both other regions are the following:
- Momentum & Growth: There seems to be less enthusiasm for growing companies, which is reflected in the negative performance of these two factors. However, it is worth noting that the Momentum factor in Japan has historically generated lower returns than in other markets. Japanese investors tend to prefer Mean-Reversion over Momentum strategies.
- Dividend Yield: Cheap companies tend to pay high dividends, which makes Value and Dividend Yield related factors. While Value was negative across all three regions, Dividend Yield was positive in Japan, which might be explained by the negative performance of the carry factor in foreign exchange. Japanese investors are well-known for pursuing carry strategies, which were unattractive in 2018 given the steep declines in emerging market currencies. Perhaps the strong performance of the Dividend Yield factor reflects Japanese investors reallocating capital from riskier emerging market currencies to high yielding local stocks.
Source: FactorResearch
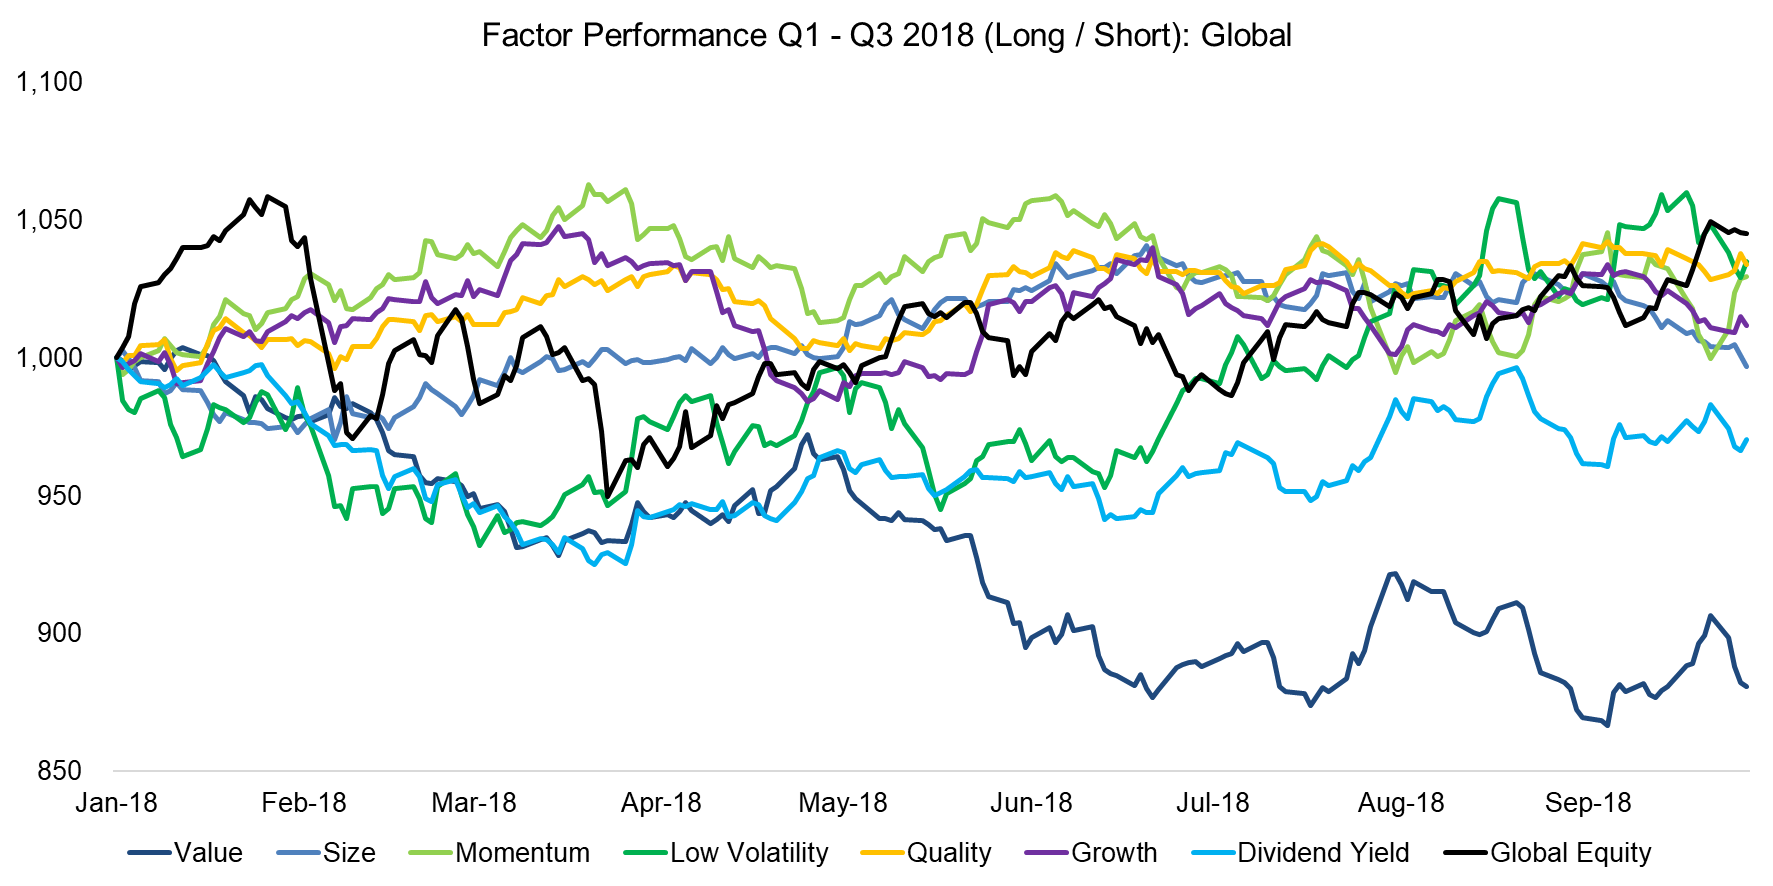
Factor Performance 2018: Performance Chart
The chart below shows the factor performance in the first three quarters of 2018 and we can identify one cluster of correlated factors, which comprises Growth, Quality and Momentum. The Technology sector currently contributes a significant amount of stocks to these three factors as Tech companies have shown strong growth in sales and earnings (Growth) and also feature high profitability and low levels of debt (Quality), which has led these stocks to outperform others (Momentum). It is worth highlighting the divergence of cheap (Value) and high yielding stocks (Dividend Yield) from May onwards.
Source: FactorResearch
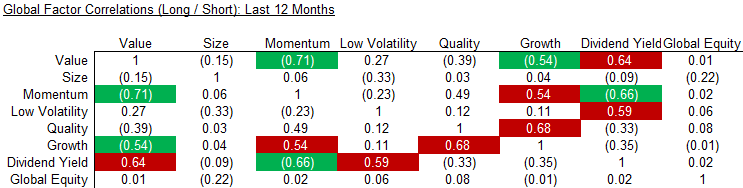
The correlation matrix below highlights the global one-year factor correlations. We can observe strong relationships between Momentum and Growth, Quality and Growth, and Low Volatility and Dividend Yield. Some of these are structural, e.g. Quality and Growth in the US have been correlated for many years. Low Volatility and Dividend Yield do not tend to be correlated, but both currently exhibit interest rate-sensitivity. Some factors show low or negative correlations, which can be accretive for creating diversified multi-factor portfolios.
Source: FactorResearch
Further Thoughts
Most multi-factor products feature Value as a core factor and the strongly negative performance of Value was not offset by other factors, implying that 2018 is not shaping up as a great year for factor-focused investors. Given that our factor returns are post transaction costs, but before fund expenses, realized returns from investible products will be even less attractive.
About The Author
Nicolas Rabener is the Managing Director of FactorResearch, which provides quantitative solutions for factor investing. Previously he founded Jackdaw Capital, an award-winning quantitative investment manager focused on equity market neutral strategies. Before that Nicolas worked at GIC (Government of Singapore Investment Corporation) in London focused on real estate investments across the capital structure. He started his career working in investment banking at Citigroup in London and New York. Nicolas holds a Master of Finance from HHL Leipzig Graduate School of Management, is a CAIA charter holder, and enjoys endurance sports (100km Ultramarathon, Mont Blanc, Mount Kilimanjaro).
Article by Factor Research

